Ottawa Centre (provincial electoral district)
Ottawa Centre is an urban provincial electoral district in Ontario, Canada that has been represented in the Legislative Assembly of Ontario since 1968. While the riding's boundaries (mainly to the south and west as the north and east borders have remained the Ottawa River and Rideau Canal, respectively) have changed over the years to account for population changes, the riding has always comprised the central areas of Ottawa, the nation's capital.
 Ottawa Centre in relation to other Ottawa electoral districts | |||
| Provincial electoral district | |||
| Legislature | Legislative Assembly of Ontario | ||
| MPP |
New Democratic | ||
| District created | 1966 | ||
| First contested | 1968 | ||
| Last contested | 2018 | ||
| Demographics | |||
| Population (2016) | 118,038 | ||
| Electors (2007) | 86,426 | ||
| Area (km²) | 35 | ||
| Pop. density (per km²) | 3,372.5 | ||
| Census division(s) | Ottawa | ||
| Census subdivision(s) | Ottawa | ||
History
The district was created before the 1967 election. Since the 1999 election, the provincial district has had the same borders as the federal riding of Ottawa Centre.
It is represented in the Legislative Assembly of Ontario by Joel Harden of the Ontario NDP. The provincial riding has been won by the NDP eight times (1971, 1975, 1977, 1981, 1984 by-election, 1985, 1990, and 2018) and by the Liberals eight times (1967, 1987, 1995, 1999, 2003, 2007, 2011, and 2014) and never by the Conservatives or any other party.
Geography
The riding covers most of downtown Ottawa, including the Parliament Buildings. From the historic Rideau Canal, the riding stretches west encompassing the neighbourhoods of Downtown, Centretown (Centretown West which includes Little Italy is usually considered a distinct neighbourhood), Lebreton Flats, Mechanicsville, Hintonburg and Westboro. The riding encompasses additional neighbourhoods south of downtown, including The Glebe, Old Ottawa South, Lees Avenue, Old Ottawa East and others.
Party support varies between different parts of the riding. The consistently best areas for the Ontario New Democratic Party (NDP) are Old Ottawa South, the Glebe, and Centretown. Old Ottawa South and the Glebe are also the main Green party areas. The suburban far south and west of the riding around Hog's Back and Carlingwood Park, the large homes near the Civic Hospital, the expensive homes and apartments by the Rideau Canal, and the more expensive downtown condos are the most strongly Liberal and Conservative areas. The major swing areas are the western portions of the riding such as Hintonburg and Westboro: while traditionally Liberal, these neighbourhoods have recently become stronger for the NDP.
Many public sector workers live in the riding. The northern part of the riding contains many government office buildings, including Parliament Hill. The riding also includes Carleton University and Saint Paul University's campuses and residences.
Members of Provincial Parliament
| Ottawa Centre | ||||
|---|---|---|---|---|
| Assembly | Years | Member | Party | |
| Riding created | ||||
| 28th | 1967–1971 | Harold MacKenzie | Liberal | |
| 29th | 1971–1975 | Michael Cassidy | New Democratic | |
| 30th | 1975–1977 | |||
| 31st | 1977–1981 | |||
| 32nd | 1981–1984 | |||
| 1984–1985 | Evelyn Gigantes | |||
| 33rd | 1985–1987 | |||
| 34th | 1987–1990 | Richard Patten | Liberal | |
| 35th | 1990–1995 | Evelyn Gigantes | New Democratic | |
| 36th | 1995–1999 | Richard Patten | Liberal | |
| 37th | 1999–2003 | |||
| 38th | 2003–2007 | |||
| 39th | 2007–2011 | Yasir Naqvi | ||
| 40th | 2011–2014 | |||
| 41st | 2014–2018 | |||
| 42nd | 2018–Present | Joel Harden | New Democratic | |
Election results
| 2018 Ontario general election | ||||||||
|---|---|---|---|---|---|---|---|---|
| Party | Candidate | Votes | % | ±% | ||||
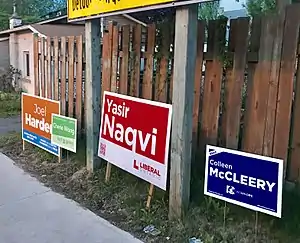
| New Democratic | Joel Harden | 29,675 | 46.08 | +25.69 | ||||
| Liberal | Yasir Naqvi | 21,111 | 32.78 | -18.89 | ||||
| Progressive Conservative | Colleen McCleery | 10,327 | 16.03 | -2.08 | ||||
| Green | Cherie Wong | 2,266 | 3.52 | -4.22 | ||||
| None of the Above | Marc Adornato | 437 | 0.68 | |||||
| Libertarian | Bruce A. Faulkner | 385 | 0.60 | -0.96 | ||||
| Communist | Stuart Ryan | 110 | 0.17 | -0.35 | ||||
| Canadians' Choice | James Sears | 92 | 0.14 | |||||
| Total valid votes | 64,403 | 100.0 | ||||||
| New Democratic gain from Liberal | Swing | +22.29 | ||||||
| Source: Elections Ontario[1] | ||||||||
| 2014 Ontario general election | ||||||||
|---|---|---|---|---|---|---|---|---|
| Party | Candidate | Votes | % | ±% | ||||
| Liberal | Yasir Naqvi | 27,689 | 52.02 | +4.86 | ||||
| New Democratic | Jennifer McKenzie | 10,894 | 20.47 | −8.74 | ||||
| Progressive Conservative | Rob Dekker | 9,678 | 18.18 | −0.21 | ||||
| Green | Kevin O'Donnell | 4,163 | 7.82 | +3.42 | ||||
| Libertarian | Bruce A. Faulkner | 525 | 0.99 | +1.08 | ||||
| Communist | Larry L. Wasslen | 283 | 0.53 | +0.21 | ||||
| Total valid votes | 53,232 | 100.0 | +5.74 | |||||
| Liberal hold | Swing | +6.80 | ||||||
Source(s) | ||||||||
| 2011 Ontario general election | ||||||||
|---|---|---|---|---|---|---|---|---|
| Party | Candidate | Votes | % | ±% | Expenditures | |||
| Liberal | Yasir Naqvi | 23,646 | 46.81 | +11.90 | $ 102,168.00 | |||
| New Democratic | Anil Naidoo | 14,715 | 29.13 | −1.77 | 83,779.02 | |||
| Progressive Conservative | Rob Dekker | 9,257 | 18.33 | −1.59 | 27,933.58 | |||
| Green | Kevin O'Donnell | 2,184 | 4.32 | −8.03 | 5,902.64 | |||
| Independent | Kristina Chapman | 309 | 0.61 | 3,418.00 | ||||
| Libertarian | Michal Zeithammel | 240 | 0.48 | 0.00 | ||||
| Communist | Stuart Ryan | 160 | 0.32 | −0.07 | 394.11 | |||
| Total valid votes / Expense Limit | 50,511 | 100.00 | −3.41 | $ 112,575.19 | ||||
| Total rejected, unmarked and declined ballots | 290 | 0.57 | −0.13 | |||||
| Turnout | 50,801 | 53.74 | −4.51 | |||||
| Eligible voters | 94,533 | +4.57 | ||||||
| Liberal hold | Swing | +6.34 | ||||||
Source(s)
"Summary of Valid Votes Cast for Each Candidate – October 6, 2011 General Election" (PDF). Elections Ontario. Retrieved May 28, 2014. "Statistical Summary – General Elections 2011" ( "2011 Candidate Campaign Returns (CR-1)". Retrieved May 28, 2014. | ||||||||

| 2007 Ontario general election | ||||||||
|---|---|---|---|---|---|---|---|---|
| Party | Candidate | Votes | % | ±% | Expenditures | |||
| Liberal | Yasir Naqvi | 18,255 | 34.91 | −10.19 | $ 74,103.43 | |||
| New Democratic | Will Murray | 16,161 | 30.90 | +7.92 | 76,746.81 | |||
| Progressive Conservative | Trina Morissette | 10,416 | 19.92 | −2.77 | 41,039.06 | |||
| Green | Greg Laxton | 6,458 | 12.35 | +4.62 | 9,967.33 | |||
| Family Coalition | Danny Moran | 516 | 0.99 | 627.00 | ||||
| Independent | Richard Eveleigh | 283 | 0.54 | 70.00 | ||||
| Communist | Stuart Ryan | 204 | 0.39 | −0.23 | 928.61 | |||
| Total valid votes/Expense Limit | 52,293 | 100.0 | +5.79 | $ 97,635.24 | ||||
| Total rejected ballots | 366 | 0.70 | −0.02 | |||||
| Turnout | 52,659 | 58.25 | +2.62 | |||||
| Eligible voters | 90,403 | +1.00 | ||||||
Source(s)
"Summary of Valid Votes Cast for Each Candidate – October 10, 2007 General Election" (PDF). Elections Ontario. Retrieved May 28, 2014. "Statistical Summary – General Elections 2007" (PDF). Elections Ontario. Retrieved May 28, 2014. "2007 Candidate Campaign Returns (CR-1)". Retrieved May 28, 2014. | ||||||||
| 2003 Ontario general election | ||||||||
|---|---|---|---|---|---|---|---|---|
| Party | Candidate | Votes | % | ±% | Expenditures | |||
| Liberal | Richard Patten | 22,295 | 45.10 | +6.93 | $ 72,458.74 | |||
| New Democratic | Jeff Atkinson | 11,362 | 22.98 | −2.48 | 49,598.63 | |||
| Progressive Conservative | Joe Varner | 11,217 | 22.69 | −10.05 | 17,112.70 | |||
| Green | Chris Bradshaw | 3,821 | 7.73 | +5.11 | 9,283.05 | |||
| Communist | Stuart Ryan | 306 | 0.62 | +0.25 | 878.30 | |||
| Freedom | Matt Szymanowicz | 218 | 0.44 | 0.00 | ||||
| Independent | Fakhry Guirguis | 214 | 0.43 | 1,094.74 | ||||
| Total valid votes/Expense Limit | 49,433 | 100.0 | +5.08 | $ 85,928.64 | ||||
| Total rejected ballots | 360 | 0.72 | −0.11 | |||||
| Turnout | 49,793 | 55.63 | +2.67 | |||||
| Eligible voters | 89,509 | −0.07 | ||||||
Source(s)
"General Election of October 2, 2003 — Summary of Valid Ballots by Candidate". Elections Ontario. Retrieved May 28, 2014. "General Election of October 2, 2003 — Statistical Summary". Elections Ontario. Retrieved May 28, 2014. "2003 Candidate and Constituency Association Returns — Candidate Campaign Returns (CR-1)". Retrieved May 28, 2014. | ||||||||
| 1999 Ontario general election | ||||||||
|---|---|---|---|---|---|---|---|---|
| Party | Candidate | Votes | % | ±% | Expenditures | |||
| Liberal | Richard Patten | 17,956 | 38.17 | −1.09 | $ 48,983.01 | |||
| Progressive Conservative | Ray Kostuch | 15,403 | 32.74 | +9.10 | 54,104.81 | |||
| New Democratic | Elisabeth Arnold | 11,977 | 25.46 | −7.77 | 58,863.46 | |||
| Green | Chris Bradshaw | 1,231 | 2.62 | +1.39 | 4,119.65 | |||
| Communist | Marvin Glass | 174 | 0.37 | −0.37 | 1,384.26 | |||
| Natural Law | Wayne Foster | 170 | 0.36 | −0.93 | 0.00 | |||
| Independent | Mistahi Corkill | 132 | 0.28 | 0.00 | ||||
| Total valid votes/Expense Limit | 47,043 | 100.0 | +65.64 | $ 85,987.20 | ||||
| Total rejected ballots | 395 | 0.83 | −0.27 | |||||
| Turnout | 47,438 | 52.96 | −10.92 | |||||
| Eligible voters | 89,570 | +99.23 | ||||||
Source(s)
"General Election of June 3 1999 — Summary of Valid Ballots by Candidate". Elections Ontario. Retrieved May 28, 2014. "General Election of June 3 1999 — Statistical Summary". Elections Ontario. Retrieved May 28, 2014. "1999 Summary of Income and Campaign Expenses – Candidate Campaign Returns (CR-1)". Retrieved May 28, 2014. | ||||||||
| 1995 Ontario general election | ||||||||
|---|---|---|---|---|---|---|---|---|
| Party | Candidate | Votes | % | ±% | Expenditures | |||
| Liberal | Richard Patten | 11,150 | 39.26 | +0.98 | $ 44,245.00 | |||
| New Democratic | Evelyn Gigantes | 9,438 | 33.23 | −14.47 | 39,455.24 | |||
| Progressive Conservative | Chris Thompson | 6,715 | 23.64 | +14.70 | 31,048.00 | |||
| Natural Law | Ron Parker | 365 | 1.29 | 0.00 | ||||
| Green | Andrew Van Iterson | 349 | 1.23 | −0.66 | 200.00 | |||
| Communist | Malek Khouri | 210 | 0.74 | 1,086.25 | ||||
| Independent | John C. Turmel | 173 | 0.61 | +0.08 | 0.00 | |||
| Total valid votes | 28,400 | 100.0 | −6.72 | |||||
| Total rejected ballots | 317 | 1.10 | ||||||
| Turnout | 28,717 | 63.88 | ||||||
| Eligible voters | 44,958 | |||||||
Source(s)
"General Election of June 8 1995 — Summary of Valid Ballots by Candidate". Elections Ontario. Retrieved May 28, 2014. "General Election of June 8 1995 — Statistical Summary". Elections Ontario. Retrieved May 28, 2014. "1995 Summary of Income and Campaign Expenses" ( | ||||||||
| 1990 Ontario general election | ||||||||
|---|---|---|---|---|---|---|---|---|
| Party | Candidate | Votes | % | ±% | ||||
| New Democratic | Evelyn Gigantes | 14,522 | 47.70 | +7.64 | ||||
| Liberal | Richard Patten | 11,656 | 38.28 | −8.88 | ||||
| Progressive Conservative | Alex Burney | 2,723 | 8.94 | −1.8 | ||||
| Family Coalition | John Gray | 809 | 2.66 | |||||
| Green | Bill Hipwell | 576 | 1.89 | |||||
| Independent | John Turmel | 160 | 0.53 | −1.50 | ||||
| Total valid votes | 30,446 | 100.0 | +3.54 | |||||
| 1987 Ontario general election | ||||||||
|---|---|---|---|---|---|---|---|---|
| Party | Candidate | Votes | % | ±% | ||||
| Liberal | Richard Patten | 13,867 | 47.16 | +21.20 | ||||
| New Democratic | Evelyn Gigantes | 11,780 | 40.06 | −3.39 | ||||
| Progressive Conservative | Greg Vezina | 3,159 | 10.74 | −18.51 | ||||
| Independent | John Turmel | 598 | 2.03 | +0.70 | ||||
| Total valid votes | 29,404 | 100.0 | +7.46 | |||||
| 1985 Ontario general election | ||||||||
|---|---|---|---|---|---|---|---|---|
| Party | Candidate | Votes | % | ±% | ||||
| New Democratic | Evelyn Gigantes | 11,890 | 43.45 | +1.69 | ||||
| Progressive Conservative | Graham Bird | 8,005 | 29.26 | −0.77 | ||||
| Liberal | Pat Legris | 7,103 | 25.96 | −0.65 | ||||
| Independent | John Turmel | 364 | 1.33 | +0.87 | ||||
| Total valid votes | 27,362 | 100.0 | +39.95 | |||||
| Ontario provincial by-election, December 13, 1984 | ||||||||
|---|---|---|---|---|---|---|---|---|
| Party | Candidate | Votes | % | ±% | ||||
| New Democratic | Evelyn Gigantes | 8,165 | 41.76 | +4.99 | ||||
| Progressive Conservative | Graham Bird | 5,870 | 30.02 | −4.38 | ||||
| Liberal | Lowell Green | 5,202 | 26.61 | −0.73 | ||||
| Green | Greg Vezina | 130 | 0.66 | |||||
| Independent | Ray Joseph Cormier | 94 | 0.48 | |||||
| Independent | John Turmel | 90 | 0.46 | −1.02 | ||||
| Total valid votes | 19,551 | 100.0 | −22.83 | |||||
| By-election called following Michael Cassidy's resignation to run federally. | ||||||||
| 1981 Ontario general election | ||||||||
|---|---|---|---|---|---|---|---|---|
| Party | Candidate | Votes | % | ±% | ||||
| New Democratic | Michael Cassidy | 9,316 | 36.77 | −4.79 | ||||
| Progressive Conservative | David Small | 8,717 | 34.41 | +2.25 | ||||
| Liberal | Karl Feige | 6,926 | 27.34 | +2.47 | ||||
| Independent | John Turmel | 376 | 1.48 | |||||
| Total valid votes | 25,335 | 100.0 | −0.91 | |||||
| 1977 Ontario general election | ||||||||
|---|---|---|---|---|---|---|---|---|
| Party | Candidate | Votes | % | ±% | ||||
| New Democratic | Michael Cassidy | 10,626 | 41.56 | +2.64 | ||||
| Progressive Conservative | Brian Cameron | 8,223 | 32.16 | −0.62 | ||||
| Liberal | Ian Kimmerly | 6,358 | 24.87 | −2.52 | ||||
| Communist | Marvin Glass | 360 | 1.41 | +0.5 | ||||
| Total valid votes | 25,567 | 100.0 | −6.64 | |||||
| 1975 Ontario general election | ||||||||
|---|---|---|---|---|---|---|---|---|
| Party | Candidate | Votes | % | ±% | ||||
| New Democratic | Michael Cassidy | 10,658 | 38.92 | +3.46 | ||||
| Progressive Conservative | Gale Kerwin | 8,978 | 32.78 | −1.88 | ||||
| Liberal | Gerald Kirby | 7,500 | 27.39 | −2.49 | ||||
| Communist | Marvin Glass | 250 | 0.91 | |||||
| Total valid votes | 27,386 | 100.0 | +20.26 | |||||
| 1971 Ontario general election | ||||||||
|---|---|---|---|---|---|---|---|---|
| Party | Candidate | Votes | % | ±% | ||||
| New Democratic | Michael Cassidy | 8,075 | 35.46 | +17.59 | ||||
| Progressive Conservative | Garry Guzzo | 7,893 | 34.66 | −4.4 | ||||
| Liberal | Rudy Capogreco | 6,804 | 29.88 | −13.19 | ||||
| Total valid votes | 22,772 | 100.0 | +27.57 | |||||
| 1967 Ontario general election | ||||||||
|---|---|---|---|---|---|---|---|---|
| Party | Candidate | Votes | % | |||||
| Liberal | Harold MacKenzie | 7,688 | 43.07 | |||||
| Progressive Conservative | Ivan Sparks | 6,973 | 39.06 | |||||
| New Democratic | Ivan Greenberg | 3,190 | 17.87 | |||||
| Total valid votes | 17,851 | 100.0 | ||||||
2007 electoral reform referendum
| 2007 Ontario electoral reform referendum | |||
|---|---|---|---|
| Side | Votes | % | |
| First Past the Post | 26,586 | 52.1 | |
| Mixed Member Proportional | 24,443 | 47.9 | |
| Total valid votes | 51,029 | 100.0 | |
Constituency associations
Sources
- "Summary of Valid Votes Cast for each Candidate" (PDF). Elections Ontario. p. 6. Retrieved 20 January 2019.