Bruce—Grey—Owen Sound (provincial electoral district)
Bruce—Grey—Owen Sound is a provincial electoral district in western Ontario, Canada. It elects one member to the Legislative Assembly of Ontario.
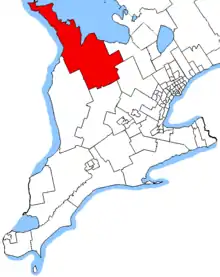 Bruce—Grey—Owen Sound in relation to other southwestern Ontario electoral districts | |||
| Provincial electoral district | |||
| Legislature | Legislative Assembly of Ontario | ||
| MPP |
Progressive Conservative | ||
| District created | 1999 | ||
| First contested | 1999 | ||
| Last contested | 2018 | ||
| Demographics | |||
| Population (2006) | 105,947 | ||
| Electors (2007) | 68,722 | ||
| Area (km²) | 6,447 | ||
| Pop. density (per km²) | 16.4 | ||
| Census division(s) | Bruce County, Ontario, Grey County, Ontario | ||
| Census subdivision(s) | West Grey, Hanover, Chatsworth, Meaford, Owen Sound, Georgian Bluffs, Arran-Elderslie, South Bruce Peninsula, Northern Bruce Peninsula, Neyaashiinigmiing, Saugeen 29, Southgate, Grey Highlands | ||
It was created in 1999 from parts of Bruce and Grey when ridings in Ontario were redistributed to match their federal counterparts.
The riding from 1999 to 2007 included the municipalities of West Grey, Hanover, Chatsworth, Meaford, Owen Sound, Georgian Bluffs, Arran-Elderslie, South Bruce Peninsula, Northern Bruce Peninsula, Neyaashiinigmiing, Saugeen 29, plus the eastern half of Brockton and South Bruce plus the northern third of Grey Highlands.
In 2007, the riding gained the municipality of Southgate, the rest of Grey Highlands, but lost the parts of Brockton and South Bruce in the riding.
The riding is notable for running a Green Party of Ontario candidate who received 33.1% of the popular vote in the 2007 election, one of largest shares of the popular vote the party has ever received in a single riding.
Members
| Bruce—Grey—Owen Sound | ||||
|---|---|---|---|---|
| Assembly | Years | Member | Party | |
| Riding created from Bruce and Grey | ||||
| 37th | 1999–2003 | Bill Murdoch | Progressive Conservative | |
| 38th | 2003–2007 | |||
| 39th | 2007–2011 | |||
| 40th | 2011–2014 | Bill Walker | ||
| 41st | 2014–2018 | |||
| 42nd | 2018–Present | |||
Election results
| 2018 Ontario general election | ||||||||
|---|---|---|---|---|---|---|---|---|
| Party | Candidate | Votes | % | ±% | ||||
| Progressive Conservative | Bill Walker | 26,874 | 54.70 | +7.15 | ||||
| New Democratic | Karen Gventer | 11,837 | 24.09 | +8.24 | ||||
| Liberal | Francesca Dobbyn | 6,041 | 12.30 | -14.76 | ||||
| Green | Don Marshall | 2,927 | 5.96 | -2.67 | ||||
| Trillium | Liz Marshall | 552 | 1.12 | |||||
| Alliance | Enos Martin | 442 | 0.90 | |||||
| Consensus Ontario | Janice Kaikkonen | 261 | 0.53 | |||||
| Libertarian | Jay Miller | 194 | 0.39 | -0.05 | ||||
| Total valid votes | 49,128 | 100.0 | ||||||
| Progressive Conservative hold | Swing | |||||||
| Source: Elections Ontario[1] | ||||||||
| 2014 Ontario general election | ||||||||
|---|---|---|---|---|---|---|---|---|
| Party | Candidate | Votes | % | ±% | ||||
| Progressive Conservative | Bill Walker | 20,359 | 47.55 | +0.18 | ||||
| Liberal | Ellen Anderson | 11,586 | 27.06 | +0.70 | ||||
| New Democratic | Karen Gventer | 6,787 | 15.85 | +1.00 | ||||
| Green | Jenny Parsons | 3,696 | 8.63 | +2.20 | ||||
| Freedom | Jamie D. Spence | 200 | 0.47 | – | ||||
| Libertarian | Caleb Voskamp | 188 | 0.44 | -0.16 | ||||
| Total valid votes | 42,816 | 100.0 | ||||||
| Progressive Conservative hold | Swing | -0.26 | ||||||
| Source: Elections Ontario[2] | ||||||||
| 2011 Ontario general election | ||||||||
|---|---|---|---|---|---|---|---|---|
| Party | Candidate | Votes | % | ±% | ||||
| Progressive Conservative | Bill Walker | 19,567 | 47.37 | +0.76 | ||||
| Liberal | Kevin Eccles | 10,889 | 26.36 | +11.43 | ||||
| New Democratic | Paul Johnstone | 6,133 | 14.85 | +11.06 | ||||
| Green | Don Marshall | 2,654 | 6.43 | -26.71 | ||||
| Independent | Shane Jolley | 1,478 | 3.58 | -29.56 | ||||
| Family Coalition | Joel Kidd | 339 | 0.82 | -0.39 | ||||
| Libertarian | Jay Miller | 246 | 0.60 | |||||
| Total valid votes | 41,306 | 100.00 | ||||||
| Total rejected, unmarked and declined ballots | 164 | 0.40 | ||||||
| Turnout | 41,470 | 54.70 | ||||||
| Eligible voters | 75,809 | |||||||
| Progressive Conservative hold | Swing | -5.34 | ||||||
| Source: Elections Ontario[3] | ||||||||
| 2007 Ontario general election | ||||||||
|---|---|---|---|---|---|---|---|---|
| Party | Candidate | Votes | % | ±% | ||||
| Progressive Conservative | Bill Murdoch | 21,156 | 46.61 | -5.46 | ||||
| Green | Shane Jolley | 15,039 | 33.14 | +31.42 | ||||
| Liberal | Selwyn Hicks | 6,774 | 14.93 | -18.27 | ||||
| New Democratic | Paul Johnstone | 1,721 | 3.79 | -5.49 | ||||
| Family Coalition | Irma de Vries | 550 | 1.21 | -1.21 | ||||
| Reform | William Cook | 145 | 0.32 | |||||
| Total valid votes | 45,385 | 100.00 | ||||||
| 2003 Ontario general election | ||||||||
|---|---|---|---|---|---|---|---|---|
| Party | Candidate | Votes | % | ±% | ||||
| Progressive Conservative | Bill Murdoch | 23,338 | 52.07 | -2.40 | ||||
| Liberal | Dave Hocking | 14,881 | 33.20 | -2.08 | ||||
| New Democratic | Colleen Purdon | 4,159 | 9.28 | +3.21 | ||||
| Family Coalition | Linda Freiburger | 1,086 | 2.42 | -0.95 | ||||
| Green | Martin Donald | 769 | 1.72 | +0.90 | ||||
| Independent | Bill Cook | 586 | 1.31 | |||||
| Total valid votes | 44,819 | 100.00 | ||||||
| 1999 Ontario general election | ||||||||
|---|---|---|---|---|---|---|---|---|
| Party | Candidate | Votes | % | |||||
| Progressive Conservative | Bill Murdoch | 24,915 | 54.47 | |||||
| Liberal | Ruth Lovell | 16,139 | 35.28 | |||||
| New Democratic | Colleen Purdon | 2,776 | 6.07 | |||||
| Family Coalition | John Clark | 1,540 | 3.37 | |||||
| Green | Grant Pattullo | 373 | 0.82 | |||||
| Total valid votes | 45,743 | 100.00 | ||||||
2007 electoral reform referendum
| 2007 Ontario electoral reform referendum | |||
|---|---|---|---|
| Side | Votes | % | |
| First Past the Post | 27,617 | 63.0 | |
| Mixed member proportional | 16,199 | 37.0 | |
| Total valid votes | 43,816 | 100.0 | |
Sources
- "Summary of Valid Votes Cast for each Candidate" (PDF). Elections Ontario. Archived from the original (PDF) on 28 December 2018. Retrieved 16 January 2019.
- Elections Ontario (2014). "Official return from the records, 010 Bruce-Grey-Owen Sound" (PDF). Retrieved 27 June 2015.
- Elections Ontario (2011). "Official return from the records / Rapport des registres officiels - Bruce—Grey—Owen Sound" (PDF). Retrieved 2 June 2014.