Ottawa—Vanier (provincial electoral district)
Ottawa—Vanier (formerly known as Ottawa East) is a provincial electoral district in Ottawa, Ontario, Canada, that has been represented in the Legislative Assembly of Ontario since 1908. It is located in the east end of Ottawa.
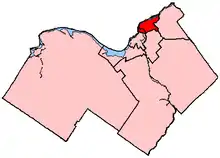 Ottawa—Vanier in relation to other Ottawa electoral districts | |||
| Provincial electoral district | |||
| Legislature | Legislative Assembly of Ontario | ||
| MPP |
Liberal | ||
| District created | 1908 | ||
| First contested | 1908 | ||
| Last contested | 2018 | ||
| Demographics | |||
| Population (2011) | 103,687 | ||
| Electors (2018) | 94,298 | ||
| Area (km²) | 39 | ||
| Pop. density (per km²) | 2,658.6 | ||
| Census division(s) | Carleton County (1908-1969) Ottawa-Carleton (1969-2001) Ottawa (2001-present) | ||
| Census subdivision(s) | Ottawa Eastview (1967-1969) Vanier (1969-2001) Rockcliffe Park (1999-2001) Gloucester (1987-2001) | ||
The riding was represented in the Legislative Assembly by Liberal Madeleine Meilleur from 2003 until her resignation in June 2016.
The riding, with a large Franco-Ontarian population in Vanier, Overbrook, Lower Town, and in adjoining neighbourhoods, has been one of the most solidly Liberal in the country in recent years, having elected Liberals both federally and provincially in every election since 1971.
A sizable minority of the riding is in the former city of Vanier, which was merged with Ottawa in 2000. Vanier has long been home to much of Ottawa's francophone population, but between 1992 and 2001, the size of this linguistic group has fallen by almost 50%. Since 2003, the population of the entire riding has fallen by almost 10% at a time when the rest of the nation's capital increased by approximately 5.2%. The riding now has the second oldest population in Ottawa.
In many ways the riding which used to be known as a French riding with an English face has become a largely English-speaking riding (65%) with a French face. The riding also contains the wealthiest part of Ottawa, Rockcliffe Park, which gives some support to the Progressive Conservatives, but also to the Liberals. The neighbourhoods with higher proportions of anglophone residents, including Sandy Hill and New Edinburgh also tend to vote Liberal, but with significant support for the Ontario New Democratic Party. The riding is characterized by below average voter turn-out and an annual loss of approximately 1% in voter support for the provincial Liberals since 1987 thereby reducing their support from approximately 74% to 50% (1987–2007).
Geography
In 2003, it was redefined as the part of the City of Ottawa east and north of a line running south along the Rideau Canal from the interprovincial boundary to Mann Avenue, northeast to Nicholas Street, southeast to Highway No. 417, and east to the abandoned Canadian Pacific Railway to the hydroelectric transmission line, north to Innes Road, northeast to Blair Road, northwest to Montreal Road, east and northeast to Regional Road No. 174, northeast to Green's Creek, north to the Ottawa River. It contains the neighbourhoods of Beacon Hill North, Cardinal Glen, Carson Grove, Carson Meadows, Castle Heights, Cyrville, Forbes, Lindenlea, Lower Town, Manor Park, New Edinburgh, Overbook, Pineview, Rockcliffe Park, Sandy Hill, Rothwell Heights, Vanier and Viscount Alexander Park.
Demographics
According to the Canada 2011 Census[1][2]
- Ethnic Groups: 71.9% White, 9.5% Black, 3.5% Arab, 3.1% South Asian, 2.8% Aboriginal, 2.3% Chinese, 1.7% Latin American, 1.4% Filipino, 1.3% Southeast Asian, 1.1% West Asian
- Languages: 51.8% English, 30.6% French, 3.5% Arabic, 1.8% Spanish, 1.5% Chinese, 1.1% Creoles
- Religion: 65.9% Christian (44.6% Catholic, 4.7% Anglican, 3.3% United Church, 1.5% Christian Orthodox, 1.1% Baptist, 9.7% Other Christian), 7.6% Muslim, 22.8% No religion.
- Average household income: $77,347
- Median household income: $57,035
- Average individual income: $45,200
- Median individual income: $32,421
History
The provincial electoral district was created in 1908 as "Ottawa East". The name was changed to "Ottawa—Vanier" in 1999.
Members of the Legislative Assembly/Members of Provincial Parliament
This riding has elected the following members of the Legislative Assembly of Ontario:
1 In 1938, the title of members of the Legislative Assembly of Ontario was changed from "Members of the Legislative Assembly" (MLAs) to "Members of Provincial Parliament" (MPPs).
Election results
| Ontario provincial by-election, February 27, 2020 Resignation of Nathalie Des Rosiers | ||||||||
|---|---|---|---|---|---|---|---|---|
| Party | Candidate | Votes | % | ±% | ||||
| Liberal | Lucille Collard | 10,404 | 52.22 | +9.36 | ||||
| New Democratic | Myriam Djilane | 5,031 | 25.25 | -4.42 | ||||
| Progressive Conservative | Patrick Mayangi | 2,329 | 11.69 | -9.69 | ||||
| Green | Benjamin Koczwarski | 1,709 | 8.58 | +4.50 | ||||
| Independent | Julie Fiala | 188 | 0.94 | |||||
| Libertarian | Ken Lewis | 129 | 0.65 | -0.04 | ||||
| None of the Above | Above Znoneofthe | 95 | 0.48 | -0.38 | ||||
| Ontario Alliance | J. Justin O'Donnell | 38 | 0.19 | |||||
| Total valid votes | 19,923 | 99.45% | ||||||
| Total declined, rejected and unmarked ballots | 110 | 0.55% | ||||||
| Turnout | 19.89 | -27.33 | ||||||
| Eligible voters | 100,190 | |||||||
| Liberal hold | Swing | +6.89 | ||||||
| 2018 Ontario general election | ||||||||
|---|---|---|---|---|---|---|---|---|
| Party | Candidate | Votes | % | ±% | ||||
| Liberal | Nathalie Des Rosiers | 20,555 | 42.86 | −6.33 | ||||
| New Democratic | Lyra Evans | 14,232 | 29.68 | +15.03 | ||||
| Progressive Conservative | Fadi Nemr | 10,252 | 21.38 | −8.34 | ||||
| Green | Sheilagh McLean | 1,955 | 4.08 | +0.82 | ||||
| None of the Above | Keegan Bennett | 413 | 0.86 | +0.32 | ||||
| Libertarian | Ken Lewis | 332 | 0.69 | +0.11 | ||||
| Freedom | David McGruer | 219 | 0.46 | +0.29 | ||||
| Total valid votes | 47,958 | 98.80 | ||||||
| Total rejected ballots | 581 | 1.20 | +0.70 | |||||
| Turnout | 48,539 | 51.47 | +14.10 | |||||
| Eligible voters | 94,298 | |||||||
| Liberal hold | Swing | -10.68 | ||||||
| Source: Elections Ontario[3] | ||||||||
| Ontario provincial by-election, November 17, 2016 Resignation of Madeleine Meilleur | ||||||||
|---|---|---|---|---|---|---|---|---|
| Party | Candidate | Votes | % | ±% | ||||
| Liberal | Nathalie Des Rosiers | 14,979 | 49.19 | -6.37 | ||||
| Progressive Conservative | André Marin | 9,051 | 29.72 | +7.43 | ||||
| New Democratic | Claude Bisson | 4,459 | 14.64 | +1.33 | ||||
| Green | Raphaël Morin | 993 | 3.26 | -4.75 | ||||
| Stop the New Sex-Ed Agenda | Elizabeth de Viel Castel | 384 | 1.26 | |||||
| Libertarian | Dean T. Harris | 177 | 0.58 | -0.26 | ||||
| None of the Above | Above Znoneofthe | 164 | 0.54 | |||||
| Canadian Constituents' | Stephanie McEvoy | 74 | 0.24 | |||||
| People's Political Party | Kevin Clarke | 73 | 0.24 | |||||
| Freedom | David McGruer | 52 | 0.17 | |||||
| Pauper | John Turmel | 48 | 0.16 | |||||
| Total valid votes | 30,454 | 99.50 | ||||||
| Total rejected ballots | 153 | 0.50 | -0.80 | |||||
| Turnout | 30,607 | 37.36 | -11.49 | |||||
| Eligible voters | 81,902 | |||||||
| Liberal hold | Swing | -6.90 | ||||||
Source(s)
Elections Ontario[4] | ||||||||
| 2014 Ontario general election | ||||||||
|---|---|---|---|---|---|---|---|---|
| Party | Candidate | Votes | % | ±% | ||||
| Liberal | Madeleine Meilleur | 21,810 | 55.55 | +4.04 | ||||
| Progressive Conservative | Martin Forget | 8,750 | 22.29 | -1.16 | ||||
| New Democratic | Hervé Ngamby | 5,228 | 13.32 | -6.29 | ||||
| Green | Dave Bagler | 3,144 | 8.01 | +3.49 | ||||
| Libertarian | Phillip Richard | 329 | 0.84 | |||||
| Total valid votes | 39,261 | 98.70 | ||||||
| Total rejected, unmarked and declined ballots | 517 | 1.30 | +0.88 | |||||
| Turnout | 39,778 | 48.86 | +2.05 | |||||
| Eligible voters | 81,412 | |||||||
| Liberal hold | Swing | +2.60 | ||||||
Source(s) | ||||||||
| 2011 Ontario general election | ||||||||
|---|---|---|---|---|---|---|---|---|
| Party | Candidate | Votes | % | ±% | Expenditures | |||
| Liberal | Madeleine Meilleur | 19,619 | 51.51 | +0.55 | $ 52,761.46 | |||
| Progressive Conservative | Fred Sherman | 8,929 | 23.44 | +1.14 | 46,634.99 | |||
| New Democratic | Paul Étienne Laliberté-Tipple | 7,466 | 19.60 | +4.89 | 26,579.32 | |||
| Green | Dave Bagler | 1,719 | 4.51 | −5.93 | 28,290.65 | |||
| Family Coalition | Emmanuel Houle | 352 | 0.92 | −0.04 | 3,081.81 | |||
| Total valid votes / Expense limit | 38,085 | 99.58 | $ 97,305.11 | |||||
| Total rejected, unmarked and declined ballots | 161 | 0.42 | −0.24 | |||||
| Turnout | 38,246 | 46.81 | −4.69 | |||||
| Eligible voters | 81,712 | |||||||
| Liberal hold | Swing | −0.30 | ||||||
Source(s)
"Summary of Valid Votes Cast for Each Candidate – October 6, 2011 General Election" (PDF). "Statistical Summary – General Elections 2011" ( "2011 Candidate Campaign Returns (CR-1)". Retrieved May 31, 2014. | ||||||||
| 2007 Ontario general election | ||||||||
|---|---|---|---|---|---|---|---|---|
| Party | Candidate | Votes | % | ±% | Expenditures | |||
| Liberal | Madeleine Meilleur | 20,954 | 50.96 | −1.16 | $ 67,322.66 | |||
| Progressive Conservative | Bruce Poulin | 9,169 | 22.30 | −3.87 | 46,691.00 | |||
| New Democratic | Ric Dagenais | 6,049 | 14.71 | −1.41 | 38,228.43 | |||
| Green | Leonard Poole | 4,293 | 10.44 | +4.86 | 10,062.52 | |||
| Family Coalition | Frank Cioppa | 396 | 0.96 | 1,599.17 | ||||
| Independent | Robert Larter | 255 | 0.62 | 0.00 | ||||
| Total valid votes/Expense limit | 41,116 | 99.34 | $ 86,807.16 | |||||
| Total rejected ballots | 274 | 0.66 | ||||||
| Turnout | 41,390 | 51.49 | ||||||
| Eligible voters | 80,377 | |||||||
| Liberal hold | Swing | +1.36 | ||||||
Source(s) | ||||||||
^ Change is from redistributed results.
| 2003 general election redistributed results[5] | |||
|---|---|---|---|
| Party | Vote | % | |
| Liberal | 19,271 | 52.12 | |
| Progressive Conservative | 9,676 | 26.17 | |
| New Democratic | 5,962 | 16.13 | |
| Green | 2,063 | 5.58 | |
| 2003 Ontario general election | ||||||||
|---|---|---|---|---|---|---|---|---|
| Party | Candidate | Votes | % | ±% | Expenditures | |||
| Liberal | Madeleine Meilleur | 22,188 | 53.53 | +0.50 | $ 56,519.01 | |||
| Progressive Conservative | Maurice Lamirande | 10,878 | 26.24 | −5.57 | 25,275.00 | |||
| New Democratic | Joseph Zebrowski | 6,507 | 15.70 | +5.19 | 21,295.58 | |||
| Green | Raphael Thierrin | 1,876 | 4.53 | +2.12 | 591.94 | |||
| Total valid votes/Expense limit | 41,449 | 99.05 | +4.62 | $ 79,080.96 | ||||
| Total rejected ballots | 399 | 0.95 | −0.04 | |||||
| Turnout | 41,848 | 50.80 | +1.68 | |||||
| Eligible voters | 82,376 | +1.12 | ||||||
| Liberal hold | Swing | +3.04 | ||||||
| 1999 Ontario general election | ||||||||
|---|---|---|---|---|---|---|---|---|
| Party | Candidate | Votes | % | ±% | Expenditures | |||
| Liberal | Claudette Boyer | 21,009 | 53.03 | −3.91 | $ 29,251.18 | |||
| Progressive Conservative | Maurice Lamirande | 12,605 | 31.81 | +10.64 | 26,664.80 | |||
| New Democratic | David Gagnon | 4,163 | 10.51 | −8.49 | 19,834.85 | |||
| Green | Richard Briggs | 953 | 2.41 | +1.09 | 0.00 | |||
| Natural Law | Pierrette Blondin | 580 | 1.46 | +0.43 | 0.00 | |||
| Independent | Kevin Corkill | 310 | 0.78 | 49.11 | ||||
| Total valid votes/Expense limit | 39,620 | 99.01 | +56.27 | $ 78,205.44 | ||||
| Total rejected ballots | 395 | 0.99 | −0.30 | |||||
| Turnout | 40,015 | 49.12 | −4.09 | |||||
| Eligible voters | 81,464 | +68.76 | ||||||
| 1995 Ontario general election: Ottawa East | ||||||||
|---|---|---|---|---|---|---|---|---|
| Party | Candidate | Votes | % | ±% | Expenditures | |||
| Liberal | Bernard Grandmaître | 14,436 | 56.94 | −5.47 | $ 19,824.52 | |||
| Progressive Conservative | Cynthia Bled | 5,368 | 21.17 | +12.77 | 28,483.15 | |||
| New Democratic | David Dyment | 4,818 | 19.00 | −4.27 | 17,425.03 | |||
| Green | Larry Tyldsley | 335 | 1.32 | −1.44 | 524.72 | |||
| Natural Law | Robert Mayer | 261 | 1.03 | 0.00 | ||||
| Independent | Steven White | 136 | 0.54 | 0.00 | ||||
| Total valid votes/Expense limit | 25,354 | 98.71 | $ 45,818.00 | |||||
| Total rejected ballots | 331 | 1.29 | +0.07 | |||||
| Turnout | 25,685 | 53.21 | -2.02 | |||||
| Eligible voters | 48,272 | |||||||
| Liberal hold | Swing | -9.12 | ||||||
Source(s)
"General Election of June 8 1995 – Summary of Valid Ballots by Candidate". Retrieved May 31, 2014. "General Election of June 8 1995 – Statistical Summary". Elections Ontario. "1995 Details of Candidate Income and Expenses" (3.16MB). & "1995 Summary of Income and Campaign Expenses" ( | ||||||||
| 1990 Ontario general election: Ottawa East | ||||||||
|---|---|---|---|---|---|---|---|---|
| Party | Candidate | Votes | % | ±% | ||||
| Liberal | Bernard Grandmaître | 16,363 | 62.41 | −11.85 | ||||
| New Democratic | Lori Lucier | 6,103 | 23.28 | +7.07 | ||||
| Progressive Conservative | Diana Morin | 2,203 | 8.40 | −1.13 | ||||
| Family Coalition | Richard Hudon | 826 | 3.15 | |||||
| Green | Frank de Jong | 723 | 2.76 | |||||
| Total valid votes | 26,218 | 98.78 | ||||||
| Total rejected ballots | 324 | 1.22 | ||||||
| Turnout | 26,542 | 55.23 | ||||||
| Eligible voters | 48,055 | |||||||
| Liberal hold | Swing | -9.46 | ||||||
| 1987 Ontario general election: Ottawa East | ||||||||
|---|---|---|---|---|---|---|---|---|
| Party | Candidate | Votes | % | ±% | ||||
| Liberal | Bernard Grandmaître | 18,959 | 74.26 | +5.86 | ||||
| New Democratic | Alex Connelly | 4,137 | 16.20 | −2.40 | ||||
| Progressive Conservative | Corinne Price | 2,435 | 9.54 | −1.03 | ||||
| Total valid votes | 25,531 | 100.0 | +19.60 | |||||
| 1985 Ontario general election: Ottawa East | ||||||||
|---|---|---|---|---|---|---|---|---|
| Party | Candidate | Votes | % | ±% | ||||
| Liberal | Bernard Grandmaître | 14,601 | 68.40 | +0.03 | ||||
| New Democratic | Kathryn Barnard | 3,971 | 18.60 | +5.1 | ||||
| Progressive Conservative | Paul St. Georges | 2,257 | 10.57 | −6.48 | ||||
| Independent | Serge Girard | 518 | 2.43 | +1.35 | ||||
| Total valid votes | 21,347 | 100.0 | +88.23 | |||||
| Ontario provincial by-election, December 13, 1984: Ottawa East Resignation of Albert J. Roy | ||||||||
|---|---|---|---|---|---|---|---|---|
| Party | Candidate | Votes | % | ±% | ||||
| Liberal | Bernard Grandmaître | 7,754 | 68.37 | −0.85 | ||||
| Progressive Conservative | Richard Boudreau | 1,934 | 17.05 | −3.58 | ||||
| New Democratic | Jean Gilbert | 1,531 | 13.50 | +4.22 | ||||
| Independent | Serge Girard | 122 | 1.08 | +0.21 | ||||
| Total valid votes | 11,341 | 100.0 | −44.74 | |||||
| 1981 Ontario general election: Ottawa East | ||||||||
|---|---|---|---|---|---|---|---|---|
| Party | Candidate | Votes | % | ±% | ||||
| Liberal | Albert J. Roy | 14,207 | 69.22 | +1.78 | ||||
| Progressive Conservative | Omar Deslauriers | 4,235 | 20.63 | +3.39 | ||||
| New Democratic | Danielle Page | 1,905 | 9.28 | −6.04 | ||||
| Independent | Serge Girard | 177 | 0.86 | |||||
| Total valid votes | 20,524 | 100.0 | −12.75 | |||||
| 1977 Ontario general election: Ottawa East | ||||||||
|---|---|---|---|---|---|---|---|---|
| Party | Candidate | Votes | % | ±% | ||||
| Liberal | Albert J. Roy | 15,864 | 67.44 | +6.48 | ||||
| Progressive Conservative | Gisèle Lalonde | 4,055 | 17.24 | -3.22 | ||||
| New Democratic | Robert Choquette | 3,605 | 15.32 | -3.26 | ||||
| Total valid votes | 23,524 | 100.00 | ||||||
| 1975 Ontario general election: Ottawa East | ||||||||
|---|---|---|---|---|---|---|---|---|
| Party | Candidate | Votes | % | ±% | ||||
| Liberal | Albert J. Roy | 14,900 | 60.96 | +8.44 | ||||
| Progressive Conservative | David Dehler | 5,001 | 20.46 | -7.19 | ||||
| New Democratic | Robert Cournoyer | 4,543 | 18.59 | +1.17 | ||||
| Total valid votes | 24,444 | 100.00 | ||||||
| 1971 Ontario general election: Ottawa East | ||||||||
|---|---|---|---|---|---|---|---|---|
| Party | Candidate | Votes | % | ±% | ||||
| Liberal | Albert J. Roy | 10,827 | 52.52 | +6.15 | ||||
| Progressive Conservative | Jules Morin | 5,700 | 27.65 | -18.79 | ||||
| New Democratic | Denis Deneau | 3,590 | 17.41 | +10.22 | ||||
| Independent | Richard Morin | 499 | 2.42 | |||||
| Total valid votes | 20,616 | 100.00 | ||||||
| 1967 Ontario general election: Ottawa East | ||||||||
|---|---|---|---|---|---|---|---|---|
| Party | Candidate | Votes | % | |||||
| Progressive Conservative | Jules Morin | 8,155 | 46.44 | |||||
| Liberal | Horace Racine | 8,143 | 46.37 | |||||
| New Democratic | Frederick R. Cote | 1,263 | 7.19 | |||||
| Total valid votes | 17,561 | 100.00 | ||||||
- 1933-1966
- Ottawa Ward, By Ward, Rideau Ward, St. George's Ward, Riverdale Ward (east of Main Street), Victoria Ward (east of Parkdale Avenue)
| 1963 Ontario general election: Ottawa East | ||||||||
|---|---|---|---|---|---|---|---|---|
| Party | Candidate | Votes | % | |||||
| Liberal | Horace Racine | 8,814 | 50.87 | |||||
| Progressive Conservative | Jules Morin | 7,461 | 44.06 | |||||
| New Democratic | Harry Pope | 857 | 5.06 | |||||
| Total valid votes | 16,932 | 100.00 | ||||||
| 1959 Ontario general election: Ottawa East | ||||||||
|---|---|---|---|---|---|---|---|---|
| Party | Candidate | Votes | % | |||||
| Progressive Conservative | Jules Morin | 7,965 | 49.27 | |||||
| Liberal | Paul Leduc | 7,652 | 47.34 | |||||
| Co-operative Commonwealth | Donald F. Prot | 548 | 3.39 | |||||
| Total valid votes | 16,165 | 100.00 | ||||||
| 1955 Ontario general election: Ottawa East | ||||||||
|---|---|---|---|---|---|---|---|---|
| Party | Candidate | Votes | % | |||||
| Progressive Conservative | Jules Morin | 8,688 | 51.32 | |||||
| Liberal | Aurèle Chartrand | 7,586 | 44.81 | |||||
| Co-operative Commonwealth | Henri Robert | 654 | 3.86 | |||||
| Total valid votes | 16,928 | 100.00 | ||||||
| 1951 Ontario general election: Ottawa East | ||||||||
|---|---|---|---|---|---|---|---|---|
| Party | Candidate | Votes | % | |||||
| Liberal | Aurèle Chartrand | 10,722 | 50.08 | |||||
| Progressive Conservative | Henri St. Jacques | 8,447 | 39.45 | |||||
| Co-operative Commonwealth | Henri Robert | 2,242 | 10.47 | |||||
| Total valid votes | 21,411 | 100.00 | ||||||
| 1948 Ontario general election: Ottawa East | ||||||||
|---|---|---|---|---|---|---|---|---|
| Party | Candidate | Votes | % | |||||
| Liberal | Aurèle Chartrand | 9,407 | 45.83 | |||||
| Progressive Conservative | Lorenzo Lafleur | 7,777 | 37.88 | |||||
| Co-operative Commonwealth | Henri Robert | 2,857 | 13.93 | |||||
| Union of Electors | Patrice Brunet | 485 | 2.36 | |||||
| Total valid votes | 20,528 | 100.00 | ||||||
| 1945 Ontario general election: Ottawa East | ||||||||
|---|---|---|---|---|---|---|---|---|
| Party | Candidate | Votes | % | |||||
| Liberal | Aurèle Chartrand | 10,725 | 42.36 | |||||
| Liberal | A. Vincent | 6,017 | 23.77 | |||||
| Progressive Conservative | C. A. McDonald | 5,287 | 20.88 | |||||
| Co-operative Commonwealth | A. A. Marchand | 2,234 | 8.82 | |||||
| Independent | J. C. Beauchamp | 464 | 1.83 | |||||
| Independent | M. Feller | 342 | 1.35 | |||||
| Social Credit | A. Denomme | 247 | 0.98 | |||||
| Total valid votes | 25,316 | 100.00 | ||||||
| 1943 Ontario general election: Ottawa East | ||||||||
|---|---|---|---|---|---|---|---|---|
| Party | Candidate | Votes | % | |||||
| Liberal | Robert Laurier | 11,004 | 74.70 | |||||
| Progressive Conservative | James A. Cornier | 2,811 | 19.08 | |||||
| Independent | Max Feller | 916 | 6.22 | |||||
| Total valid votes | 14,731 | 100.00 | ||||||
| Ontario provincial by-election, 1940: Ottawa East | ||||||||
|---|---|---|---|---|---|---|---|---|
| Party | Candidate | Votes | % | |||||
| Liberal | Robert Laurier | 10,193 | 91.43 | |||||
| Social Credit | M. Alexandre Denomme | 625 | 5.61 | |||||
| Independent Liberal | Aldege Scott | 331 | 2.97 | |||||
| Total valid votes | 11,149 | 100.00 | ||||||
| 1937 Ontario general election: Ottawa East | ||||||||
|---|---|---|---|---|---|---|---|---|
| Party | Candidate | Votes | % | |||||
| Liberal | Paul Leduc | 16,920 | 79.65 | |||||
| Conservative | M. Nelson J. Lacasse | 3,786 | 17.82 | |||||
| Social Credit | M. Alexandre Denomme | 538 | 2.53 | |||||
| Total valid votes | 21,244 | 100.00 | ||||||
| 1934 Ontario general election: Ottawa East | ||||||||
|---|---|---|---|---|---|---|---|---|
| Party | Candidate | Votes | % | |||||
| Liberal | Paul Leduc | 10,315 | 43.37 | |||||
| Conservative | Eugene J. Labelle | 7,275 | 30.59 | |||||
| Independent Liberal | Joseph Albert Pinard | 6,116 | 25.71 | |||||
| Independent Liberal | Aurelian Rose | 79 | 0.33 | |||||
| Total valid votes | 23,785 | 100.00 | ||||||
- 1908-1933
- Ottawa Ward, By Ward, Rideau Ward, St. George's Ward
| 1929 Ontario general election: Ottawa East | ||||||||
|---|---|---|---|---|---|---|---|---|
| Party | Candidate | Votes | % | |||||
| Conservative | Louis Côté | 7,813 | 57.72 | |||||
| Liberal | Joseph Albert Pinard | 5,724 | 42.28 | |||||
| Total valid votes | 13,537 | 100.00 | ||||||
| 1926 Ontario general election: Ottawa East | ||||||||
|---|---|---|---|---|---|---|---|---|
| Party | Candidate | Votes | % | |||||
| Independent Liberal | Joseph Albert Pinard | 5,195 | 43.86 | |||||
| Conservative | Moses Doctor | 4,777 | 40.33 | |||||
| Independent Conservative | Eugene J. Labelle | 1,872 | 15.81 | |||||
| Total valid votes | 11,844 | 100.00 | ||||||
| 1923 Ontario general election: Ottawa East | ||||||||
|---|---|---|---|---|---|---|---|---|
| Party | Candidate | Votes | % | |||||
| Liberal | Joseph Albert Pinard | 4,635 | 59.35 | |||||
| Liberal | J. Wilfred Gauvreau | 3,175 | 40.65 | |||||
| Total valid votes | 7,810 | 100.00 | ||||||
| 1919 Ontario general election: Ottawa East | ||||||||
|---|---|---|---|---|---|---|---|---|
| Party | Candidate | Votes | % | |||||
| Liberal | Joseph Albert Pinard | 7,309 | 63.57 | |||||
| Labour | Videle Lafontaine | 2,878 | 25.03 | |||||
| Conservative | Olivier Durocher | 1,311 | 11.40 | |||||
| Total valid votes | 11,498 | 100.00 | ||||||
| 1914 Ontario general election: Ottawa East | ||||||||
|---|---|---|---|---|---|---|---|---|
| Party | Candidate | Votes | % | |||||
| Liberal | Joseph Albert Pinard | 2,842 | 53.74 | |||||
| Conservative | Napoléon Champagne | 1,978 | 37.41 | |||||
| Independent Liberal | John G. Kilt | 468 | 8.85 | |||||
| Total valid votes | 5,288 | 100.00 | ||||||
| 1911 Ontario general election: Ottawa East | ||||||||
|---|---|---|---|---|---|---|---|---|
| Party | Candidate | Votes | % | |||||
| Conservative | Napoléon Champagne | 2,842 | 64.46 | |||||
| Liberal | Louis J. Kehoe | 1,567 | 35.54 | |||||
| Total valid votes | 4,409 | 100.00 | ||||||
| 1908 Ontario general election: Ottawa East | ||||||||
|---|---|---|---|---|---|---|---|---|
| Party | Candidate | Votes | % | |||||
| Liberal | Donald Joseph McDougal | 2,798 | 54.54 | |||||
| Conservative | Napoléon Champagne | 2,332 | 45.46 | |||||
| Total valid votes | 5,130 | 100.00 | ||||||
2007 electoral reform referendum
| 2007 Ontario electoral reform referendum | |||
|---|---|---|---|
| Side | Votes | % | |
| First Past the Post | 24,562 | 61.12 | |
| Mixed Member Proportional | 15,624 | 38.88 | |
| Total | 40,186 | ||
References
- https://www12.statcan.gc.ca/nhs-enm/2011/dp-pd/prof/details/Page.cfm?Lang=E&Geo1=FED&Code1=35065&Data=Count&SearchText=Ottawa%20-%20Vanier&SearchType=Begins&SearchPR=01&A1=All&B1=All&GeoLevel=PR&GeoCode=10#tabs1
- "Summary of Valid Votes Cast for each Candidate" (PDF). Elections Ontario. p. 8. Retrieved 20 January 2019.
- "Internet Application - Search Candidates". Elections Ontario.
- https://web.archive.org/web/20071012015305/http://www.elections.on.ca/NR/rdonlyres/58B42005-4D29-433A-B555-39A7DC0660D5/0/Transposition_of_votes.xls