Peterborough—Kawartha (provincial electoral district)
Peterborough—Kawartha (formerly Peterborough) is a provincial electoral district in Ontario, Canada, that has been represented in the Legislative Assembly of Ontario since 1934.
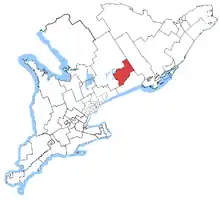 Peterborough—Kawartha in relation to southern Ontario ridings | |||
| Provincial electoral district | |||
| Legislature | Legislative Assembly of Ontario | ||
| MPP |
Progressive Conservative | ||
| First contested | 1934 | ||
| Last contested | 2018 | ||
| Demographics | |||
| Population (2006) | 116,626 | ||
| Electors (2011) | 92,317 | ||
| Area (km²) | 2,175 | ||
| Pop. density (per km²) | 53.6 | ||
| Census division(s) | Peterborough County | ||
| Census subdivision(s) | Peterborough, Selwyn, Douro-Dummer, Otonabee–South Monaghan, Havelock-Belmont-Methuen, Asphodel-Norwood | ||
It now consists of the City of Peterborough and the municipalities of Douro-Dummer, Trent Lakes, Havelock-Belmont-Methuen, North Kawartha and Selwyn plus the Curve Lake First Nation. Before 2018, it consisted of the County of Peterborough, excluding the townships of North Kawartha, Galway-Cavendish and Harvey and Cavan-Millbrook-North Monaghan.
The riding has voted for the party that has won the most seats in every election since 1977.
As part of the 2015 electoral redistribution, the district was renamed Peterborough—Kawartha. It lost the Townships of Otonabee-South Monaghan, Asphodel-Norwood, and the Hiawatha First Nation, while subsequently gaining the townships of Trent Lakes and North Kawartha. The 2018 election is the first with the new boundaries.
Members of Provincial Parliament
| Peterborough | ||||
|---|---|---|---|---|
| Assembly | Years | Member | Party | |
| Peterborough City and Peterborough County ridings merged to form Peterborough |
||||
| 19th | 1934–1937 | Thomas Percival Lancaster | Conservative | |
| 20th | 1937–1943 | Alexander Leslie Elliott | Liberal | |
| 21st | 1943–1945 | Harold Robinson Scott | Progressive Conservative | |
| 22nd | 1945–1948 | |||
| 23rd | 1948–1951 | |||
| 24th | 1951–1955 | |||
| 25th | 1955–1959 | |||
| 26th | 1959–1963 | Keith Brown | Progressive Conservative | |
| 27th | 1963–1967 | |||
| 28th | 1967–1971 | Walter Pitman | New Democratic | |
| 29th | 1971–1975 | John Melville Turner | Progressive Conservative | |
| 30th | 1975–1977 | Gillian Sandeman | New Democratic | |
| 31st | 1977–1981 | John Melville Turner | Progressive Conservative | |
| 32nd | 1981–1985 | |||
| 33rd | 1985–1987 | |||
| 34th | 1987–1990 | Peter Adams | Liberal | |
| 35th | 1990–1995 | Jenny Carter | New Democratic | |
| 36th | 1995–1999 | Gary Stewart | Progressive Conservative | |
| 37th | 1999–2003 | |||
| 38th | 2003–2007 | Jeff Leal | Liberal | |
| 39th | 2007–2011 | |||
| 40th | 2011–2014 | |||
| 41st | 2014–2018 | |||
| Peterborough—Kawartha | ||||
| 42nd | 2018–Present | Dave Smith | Progressive Conservative | |
Partial election results
| 2018 Ontario general election | ||||||||
|---|---|---|---|---|---|---|---|---|
| Party | Candidate | Votes | % | ±% | ||||
| Progressive Conservative | Dave Smith | 22,904 | 37.68 | +7.82 | ||||
| New Democratic | Sean Conway | 20,518 | 33.75 | +15.50 | ||||
| Liberal | Jeff Leal | 14,946 | 24.59 | −21.67 | ||||
| Green | Gianne Broughton | 2,024 | 3.33 | −0.96 | ||||
| Libertarian | Jacob William Currier | 245 | 0.40 | |||||
| Stop Climate Change | Ken Ranney | 153 | 0.25 | |||||
| Total valid votes | 60,790 | 100.0 | ||||||
| Progressive Conservative gain | Swing | |||||||
| Source: Elections Ontario[1] | ||||||||
| 2014 Ontario general election: Peterborough | ||||||||
|---|---|---|---|---|---|---|---|---|
| Party | Candidate | Votes | % | ±% | ||||
| Liberal | Jeff Leal | 24,649 | 46.26 | +6.33 | ||||
| Progressive Conservative | Scott Stewart | 15,909 | 29.86 | −1.63 | ||||
| New Democratic | Sheila Wood | 9,726 | 18.25 | −7.36 | ||||
| Green | Gary Beamish | 2,285 | 4.29 | +1.75 | ||||
| Independent | Brian Martindale | 395 | 0.74 | |||||
| Socialist | Andrea Quiano | 131 | 0.25 | +0.08 | ||||
| Freedom | Wayne Matheson | 121 | 0.23 | −0.03 | ||||
| Pauper | Gerard Faux | 63 | 0.19 | |||||
| Total valid votes | 53,279 | 100.00 | ||||||
| Liberal hold | Swing | +3.98 | ||||||
| Source: Elections Ontario[2] | ||||||||
| 2011 Ontario general election | ||||||||
|---|---|---|---|---|---|---|---|---|
| Party | Candidate | Votes | % | ±% | ||||
| Liberal | Jeff Leal | 19,430 | 39.93 | −7.85 | ||||
| Progressive Conservative | Alan Wilson | 15,323 | 31.49 | +5.88 | ||||
| New Democratic | Dave Nickle | 12,460 | 25.61 | +9.00 | ||||
| Green | Gary Beamish | 1,235 | 2.54 | −6.16 | ||||
| Freedom | Alex Long | 127 | 0.26 | |||||
| Socialist | Ken Ranney | 83 | 0.17 | |||||
| Total valid votes | 48,658 | 100.00 | ||||||
| Total rejected, unmarked and declined ballots | 219 | 0.45 | ||||||
| Turnout | 48,877 | 53.18 | ||||||
| Eligible voters | 91,908 | |||||||
| Liberal hold | Swing | −6.87 | ||||||
| Source: Elections Ontario[3] | ||||||||
| 2007 Ontario general election | ||||||||
|---|---|---|---|---|---|---|---|---|
| Party | Candidate | Votes | % | ±% | ||||
| Liberal | Jeff Leal | 24,425 | 47.78 | +3.04 | ||||
| Progressive Conservative | Bruce Fitzpatrick | 13,093 | 25.61 | −7.85 | ||||
| New Democratic | Dave Nickle | 8,488 | 16.61 | −1.19 | ||||
| Green | Miriam Stucky | 4,444 | 8.69 | +5.77 | ||||
| Family Coalition | Paul Morgan | 665 | 1.30 | +0.55 | ||||
| Total valid votes | 51,115 | 100.0 | ||||||
| 2003 Ontario general election | ||||||||
|---|---|---|---|---|---|---|---|---|
| Party | Candidate | Votes | % | ±% | ||||
| Liberal | Jeff Leal | 24,626 | 44.74 | +4.54 | ||||
| Progressive Conservative | Gary Stewart | 18,418 | 33.46 | −11.53 | ||||
| New Democratic | Dave Nickle | 9,796 | 17.80 | +4.8 | ||||
| Green | Tim Holland | 1,605 | 2.92 | +1.82 | ||||
| Family Coalition | Max Murray | 414 | 0.75 | |||||
| Independent | Bob Bowers | 178 | 0.32 | +0.04 | ||||
| Total valid votes | 55,037 | 100.0 | ||||||
| 1999 Ontario general election | ||||||||
|---|---|---|---|---|---|---|---|---|
| Party | Candidate | Votes | % | |||||
| Progressive Conservative | Gary Stewart | 24,422 | 44.99 | |||||
| Liberal | Jeff Leal | 21,820 | 40.20 | |||||
| New Democratic | Dave Nickle | 7,058 | 13.00 | |||||
| Green | Larry J. Tyldsley | 598 | 1.10 | |||||
| Independent | Bob Bowers | 151 | 0.28 | |||||
| Independent | Kenneth Thomas Burgess | 125 | 0.23 | |||||
| Natural Law | Robert Mayer | 106 | 0.20 | |||||
| Total valid votes | 54,280 | 100.0 | ||||||
| 1963 Ontario general election: Peterborough | ||||||||
|---|---|---|---|---|---|---|---|---|
| Party | Candidate | Votes | % | ±% | ||||
| Progressive Conservative | Keith Brown | 16,972 | 58.05 | |||||
| Liberal | Jack McCarney | 7,777 | 26.60 | |||||
| New Democratic | Mildred Sutton | 4,490 | 15.36 | |||||
| Total valid votes | 29,239 | 100.00 | ||||||
| 1959 Ontario general election: Peterborough | ||||||||
|---|---|---|---|---|---|---|---|---|
| Party | Candidate | Votes | % | |||||
| Progressive Conservative | Keith Brown | 13,984 | 58.17 | |||||
| Liberal | Joseph Slattery | 7,975 | 33.18 | |||||
| Co-operative Commonwealth | Edmund Humphrey | 1,834 | 7.63 | |||||
| Social Credit | Martin Graves | 246 | 1.02 | |||||
| Total valid votes | 24,039 | |||||||
2007 electoral reform referendum
| 2007 Ontario electoral reform referendum | |||
|---|---|---|---|
| Side | Votes | % | |
| First Past the Post | 32,372 | 64.5 | |
| Mixed member proportional | 17,834 | 35.5 | |
| Total valid votes | 50,206 | 100.0 | |
Sources
- "Summary of Valid Votes Cast for each Candidate" (PDF). Elections Ontario. p. 9. Retrieved 20 January 2019.
- Elections Ontario. "General Election Results by District, 071 Peterborough". Retrieved 13 June 2014.
- Elections Ontario (2011). "Official return from the records / Rapport des registres officiels – Peterborough" (PDF). Retrieved 2 June 2014.