Orléans (provincial electoral district)
Orléans is a provincial electoral district in eastern Ontario, Canada. It elects one member to the Legislative Assembly of Ontario. Before the 2018 election, it was known as Ottawa—Orléans.
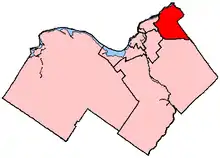 Orléans in relation to other Ottawa electoral districts | |||
| Provincial electoral district | |||
| Legislature | Legislative Assembly of Ontario | ||
| MPP |
Liberal | ||
| District created | 1999 | ||
| First contested | 1999 | ||
| Last contested | 2018 | ||
| Demographics | |||
| Population (2011) | 119,287 | ||
| Electors (2018) | 102,821 | ||
| Area (km²) | 138 | ||
| Pop. density (per km²) | 864.4 | ||
| Census division(s) | Ottawa (2001–present) Ottawa-Carleton Regional Municipality (1999–2001) | ||
| Census subdivision(s) | Ottawa (2001–present) Cumberland (1999–2001) Gloucester (1999–2001) | ||
History
It was created in 1999 from Prescott and Russell, Carleton East and Ottawa—Rideau. The electoral district was initially named Carleton—Gloucester, and the June 1999 provincial election was conducted by Elections Ontario under that name, but it was known as Ottawa—Orleans by the time of the October 2003 provincial election.[1]
When it was created, the riding consisted of that part of the former city of Gloucester south of a line following Limebank Road to Leitrim Road to the Canadian Pacific Railway to Lester Road to Conroy Road, and east of a line following Green's Creek to the Queensway to Montreal Road to Blair Road to Innes Road to a transmission line and that part of the city of Cumberland north of Innes Road and west of Trim Road.
For the 2007 election, the riding was redefined to consist of that part of Ottawa within a line running along Green's Creek to the Queensway to Montreal Road to Blair Road to Innes Road to a transmission line to Highway 417 to Boundary Road to Wall Road to Trim Road to Regional Road 174 to Cardinal Creek.
For the 2018 election, the riding was renamed Orléans, and lost the neighbourhood of Beacon Hill South from Ottawa—Vanier, and will gain the Cardinal Creek area from Glengarry—Prescott—Russell and the rural area surrounding Carlsbad Spring from parts of Glengarry—Prescott—Russell and Nepean—Carleton.
Members of Provincial Parliament
| Assembly | Years | Member | Party | |
|---|---|---|---|---|
| Carleton—Gloucester Riding created from Prescott and Russell, Carleton East and Ottawa—Rideau |
||||
| 37th | 1999–2003 | Brian Coburn | Progressive Conservative | |
| Ottawa—Orléans | ||||
| 38th | 2003–2007 | Phil McNeely | Liberal | |
| 39th | 2007–2011 | |||
| 40th | 2011–2014 | |||
| 41st | 2014–2018 | Marie-France Lalonde | ||
| Orléans | ||||
| 42nd | 2018–2019 | Marie-France Lalonde | Liberal | |
| 2020–Present | Stephen Blais | |||
Election results
| Ontario provincial by-election, February 27, 2020 Resignation of Marie-France Lalonde | ||||||||
|---|---|---|---|---|---|---|---|---|
| Party | Candidate | Votes | % | ±% | ||||
| Liberal | Stephen Blais | 14,303 | 55.01 | +15.96 | ||||
| Progressive Conservative | Natalie Montgomery | 5,945 | 22.87 | −12.33 | ||||
| New Democratic | Manon Parrot | 3,888 | 14.95 | −6.99 | ||||
| Green | Andrew West | 1,527 | 5.87 | +3.37 | ||||
| Libertarian | Jean-Serge Brisson | 177 | 0.68 | +0.06 | ||||
| None of the Above | Keegan Bennett | 100 | 0.38 | |||||
| Pauper | John Turmel | 32 | 0.12 | |||||
| Ontario Alliance | Gerrie Huenemoerder | 28 | 0.11 | |||||
| Total valid votes | 26,000 | |||||||
| Total rejected ballots | ||||||||
| Turnout | 23.53 | −39.24 | ||||||
| Eligible voters | 110,519 | |||||||
| Liberal hold | Swing | +14.15 | ||||||
| 2018 Ontario general election | ||||||||
|---|---|---|---|---|---|---|---|---|
| Party | Candidate | Votes | % | ±% | ||||
| Liberal | Marie-France Lalonde | 24,972 | 39.05 | −14.45 | ||||
| Progressive Conservative | Cameron Montgomery | 22,509 | 35.20 | +2.06 | ||||
| New Democratic | Barbara Zarboni | 14,033 | 21.94 | +12.96 | ||||
| Green | Nicholas Lapierre | 1,603 | 2.51 | −1.14 | ||||
| Independent | Samuel Schwisberg | 435 | 0.68 | |||||
| Libertarian | Gerald Boudreau | 398 | 0.62 | −0.11 | ||||
| Total valid votes | 63,950 | 99.09 | ||||||
| Total rejected, unmarked and declined ballots | 589 | 0.91 | −0.18 | |||||
| Turnout | 64,539 | 62.77 | +5.83 | |||||
| Eligible voters | 102,821 | |||||||
| Liberal hold | Swing | −8.26 | ||||||
| Source: Elections Ontario[2] | ||||||||
| 2014 Ontario general election: Ottawa—Orléans | ||||||||
|---|---|---|---|---|---|---|---|---|
| Party | Candidate | Votes | % | ±% | ||||
| Liberal | Marie-France Lalonde | 29,911 | 53.50 | +7.06 | ||||
| Progressive Conservative | Andrew Lister | 18,525 | 33.14 | −7.24 | ||||
| New Democratic | Prosper M'Bemba-Meka | 5,022 | 8.98 | −1.60 | ||||
| Green | Bob Bell | 2,036 | 3.64 | +1.76 | ||||
| Libertarian | Gerry Bourdeau | 411 | 0.74 | +0.41 | ||||
| Total valid votes | 55,905 | 98.91 | ||||||
| Total rejected, unmarked and declined ballots | 615 | 1.09 | +0.71 | |||||
| Turnout | 56,520 | 56.94 | +4.29 | |||||
| Eligible voters | 99,258 | |||||||
| Liberal hold | Swing | +7.15 | ||||||
Source(s) | ||||||||
| 2011 Ontario general election: Ottawa—Orleans | ||||||||
|---|---|---|---|---|---|---|---|---|
| Party | Candidate | Votes | % | ±% | Expenditures | |||
| Liberal | Phil McNeely | 21,857 | 46.44 | −6.42 | $ 86,835.18 | |||
| Progressive Conservative | Andrew Lister | 19,003 | 40.38 | +5.97 | 57,251.00 | |||
| New Democratic | Doug McKercher | 4,979 | 10.58 | +4.22 | 1,389.28 | |||
| Green | Tanya Gutmanis | 886 | 1.88 | −2.68 | 0.00 | |||
| Freedom | David McGruer | 183 | 0.39 | +0.01 | 0.00 | |||
| Libertarian | David Paul | 154 | 0.33 | 82.01 | ||||
| Total valid votes / Expense Limit | 47,062 | 99.62 | $ 106,791.79 | |||||
| Total rejected, unmarked and declined ballots | 179 | 0.38 | −0.05 | |||||
| Turnout | 47,241 | 52.65 | −5.21 | |||||
| Eligible voters | 89,726 | +6.53 | ||||||
| Liberal hold | Swing | −6.19 | ||||||
Source(s)
"Summary of Valid Votes Cast for Each Candidate – October 6, 2011 General Election" (PDF). Elections Ontario. Retrieved May 28, 2014. "Statistical Summary – General Elections 2011" ( "2011 Candidate Campaign Returns (CR-1)". Retrieved May 28, 2014. | ||||||||
| 2007 Ontario general election: Ottawa—Orleans | ||||||||
|---|---|---|---|---|---|---|---|---|
| Party | Candidate | Votes | % | ±% | Expenditures | |||
| Liberal | Phil McNeely | 25,649 | 52.86 | +2.51 | $ 67,961.00 | |||
| Progressive Conservative | Graham Fox | 16,695 | 34.41 | −6.92 | 81,527.51 | |||
| New Democratic | Andrée Germain | 3,088 | 6.36 | +0.84 | 1,922.66 | |||
| Green | Akbar Manoussi | 2,214 | 4.56 | +1.77 | 4,719.58 | |||
| Family Coalition | Jeremy Atkinson | 692 | 1.43 | 3,538.98 | ||||
| Freedom | David McGruer | 183 | 0.38 | 0.00 | ||||
| Total valid votes/Expense Limit | 48,521 | 99.57 | $ 90,965.16 | |||||
| Total rejected ballots | 209 | 0.43 | +0.04 | |||||
| Turnout | 48,730 | 57.86 | −5.53 | |||||
| Eligible voters | 84,227 | +5.85 | ||||||
| Liberal hold | Swing | +4.71 | ||||||
Source(s)
"Summary of Valid Votes Cast for Each Candidate – October 10, 2007 General Election" (PDF). Elections Ontario. Retrieved May 28, 2014. "Statistical Summary – General Elections 2007" (PDF). Elections Ontario. Retrieved May 28, 2014. "2007 Candidate Campaign Returns (CR-1)". Retrieved May 28, 2014. | ||||||||
| 2003 Ontario general election: Ottawa—Orleans | ||||||||
|---|---|---|---|---|---|---|---|---|
| Party | Candidate | Votes | % | ±% | Expenditures | |||
| Liberal | Phil McNeely | 25,300 | 50.36 | +9.92 | $ 66,785.00 | |||
| Progressive Conservative | Brian Coburn | 20,762 | 41.32 | −13.24 | 73,997.09 | |||
| New Democratic | Ric Dagenais | 2,778 | 5.53 | +2.85 | 11,889.14 | |||
| Green | Melanie Ransom | 1,402 | 2.79 | +1.42 | 1,069.07 | |||
| Total valid votes/Expense Limit | 50,242 | 99.61 | $ 76,391.04 | |||||
| Total rejected ballots | 197 | 0.39 | −0.21 | |||||
| Turnout | 50,439 | 63.39 | +2.52 | |||||
| Eligible voters | 79,574 | +11.69 | ||||||
| Liberal gain from Progressive Conservative | Swing | +11.58 | ||||||
Source(s)
"General Election of October 2, 2003 – Summary of Valid Ballots by Candidate". Elections Ontario. Retrieved May 28, 2014. "General Election of October 2, 2003 – Statistical Summary". Elections Ontario. Retrieved May 28, 2014. "2003 Candidate and Constituency Associations – Candidate Campaign Return (CR-1)". Retrieved May 28, 2014. | ||||||||
| 1999 Ontario general election: Ottawa—Orleans 1 ⃝ | ||||||||
|---|---|---|---|---|---|---|---|---|
| Party | Candidate | Votes | % | Expenditures | ||||
| Progressive Conservative | Brian Coburn | 24,356 | 54.56 | $ 32,653.11 | ||||
| Liberal | René Danis | 18,052 | 40.44 | 29,722.53 | ||||
| New Democratic | Jamie Gallant | 1,195 | 2.68 | Unavailable | ||||
| Green | André Clermont | 614 | 1.38 | 212.00 | ||||
| Independent | Luc Brisebois | 247 | 0.55 | 0.00 | ||||
| Natural Law | Richard Wolfson | 177 | 0.40 | 0.00 | ||||
| Total valid votes/Expense Limit | 44,641 | 99.40 | $ 70,837.44 | |||||
| Total rejected ballots | 270 | 0.60 | ||||||
| Turnout | 44,911 | 60.86 | ||||||
| Eligible voters | 73,789 | |||||||
| 1 ⃝ Note: During the June 1999 election, this electoral district was also known as “Carleton—Gloucester”. | ||||||||
Source(s)
"General Election of June 3 1999 — Summary of Valid Ballots by Candidate". Elections Ontario. Retrieved May 28, 2014. "General Election of June 3 1999 — Statistical Summary". Elections Ontario. Retrieved May 28, 2014. "1999 Election and Annual Returns - Candidate and Constituency Association Returns". Retrieved May 28, 2014. | ||||||||
2007 electoral reform referendum
| 2007 Ontario electoral reform referendum | |||
|---|---|---|---|
| Side | Votes | % | |
| First Past the Post | 33,602 | 70.1 | |
| Mixed member proportional | 14,351 | 29.9 | |
| Total valid votes | 47,953 | 100.0 | |
References
- "General Election of June 3, 1999". Elections Ontario. Archived from the original on May 29, 2014. Retrieved May 28, 2014.
- "Summary of Valid Votes Cast for each Candidate" (PDF). Elections Ontario. p. 6. Retrieved January 20, 2019.