Scarborough—Agincourt (provincial electoral district)
Scarborough—Agincourt is a provincial electoral district in Ontario, Canada that has been represented in the Legislative Assembly of Ontario since 1987.
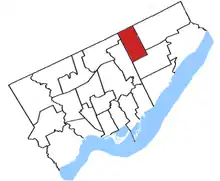
.png.webp) Scarborough—Agincourt in relation to the other Toronto ridings | |||
| Provincial electoral district | |||
| Legislature | Legislative Assembly of Ontario | ||
| MPP |
Progressive Conservative | ||
| District created | 1987 | ||
| First contested | 1987 | ||
| Last contested | 2018 | ||
| Demographics | |||
| Population (2011) | 112,048 | ||
| Electors (2007) | 73,876 | ||
| Area (km²) | 23.92 | ||
| Pop. density (per km²) | 4,684.3 | ||
| Census division(s) | Toronto | ||
| Census subdivision(s) | Toronto | ||
.gif)
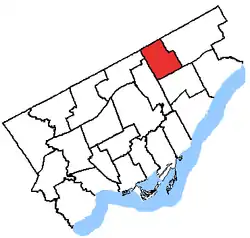
The riding covers the northwest of the Scarborough part of Toronto. It is bounded on the west by Victoria Park Avenue, on the north by the Toronto city limits (Steeles Avenue East), on the east by Midland Avenue, and on the south by Highway 401. It contains the neighbourhoods of Steeles, L'Amoreaux, Tam O'Shanter-Sullivan, Agincourt (west of Midland Avenue) and Milliken (west of Midland Avenue).
Demographics
Population
Total (2006): 111,867
Growth (2001–2006): +1,197 (+1.1%)
Electors:
- Federal (2006): 72,895 (65.2%)
- Provincial (2007): 73,876 (66%)
Gender* (2001):
- Male: 52,525 (47.5%)
- Female: 58,145 (52.5%)
Identifiable Groups** (2001):
- Visible Minority: 76,195 (69.3%)
- Chinese: 41,135 (37.4%)
- South Asian: 14,680 (13.3%)
- Black: 7,450 (6.8%)
- Filipino: 3,470 (3.2%)
- West Asian: 1,830 (1.7%)
- Arab: 1,775 (1.6%)
- Other Visible Minority: 1,560 (1.4%)
- Multiple Visible Minorities: 1,385 (1.3%)
- Latin American: 825 (0.8%)
- Southeast Asian: 800 (0.7%)
- Korean: 670 (0.6%)
- Japanese: 625 (0.6%)
- Aboriginal: 185 (0.2%)
- Immigrant: 70,315 (63.9%)
- Non-Permanent Residents: 1,780 (1.6%)
Language
Mother Tongue** (2001):
- English: 39,880 (36.3%)
- French: 775 (0.7%)
- Non-Official Languages: 66,755 (60.7%)
- Multiple Responses: 2,590 (2.4%)
Knowledge of Official Languages** (2001):
- English only: 92,290 (83.9%)
- Neither English nor French: 10,855 (9.9%)
- English and French: 6,755 (6.1%)
- French only: 105 (0.001%)
Home Language** (2001):
- English: 42,110 (38.3%)
- Non-official languages: 34,760 (31.6%)
- English and non-official language: 31,875 (29%)
- English and French: 625 (0.6%)
- English, French and non-official language: 430 (0.4%)
- French: 110 (0.1%)
- French and non-official language: 85 (0.1%)
Education
Education*** (2001):
- Less than High School: 29,385 (32.6%)
- High School: 22,950 (25%)
- Trade School: 5,205 (5.7%)
- College: 11,775 (12.8%)
- University: 22,530 (24.5%)
Income and work
Labour Force*** (2001):
- Participation: 55,510 (60.4%)
- Employed: 50,840 (55.4%)
- Unemployed: 4,670 (8.4%)
Average Income*** (2001):
- Individual: $26,473
- Household: $62,836
- Family: $60,742
Median Income (2007):
- Household: $51,762
Families and dwellings
Persons per Family (2001): 3.1
Occupied Private Dwellings (2001):
- Total: 35,615
- Owned: 23,670 (66.5%)
- Rented: 11,945 (33.5%)
- Average Value: $226,053
Religion
Religion** (2001):
- Christian: 58,125 (52.8%)
- Catholic: 24,660 (22.4%)
- Protestant: 19,670 (17.9%)
- Christian Orthodox: 7,365 (6.7%)
- Christian n.i.e.****: 6,430 (5.8%)
- No Religious Affiliation: 31,220 (28.4%)
- Hindu: 7,300 (6.6%)
- Muslim: 6,740 (6.1%)
- Buddhist: 5,515 (5%)
- Eastern Religions: 380 (0.3%)
- Sikh: 360 (0.3%)
- Jewish: 330 (0.3%)
- Other Religions: 30 (0.03%)
* Based on a total population of 110,670
** Based on a projected population of 109,995 (20% sample data projected from the total population)
*** Based on a projected population of 91,840 (20% sample data projected from the population 15 years and over)
**** Includes mostly answers of 'Christian,' not otherwise stated.
|- |Sources: Statistics Canada (2001, 2006); Elections Canada (2006); Elections Ontario (2007)
History
The provincial electoral district was created in 1999 when provincial ridings were defined to have the same borders as federal ridings.
Members of Provincial Parliament
| Scarborough—Agincourt | ||||
|---|---|---|---|---|
| Assembly | Years | Member | Party | |
| Riding created from Scarborough North | ||||
| 34th | 1987–1990 | Gerry Phillips | Liberal | |
| 35th | 1990–1995 | |||
| 36th | 1995–1999 | |||
| 37th | 1999–2003 | |||
| 38th | 2003–2007 | |||
| 39th | 2007–2011 | |||
| 40th | 2011–2014 | Soo Wong | Liberal | |
| 41st | 2014–2018 | |||
| 42nd | 2018–Present | Aris Babikian | Progressive Conservative | |
| Sourced from the Ontario Legislative Assembly.[1] | ||||
Election results
| 2018 Ontario general election | ||||||||
|---|---|---|---|---|---|---|---|---|
| Party | Candidate | Votes | % | ±% | ||||
| Progressive Conservative | Aris Babikian | 18,582 | 50.40 | +15.77 | ||||
| Liberal | Soo Wong | 10,429 | 28.29 | -21.55 | ||||
| New Democratic | Tasleem Riaz | 6,434 | 17.45 | +5.64 | ||||
| Green | Lydia West | 635 | 1.72 | -0.89 | ||||
| Libertarian | Mark Sinclair | 244 | 0.66 | |||||
| Independent | Jude Coutinho | 189 | 0.51 | |||||
| Ontario Moderate Party | Rubina Ansary | 148 | 0.40 | |||||
| Trillium | Carlos Lacuna | 118 | 0.32 | |||||
| The People | Badih Rawdah | 92 | 0.25 | -0.86 | ||||
| Total valid votes | 36,871 | 100.0 | ||||||
| Progressive Conservative gain from Liberal | Swing | - | ||||||
| Source: Elections Ontario[2] | ||||||||
| 2014 Ontario general election | ||||||||
|---|---|---|---|---|---|---|---|---|
| Party | Candidate | Votes | % | ±% | ||||
| Liberal | Soo Wong | 17,332 | 49.84 | +2.82 | ||||
| Progressive Conservative | Liang Chen | 12,041 | 34.63 | +2.64 | ||||
| New Democratic | Alex Wilson | 4,105 | 11.81 | -3.94 | ||||
| Green | Pauline Thompson | 907 | 2.61 | +0.34 | ||||
| The People | Kevin Clarke | 387 | 1.11 | |||||
| Total valid votes | 34,772 | 100.0 | ||||||
| Liberal hold | Swing | +0.09 | ||||||
| Source: Elections Ontario[3] | ||||||||
| 2011 Ontario general election | ||||||||
|---|---|---|---|---|---|---|---|---|
| Party | Candidate | Votes | % | ±% | ||||
| Liberal | Soo Wong | 14,907 | 46.85 | -11.22 | ||||
| Progressive Conservative | Liang Chen | 10,222 | 32.13 | +6.77 | ||||
| New Democratic | Paul Choi | 5,017 | 15.77 | +5.27 | ||||
| Green | Pauline Thompson | 722 | 2.27 | -2.22 | ||||
| Libertarian | Doug McLarty | 656 | 2.06 | |||||
| Paramount Canadians | Priya Ahuja | 209 | 0.66 | |||||
| Freedom | Sabrina Wall | 83 | 0.26 | |||||
| Total valid votes | 31,816 | 100.00 | ||||||
| Total rejected, unmarked and declined ballots | 246 | 0.77 | ||||||
| Turnout | 32,062 | 43.57 | ||||||
| Eligible voters | 73,583 | |||||||
| Liberal hold | Swing | -9.00 | ||||||
| Source: Elections Ontario[4] | ||||||||
| 2007 Ontario general election | ||||||||
|---|---|---|---|---|---|---|---|---|
| Party | Candidate | Votes | % | ±% | ||||
| Liberal | Gerry Phillips | 19,541 | 58.08 | -3.26 | ||||
| Progressive Conservative | John Del Grande | 8,531 | 25.36 | -5.39 | ||||
| New Democratic | Yvette Blackburn | 3,531 | 10.49 | +5.02 | ||||
| Green | George Pappas | 1,511 | 4.49 | * | ||||
| Family Coalition | Max Wang | 532 | 1.58 | * | ||||
| Total valid votes | 33,646 | 100.00 | ||||||
| Liberal hold | Swing | +1.07 | ||||||
^ Change based on redistributed results
| 2003 Ontario general election | ||||||||
|---|---|---|---|---|---|---|---|---|
| Party | Candidate | Votes | % | ±% | ||||
| Liberal | Gerry Phillips | 23,026 | 61.10 | +10.40 | ||||
| Progressive Conservative | Yolanda Chan | 11,337 | 30.08 | -13.07 | ||||
| New Democratic | Stacy Douglas | 2,209 | 5.86 | +2.28 | ||||
| Green | Lawrence J. Arkilander | 566 | 1.50 | +0.28 | ||||
| Family Coalition | Tony Ieraci | 550 | 1.46 | |||||
| Total valid votes | 37,688 | 100.00 | ||||||
| 1999 Ontario general election | ||||||||
|---|---|---|---|---|---|---|---|---|
| Party | Candidate | Votes | % | ±% | ||||
| Liberal | Gerry Phillips | 18,698 | 50.70 | +7.99 | ||||
| Progressive Conservative | Jim Brown | 15,915 | 43.15 | +4.51 | ||||
| New Democratic | Bob Frankford | 1,319 | 3.58 | -10.51 | ||||
| Green | Gary Carmichael | 451 | 1.22 | |||||
| Independent | Wayne Cook | 371 | 1.01 | |||||
| Natural Law | Ken Morgan | 129 | 0.35 | -0.72 | ||||
| Total valid votes | 36,883 | 100.00 | ||||||
2007 electoral reform referendum
| 2007 Ontario electoral reform referendum | |||
|---|---|---|---|
| Side | Votes | % | |
| First Past the Post | 19,185 | 59.8 | |
| Mixed member proportional | 12,881 | 40.2 | |
| Total valid votes | 32,066 | 100.0 | |
Historic election results
| 1995 Ontario general election | ||||||||
|---|---|---|---|---|---|---|---|---|
| Party | Candidate | Votes | % | ±% | ||||
| Liberal | Gerry Phillips | 13,472 | 46.08 | -1.63 | ||||
| Progressive Conservative | Keith Macnab | 11,337 | 38.78 | +9.81 | ||||
| New Democratic | Christine Fel | 4,112 | 14.07 | -8.3 | ||||
| Natural Law | Daphne Quance | 313 | 1.07 | |||||
| Total valid votes | 29,234 | 100.0 | ||||||
| Source:The Globe and Mail[5] | ||||||||
| 1990 Ontario general election | ||||||||
|---|---|---|---|---|---|---|---|---|
| Party | Candidate | Votes | % | ±% | ||||
| Liberal | Gerry Phillips | 13,347 | 44.32 | -13.11 | ||||
| Progressive Conservative | Keith Macnab | 8,640 | 28.69 | +9.84 | ||||
| New Democratic | Ayoub Ali | 6,763 | 22.46 | +1.24 | ||||
| Libertarian | Bill Galster | 1,368 | 4.54 | +2.04 | ||||
| Total valid votes | 30,118 | 100.0 | ||||||
| Source:The Toronto Daily Star[6] | ||||||||
| 1987 Ontario general election | ||||||||
|---|---|---|---|---|---|---|---|---|
| Party | Candidate | Votes | % | |||||
| Liberal | Gerry Phillips | 19,101 | 57.53 | |||||
| New Democratic | David Kho | 7,021 | 21.15 | |||||
| Progressive Conservative | Adrienne Johnson | 6,284 | 18.93 | |||||
| Libertarian | Barry Coyne | 794 | 2.39 | |||||
| Total valid votes | 33,200 | 100.0 | ||||||
| Source:The Toronto Daily Star[7] | ||||||||
References
- For a listing of each MPP's Queen's Park curriculum vitae see below:
- For Gerry Phillips's Legislative Assembly information see "Gerry Phillips, MPP". Parliamentary History. Toronto: Legislative Assembly of Ontario. 2012. Retrieved 2012-04-28.
- For Soo Wong's Legislative Assembly information see "Soo Wong, MPP". Parliamentary History. Toronto: Legislative Assembly of Ontario. 2012. Retrieved 2012-04-28.
- "Summary of Valid Votes Cast for each Candidate" (PDF). Elections Ontario. p. 10. Retrieved 20 January 2019.
- "Valid Votes Cast for Each Candidate - 2014 General Election.pdf" (PDF). Elections Ontario. 2014. Retrieved 11 December 2017.
- "Official return from the records / Rapport des registres officiels - Scarborough—Agincourt" (PDF). Elections Ontario. 2011. Retrieved 6 June 2014.
- "Metro Toronto and suburban voter results". The Globe and Mail. Toronto. 1995-06-09. p. A11.
- "How Metro-Area Voted". The Toronto Daily Star. Toronto. 1990-09-07. p. A10.
- "How Metro-Area Voted". The Toronto Daily Star. Toronto. 1987-09-11. p. A12.