Niagara Centre (provincial electoral district)
Niagara Centre (formerly Welland) is a provincial electoral district in Ontario, Canada, represented from 1867 until 1977 and again since 2007 (under different boundaries) in the Legislative Assembly of Ontario . Its population in 2006 was 112,875.
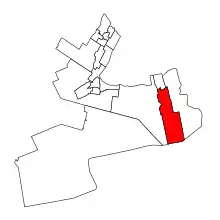 Niagara Centre in relation to southern Ontario ridings | |||
| Provincial electoral district | |||
| Legislature | Legislative Assembly of Ontario | ||
| MPP |
New Democratic | ||
| District created | 2006 | ||
| First contested | 2007 | ||
| Last contested | 2018 | ||
| Demographics | |||
| Population (2006) | 112,875 | ||
| Electors (2011) | 86,257 | ||
| Area (km²) | 583 | ||
| Pop. density (per km²) | 193.6 | ||
| Census division(s) | Niagara | ||
| Census subdivision(s) | Welland, Thorold, Port Colborne, St. Catharines | ||
A new riding of Niagara Centre was created before the 1999 election from small parts of the Lincoln and St. Catharines—Brock ridings, and almost all of the Welland—Thorold riding. The current electoral district was created in 2003: 74.9% of the riding came from Niagara Centre riding, 22.5% from Erie—Lincoln and 2.7% from Niagara Falls riding. The name was changed to Welland during redistricting in 2006. In 2018, the name was changed back to Niagara Centre.
Geography
The pre-2018 Welland riding consisted of the cities of Welland, Thorold, Port Colborne, and the part of the City of St. Catharines lying south of a line drawn from the western city limit east along St. Paul Street West, northeast along St. Paul Crescent, east and south along Twelve Mile Creek, and east along Glendale Avenue to the eastern city limit.
Members of Provincial Parliament
| Assembly | Years | Member | Party | |
|---|---|---|---|---|
| Welland | ||||
| 1st | 1867–1871 | William Beatty | Liberal | |
| 2nd | 1871–1874 | James Currie | ||
| 3rd | 1875–1879 | |||
| 4th | 1879–1883 | Daniel Near | ||
| 5th | 1883–1886 | James E. Morin | ||
| 6th | 1886–1890 | |||
| 7th | 1890–1894 | William McCleary | Conservative | |
| 8th | 1894–1898 | William Manley German | Liberal | |
| 9th | 1898–1900 | |||
| 1900–1902 | John Franklin Gross | |||
| 10th | 1902–1904 | |||
| 11th | 1905–1908 | Evan Eugene Fraser | Conservative | |
| 12th | 1908–1911 | |||
| 13th | 1911–1914 | |||
| 14th | 1914–1919 | Donald Sharpe | ||
| 15th | 1919–1923 | Robert Cooper | Liberal | |
| 16th | 1923–1926 | Marshall Vaughan | Conservative | |
| 17th | 1926–1929 | |||
| 18th | 1929–1934 | |||
| 19th | 1934–1937 | Edward James Anderson | Liberal | |
| 20th | 1937–1943 | |||
| 21st | 1943–1945 | Howard Elis Brown | Co-operative Commonwealth | |
| 22nd | 1945–1948 | Thomas Henry Lewis | Progressive Conservative | |
| 23rd | 1948–1951 | Harold William Walker | Liberal | |
| 24th | 1951–1955 | Ellis Morningstar | Progressive Conservative | |
| 25th | 1955–1959 | |||
| 26th | 1959–1963 | |||
| 27th | 1963–1967 | |||
| 28th | 1967–1971 | |||
| 29th | 1971–1975 | |||
| 30th | 1975–1977 | Mel Swart | New Democratic | |
| Welland—Thorold | ||||
| 31st | 1977–1981 | Mel Swart | New Democratic | |
| 32nd | 1981–1985 | |||
| 33rd | 1985–1987 | |||
| 34th | 1987–1988 | |||
| 1988–1990 | Peter Kormos | |||
| 35th | 1990–1995 | |||
| 36th | 1995–1999 | |||
| Niagara Centre Created from Welland—Thorold, Lincoln and St. Catharines—Brock |
||||
| 37th | 1999–2003 | Peter Kormos | New Democratic | |
| 38th | 2003–2007 | |||
| Welland | ||||
| 39th | 2007–2011 | Peter Kormos | New Democratic | |
| 40th | 2011–2014 | Cindy Forster | ||
| 41st | 2014–2018 | |||
| Niagara Centre | ||||
| 42nd | 2018–Present | Jeff Burch | New Democratic | |
Election results
Niagara Centre, 2018–
| 2018 Ontario general election | ||||||||
|---|---|---|---|---|---|---|---|---|
| Party | Candidate | Votes | % | ±% | ||||
| New Democratic | Jeff Burch | 21,618 | 44.23 | −2.49 | ||||
| Progressive Conservative | April Jeffs | 18,333 | 37.51 | +9.09 | ||||
| Liberal | Benoit Mercier | 5,779 | 11.82 | −7.93 | ||||
| Green | Joe Dias | 1,803 | 3.69 | −0.42 | ||||
| None of the Above | Joe Crawford | 623 | 1.27 | |||||
| Libertarian | Patrick Pietruszko | 368 | 0.75 | −0.24 | ||||
| Independent | Steve Soos | 217 | 0.44 | |||||
| The People | Dario Smagata-Bryan | 133 | 0.27 | |||||
| Total valid votes | 48,874 | 100.0 | ||||||
| Source: Elections Ontario[1] | ||||||||
Welland, 2007–2018
| 2014 Ontario general election | ||||||||
|---|---|---|---|---|---|---|---|---|
| Party | Candidate | Votes | % | ±% | ||||
| New Democratic | Cindy Forster | 21,326 | 46.79 | +2.06 | ||||
| Progressive Conservative | Frank Campion | 12,933 | 28.37 | -3.71 | ||||
| Liberal | Benoit Mercier | 9,060 | 19.88 | -0.01 | ||||
| Green | Donna Cridland | 1,803 | 3.96 | +1.81 | ||||
| Libertarian | Andrea J. Murik | 460 | 1.01 | -0.16 | ||||
| Total valid votes | 45,582 | 100.0 | ||||||
| New Democratic hold | Swing | +2.88 | ||||||
| Source: Elections Ontario[2] | ||||||||
| 2011 Ontario general election | ||||||||
|---|---|---|---|---|---|---|---|---|
| Party | Candidate | Votes | % | ±% | ||||
| New Democratic | Cindy Forster | 19,527 | 44.66 | -9.28 | ||||
| Progressive Conservative | Domenic Ursini | 14,048 | 32.13 | +13.25 | ||||
| Liberal | Benoit Mercier | 8,638 | 19.76 | -3.15 | ||||
| Green | Donna Cridland | 1,005 | 2.30 | -1.94 | ||||
| Libertarian | Donna-Lynne Hamilton | 505 | 1.15 | |||||
| Total valid votes | 43,723 | 100.00 | ||||||
| Total rejected, unmarked and declined ballots | 248 | 0.56 | ||||||
| Turnout | 43,971 | 51.64 | ||||||
| Eligible voters | 85,141 | |||||||
| New Democratic hold | Swing | -11.27 | ||||||
| Source: Elections Ontario[3] | ||||||||
| 2007 Ontario general election | ||||||||
|---|---|---|---|---|---|---|---|---|
| Party | Candidate | Votes | % | |||||
| New Democratic | Peter Kormos | 24,910 | 53.94 | |||||
| Liberal | John Mastroianni | 10,580 | 22.91 | |||||
| Progressive Conservative | Ron Bodner | 8,722 | 18.88 | |||||
| Green | Mark Grenier | 1,973 | 4.27 | |||||
| Total valid votes | 46,185 | 100.0 | ||||||
| Total rejected, unmarked and declined ballots | 347 | 0.75 | ||||||
| Turnout | 46,532 | 55.29 | ||||||
| Eligible voters | 84,161 | |||||||
Niagara Centre, 1999–2007
| Party | Candidate | Votes | % | ±% | |
|---|---|---|---|---|---|
| New Democratic | Peter Kormos | 23,289 | 49.64 | +5.21 | |
| Liberal | Henry D'angela | 12,526 | 26.7 | +7.31 | |
| Progressive Conservative | Ann D. Gronski | 10,336 | 22.03 | -12.97 | |
| Green | Jordan McArthur | 768 | 1.64 | ||
| 1999 Ontario general election | ||||||||
|---|---|---|---|---|---|---|---|---|
| Party | Candidate | Votes | % | |||||
| New Democratic | Peter Kormos | 21856 | 44.43 | |||||
| Progressive Conservative | Frank Sheehan | 17217 | 35 | |||||
| Liberal | Maurice Charbonneau | 9539 | 19.39 | |||||
| Natural Law | Margaret Larrass | 382 | 0.78 | |||||
| Independent | Lank Makuloluwa | 198 | 0.4 | |||||
2007 electoral reform referendum
| 2007 Ontario electoral reform referendum | |||
|---|---|---|---|
| Side | Votes | % | |
| First Past the Post | 26,925 | 60.1 | |
| Mixed member proportional | 17,859 | 39.9 | |
| Total valid votes | 44,784 | 100.0 | |
References
- "Summary of Valid Votes Cast for each Candidate" (PDF). Elections Ontario. p. 6. Archived from the original (PDF) on 28 December 2018. Retrieved 20 January 2019.
- "General Election Results by District, 098 Welland". Elections Ontario. 2014. Archived from the original on 7 May 2012. Retrieved 17 June 2014.
- Elections Ontario (2011). "Official return from the records / Rapport des registres officiels - Welland" (PDF). Retrieved 4 June 2014.