Oxford (provincial electoral district)
Oxford is a provincial electoral district in Ontario, Canada, that has been represented in the Legislative Assembly of Ontario since the 1999 provincial election.
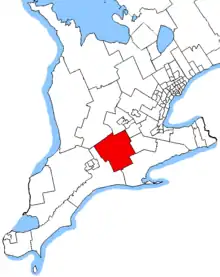 Oxford in relation to the southern Ontario ridings | |||
| Provincial electoral district | |||
| Legislature | Legislative Assembly of Ontario | ||
| MPP |
Progressive Conservative | ||
| District created | 1999 | ||
| First contested | 1999 | ||
| Last contested | 2018 | ||
| Demographics | |||
| Population (2006) | 102,756 | ||
| Electors (2011) | 75,290 | ||
| Area (km²) | 2,164 | ||
| Pop. density (per km²) | 47.5 | ||
| Census division(s) | Oxford County | ||
| Census subdivision(s) | Woodstock, Tillsonburg, Ingersoll, Norwich, Zorra, South-West Oxford, East Zorra – Tavistock, Blandford-Blenheim | ||
It consists of the county of Oxford and a small portion of Brant.
Members of Provincial Parliament
| Oxford | ||||
|---|---|---|---|---|
| Assembly | Years | Member | Party | |
| Created from Oxford North and Oxford South ridings in 1934 | ||||
| 19th | 1934–1937 | Patrick Dewan | Liberal | |
| 20th | 1937–1943 | |||
| 21st | 1943–1945 | Thomas Roy Dent | Progressive Conservative | |
| 22nd | 1945–1948 | |||
| 23rd | 1948–1951 | |||
| 24th | 1951–1955 | |||
| 25th | 1955–1959 | Gord Innes | Liberal | |
| 26th | 1959–1963 | |||
| 27th | 1963–1967 | Gord Pittock | Progressive Conservative | |
| 28th | 1967–1971 | Gord Innes | Liberal | |
| 29th | 1971–1975 | Harry Parrott | Progressive Conservative | |
| 30th | 1975–1977 | |||
| 31st | 1977–1981 | |||
| 32nd | 1981–1985 | Dick Treleaven | Progressive Conservative | |
| 33rd | 1985–1987 | |||
| 34th | 1987–1990 | Charlie Tatham | Liberal | |
| 35th | 1990–1995 | Kimble Sutherland | New Democratic | |
| 36th | 1995–1999 | Ernie Hardeman | Progressive Conservative | |
| 37th | 1999–2003 | |||
| 38th | 2003–2007 | |||
| 39th | 2007–2011 | |||
| 40th | 2011–2014 | |||
| 41st | 2014–2018 | |||
| 42nd | 2018–Present | |||
Election results
| 2018 Ontario general election | ||||||||
|---|---|---|---|---|---|---|---|---|
| Party | Candidate | Votes | % | ±% | ||||
| Progressive Conservative | Ernie Hardeman | 29,152 | 55.73 | +9.49 | ||||
| New Democratic | Tara King | 15,917 | 30.43 | +4.66 | ||||
| Liberal | James Howard | 3,620 | 6.92 | -14.41 | ||||
| Green | Albert De Jong | 2,254 | 4.31 | -0.53 | ||||
| Ontario Party | Robert Van Ryswyck | 447 | 0.85 | |||||
| Libertarian | Chris Swift | 370 | 0.71 | -0.18 | ||||
| Independent | David Sikal | 335 | 0.64 | |||||
| Freedom | Tim Hodges | 216 | 0.41 | -0.53 | ||||
| Total valid votes | 52,311 | 100.0 | ||||||
| Total rejected, unmarked and declined ballots | ||||||||
| Turnout | 60.20 | |||||||
| Eligible voters | 86,877 | |||||||
| Progressive Conservative hold | Swing | +2.42 | ||||||
| Source: Elections Ontario[1] | ||||||||
| 2014 Ontario general election | ||||||||
|---|---|---|---|---|---|---|---|---|
| Party | Candidate | Votes | % | ±% | ||||
| Progressive Conservative | Ernie Hardeman | 18,958 | 46.24 | -8.63 | ||||
| New Democratic | Bryan Smith | 10,573 | 25.79 | +10.14 | ||||
| Liberal | Dan Moulton | 8,736 | 21.31 | -3.66 | ||||
| Green | Mike Farlow | 1,985 | 4.84 | +1.29 | ||||
| Freedom | Tim Hodges | 384 | 0.94 | |||||
| Libertarian | Devin Wright | 365 | 0.89 | |||||
| Total valid votes | 41001 | 100.00 | ||||||
| Progressive Conservative hold | Swing | -9.39 | ||||||
| Source: Elections Ontario[2] | ||||||||
| 2011 Ontario general election | ||||||||
|---|---|---|---|---|---|---|---|---|
| Party | Candidate | Votes | % | ±% | ||||
| Progressive Conservative | Ernie Hardeman | 20,658 | 54.87 | +7.60 | ||||
| Liberal | David Hilderley | 9,410 | 24.99 | -4.34 | ||||
| New Democratic | Dorothy Marie Eisen | 5,885 | 15.63 | +4.28 | ||||
| Green | Catherine Stewart-Mott | 1,336 | 3.55 | -5.26 | ||||
| Family Coalition | Leonard Vanderhoeven | 359 | 0.95 | -0.60 | ||||
| Total valid votes | 37,648 | 100.0 | ||||||
| Total rejected, unmarked and declined ballots | 123 | 0.33 | ||||||
| Turnout | 37,771 | 49.18 | ||||||
| Eligible voters | 76,804 | |||||||
| Progressive Conservative hold | Swing | +5.97 | ||||||
| Source: Elections Ontario[3] | ||||||||
| 2007 Ontario general election | ||||||||
|---|---|---|---|---|---|---|---|---|
| Party | Candidate | Votes | % | ±% | ||||
| Progressive Conservative | Ernie Hardeman | 18,445 | 47.27 | +3.21 | ||||
| Liberal | Brian Jackson | 11,455 | 29.36 | -8.77 | ||||
| New Democratic | Mike Comeau | 4,421 | 11.33 | -1.21 | ||||
| Green | Tom Mayberry | 3,441 | 8.82 | +6.83 | ||||
| Independent | Jim Bender | 659 | 1.69 | |||||
| Family Coalition | Leonard Vanderhoeven | 601 | 1.54 | -0.08 | ||||
| Total valid votes | 39,022 | 100.0 | ||||||
| 2003 Ontario general election | ||||||||
|---|---|---|---|---|---|---|---|---|
| Party | Candidate | Votes | % | ±% | ||||
| Progressive Conservative | Ernie Hardeman | 18,656 | 44.06 | -9.19 | ||||
| Liberal | Brian Brown | 16,135 | 38.10 | +2.57 | ||||
| New Democratic | Shawn Rouse | 5,318 | 12.56 | +5.35 | ||||
| Green | Tom Mayberry | 838 | 1.98 | |||||
| Family Coalition | Andre De Decker | 689 | 1.63 | -0.42 | ||||
| Freedom | Paul Blair | 404 | 0.95 | +0.22 | ||||
| Libertarian | Kaye Sargent | 306 | 0.72 | -0.03 | ||||
| Total valid votes | 42,346 | 100.0 | ||||||
| 1999 Ontario general election | ||||||||
|---|---|---|---|---|---|---|---|---|
| Party | Candidate | Votes | % | |||||
| Progressive Conservative | Ernie Hardeman | 22,726 | 53.25 | |||||
| Liberal | Brian Brown | 15,160 | 35.53 | |||||
| New Democratic | Martin Donlevy | 3,077 | 7.21 | |||||
| Family Coalition | Andre De Decker | 875 | 2.05 | |||||
| Libertarian | Kaye Sargent | 321 | 0.75 | |||||
| Freedom | Paul Blair | 312 | 0.73 | |||||
| Natural Law | Jim Morris | 203 | 0.48 | |||||
| Total valid votes | 42,674 | 100.0 | ||||||
2007 electoral reform referendum
| 2007 Ontario electoral reform referendum | |||
|---|---|---|---|
| Side | Votes | ||
| First Past the Post | 25,059 | 66 | |
| Mixed member proportional | 12,917 | 34 | |
| Total valid votes | 37,976 | 100.0 | |
References
- Beatty, Bob (Summer 2008). "Oxford MPs: Confederation till Now" (PDF). Oxford Update. Dave MacKenzie. p. 2. Retrieved 2009-07-22.
Sources
- "Summary of Valid Votes Cast for each Candidate" (PDF). Elections Ontario. p. 8. Archived from the original (PDF) on 28 December 2018. Retrieved 20 January 2019.
- Elections Ontario. "General Election Results by District, 067 Oxford". Retrieved 13 June 2014.
- Elections Ontario (2011). "Official return from the records / Rapport des registres officiels - Oxford" (PDF). Retrieved 2 June 2014.
This article is issued from Wikipedia. The text is licensed under Creative Commons - Attribution - Sharealike. Additional terms may apply for the media files.