Etobicoke—Lakeshore (provincial electoral district)
Etobicoke—Lakeshore is a provincial electoral district in Toronto, Ontario, Canada. It elects one member to the Legislative Assembly of Ontario.
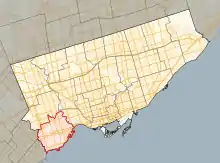 Location in Toronto | |||
| Provincial electoral district | |||
| Legislature | Legislative Assembly of Ontario | ||
| MPP |
Progressive Conservative | ||
| District created | 1987 | ||
| First contested | 1987 | ||
| Last contested | 2018 | ||
| Demographics | |||
| Population (2011) | 122,999 | ||
| Electors (2013) | 89,550 | ||
| Area (km²) | 41.71 | ||
| Pop. density (per km²) | 2,948.9 | ||
| Census division(s) | Toronto | ||
| Census subdivision(s) | Toronto | ||
It was created in 1987 from Lakeshore.
From 1987 to 1999 the district included all of Etobicoke south of a line following the CP Railway to Kipling Avenue to Bloor Street.
In 1999 the border was moved up to a line following Dundas Street to the 427 to Burnhamthorpe Road to Kipling Avenue to Mimico Creek to the Canadian Pacific Railway to Dundas Street.
In 2007, the borders were not altered.
Members of Provincial Parliament
| Etobicoke—Lakeshore | ||||
|---|---|---|---|---|
| Assembly | Years | Member | Party | |
| Riding created from Lakeshore | ||||
| 34th | 1987–1990 | Ruth Grier | New Democratic | |
| 35th | 1990–1995 | |||
| 36th | 1995–1999 | Morley Kells | Progressive Conservative | |
| 37th | 1999–2003 | |||
| 38th | 2003–2007 | Laurel Broten | Liberal | |
| 39th | 2007–2011 | |||
| 40th | 2011–2013 | |||
| 2013–2014 | Doug Holyday | Progressive Conservative | ||
| 41st | 2014–2018 | Peter Milczyn | Liberal | |
| 42nd | 2018–Present | Christine Hogarth | Progressive Conservative | |
| Sourced from the Ontario Legislative Assembly[1] | ||||
Election results
| 2018 Ontario general election | ||||||||
|---|---|---|---|---|---|---|---|---|
| Party | Candidate | Votes | % | ±% | ||||
| Progressive Conservative | Christine Hogarth | 22,626 | 38.35 | +4.00 | ||||
| New Democratic | Phil Trotter | 19,401 | 32.89 | +20.46 | ||||
| Liberal | Peter Milczyn | 14,305 | 24.25 | -23.23 | ||||
| Green | Chris Caldwell | 2,138 | 3.62 | -0.41 | ||||
| Libertarian | Mark Wrzesniewski | 360 | 0.61 | -0.05 | ||||
| Ontario Moderate Party | Ian Lytvyn | 163 | 0.28 | |||||
| Total valid votes | 58,993 | 100.0 | ||||||
| Progressive Conservative gain | Swing | |||||||
| Source: Elections Ontario[2] | ||||||||
| 2014 Ontario general election | ||||||||
|---|---|---|---|---|---|---|---|---|
| Party | Candidate | Votes | % | ±% | ||||
| Liberal | Peter Milczyn | 24,311 | 47.48 | +5.18 | ||||
| Progressive Conservative | Doug Holyday | 17,587 | 34.35 | -12.40 | ||||
| New Democratic | P. C. Choo | 6,362 | 12.43 | +5.02 | ||||
| Green | Angela Salewsky | 2,064 | 4.03 | +1.78 | ||||
| Libertarian | Mark Wrzesniewski | 336 | 0.66 | +0.22 | ||||
| Socialist | Natalie Lochwin | 236 | 0.46 | – | ||||
| Freedom | Jeff Merklinger | 198 | 0.39 | +0.26 | ||||
| Ontario Moderate Party | Ian Lytvyn | 108 | 0.21 | – | ||||
| Total valid votes | 51,202 | 100.0 | ||||||
| Liberal gain from Progressive Conservative | Swing | +8.79 | ||||||
| Source: Elections Ontario[3] | ||||||||
| Ontario provincial by-election, August 1, 2013 Resignation of Laurel Broten | ||||||||
|---|---|---|---|---|---|---|---|---|
| Party | Candidate | Votes | % | ±% | ||||
| Progressive Conservative | Doug Holyday | 16,034 | 46.75 | +17.51 | ||||
| Liberal | Peter Milczyn | 14,506 | 42.30 | -8.72 | ||||
| New Democratic | P. C. Choo | 2,542 | 7.41 | -8.04 | ||||
| Green | Angela Salewsky | 771 | 2.25 | -0.43 | ||||
| Special Needs | Dan King | 157 | 0.46 | +0.07 | ||||
| Libertarian | Hans Kunov | 152 | 0.44 | +0.05 | ||||
| People's | Kevin Clarke | 87 | 0.25 | |||||
| Freedom | Wayne Simmons | 46 | 0.13 | -0.27 | ||||
| Total valid votes | 34,295 | 100.00 | ||||||
| Total rejected, unmarked and declined ballots | 214 | 0.62 | ||||||
| Turnout | 34,509 | 37.95 | ||||||
| Eligible voters | 90,927 | |||||||
| Progressive Conservative gain | Swing | +13.12 | ||||||
| Source: Elections Ontario[4] | ||||||||
Police detective Steve Ryan had originally been nominated by the Progressive Conservatives, however, according to party leader Tim Hudak, Ryan was unable to run in the by-election due to injuries sustained in a work related automobile accident; city councillor Doug Holyday was recruited to be the party's candidate instead.[5]
| 2011 Ontario general election | ||||||||
|---|---|---|---|---|---|---|---|---|
| Party | Candidate | Votes | % | ±% | ||||
| Liberal | Laurel Broten | 22,169 | 51.02 | +5.03 | ||||
| Progressive Conservative | Simon Nyilassy | 12,705 | 29.24 | -1.43 | ||||
| New Democratic | Dionne Coley | 6,713 | 15.45 | +2.17 | ||||
| Green | Angela Salewsky | 1,164 | 2.68 | - 5.21 | ||||
| Freedom | Mark Brombacher | 174 | 0.40 | |||||
| Libertarian | Hans Kunov | 172 | 0.40 | |||||
| Socialist | Natalie Lochwin | 125 | 0.29 | |||||
| Independent | John Letonja | 113 | 0.26 | |||||
| Independent | Thane MacKay | 113 | 0.26 | |||||
| Total valid votes | 43,448 | 100.00 | ||||||
| Total rejected, unmarked and declined ballots | 255 | 0.58 | ||||||
| Turnout | 43,703 | 50.01 | ||||||
| Eligible voters | 87,390 | |||||||
| Liberal hold | Swing | +3.23 | ||||||
| Source: Elections Ontario[6] | ||||||||
| 2007 Ontario general election | ||||||||
|---|---|---|---|---|---|---|---|---|
| Party | Candidate | Votes | % | ±% | ||||
| Liberal | Laurel Broten | 20,218 | 45.99 | +1.83 | ||||
| Progressive Conservative | Tom Barlow | 13,482 | 30.67 | -1.92 | ||||
| New Democratic | Andrea Németh | 5,837 | 13.28 | -6.81 | ||||
| Green | Jerry Schulman | 3,467 | 7.89 | +6.30 | ||||
| Independent | Janice Murray | 480 | 1.09 | +0.59 | ||||
| Family Coalition | Bob Williams | 478 | 1.09 | +0.01 | ||||
| Total valid votes | 43,962 | 100.00 | ||||||
| Total rejected, unmarked and declined ballots | 397 | 0.90 | ||||||
| Turnout | 44,359 | 53.62 | ||||||
| Eligible voters | 82,728 | |||||||
| Elections Ontario:[7] | ||||||||
| 2003 Ontario general election | ||||||||
|---|---|---|---|---|---|---|---|---|
| Party | Candidate | Votes | % | ±% | ||||
| Liberal | Laurel Broten | 19,680 | 44.16 | +8.31 | ||||
| Progressive Conservative | Morley Kells | 14,524 | 32.59 | -14.39 | ||||
| New Democratic | Irene Jones | 8,952 | 20.09 | +5.37 | ||||
| Green | Junyee Wang | 708 | 1.59 | |||||
| Family Coalition | Ted Kupiec | 480 | 1.08 | +0.12 | ||||
| Independent | Janice Murray | 225 | 0.50 | -0.18 | ||||
| Total valid votes | 44,569 | 100.00 | ||||||
| Total rejected, unmarked and declined ballots | 237 | 0.53 | ||||||
| Turnout | 44,806 | 59.52 | ||||||
| Eligible voters | 75,279 | |||||||
| Elections Ontario:[8] | ||||||||
| 1999 Ontario general election | ||||||||
|---|---|---|---|---|---|---|---|---|
| Party | Candidate | Votes | % | ±% | ||||
| Progressive Conservative | Morley Kells | 20,602 | 46.98 | +1.75 | ||||
| Liberal | Laurel Broten | 15,723 | 35.85 | +6.27 | ||||
| New Democratic | Vicki Obedkoff | 6,457 | 14.72 | -10.45 | ||||
| Family Coalition | Kevin McGourty | 423 | 0.96 | |||||
| Natural Law | Don Jackson | 349 | 0.80 | +0.16 | ||||
| Independent | Janice Murray | 299 | 0.68 | |||||
| Total valid votes | 43,853 | 100.00 | ||||||
| Total rejected, unmarked and declined ballots | 527 | 1.20 | ||||||
| Turnout | 44,380 | 60.34 | ||||||
| Eligible voters | 73,551 | |||||||
| Elections Ontario:[9] | ||||||||
| 1995 Ontario general election | ||||||||
|---|---|---|---|---|---|---|---|---|
| Party | Candidate | Votes | % | ±% | ||||
| Progressive Conservative | Morley Kells | 14,879 | 45.23 | +29.69 | ||||
| Liberal | Bruce Davis | 9,074 | 27.58 | +5.15 | ||||
| New Democratic | Ruth Grier | 8,279 | 25.17 | -32.83 | ||||
| Libertarian | Daniel Hunt | 270 | 0.82 | |||||
| Natural Law | Geraldine Jackson | 209 | 0.64 | |||||
| Independent | Julie Northrup | 186 | 0.56 | |||||
| Total valid votes | 32,897 | 100.00 | ||||||
| Total rejected, unmarked and declined ballots | 431 | 1.31 | ||||||
| Turnout | 33,328 | 66.55 | ||||||
| Eligible voters | 50,083 | |||||||
| Elections Ontario:[10] | ||||||||
| 1990 Ontario general election | ||||||||
|---|---|---|---|---|---|---|---|---|
| Party | Candidate | Votes | % | ±% | ||||
| New Democratic | Ruth Grier | 18,118 | 58.00 | +13.41 | ||||
| Liberal | Sam Shephard | 7,006 | 22.43 | -15.04 | ||||
| Progressive Conservative | Jeff Knoll | 4,854 | 15.54 | +1.22 | ||||
| Family Coalition | Trish O'Connor | 1,053 | 3.37 | -0.25 | ||||
| Green | Phaedra Livingstone | 629 | 0.67 | |||||
| Total valid votes | 31,660 | 100.00 | ||||||
| Total rejected, unmarked and declined ballots | 447 | 1.51 | ||||||
| Turnout | 32,137 | 66.15 | ||||||
| Eligible voters | 48,584 | |||||||
| Toronto Star[11] | ||||||||
| 1987 Ontario general election | ||||||||
|---|---|---|---|---|---|---|---|---|
| Party | Candidate | Votes | % | |||||
| New Democratic | Ruth Grier | 14,821 | 44.59 | |||||
| Liberal | Frank Sgarlata | 12,454 | 37.47 | |||||
| Progressive Conservative | Al Kolyn | 4,760 | 14.32 | |||||
| Family Coalition | Michael Doyle | 1,203 | 3.62 | |||||
| Total valid votes | 33,238 | 100.00 | ||||||
| Toronto Star:[12] | ||||||||
2007 electoral reform referendum
| 2007 Ontario electoral reform referendum | |||
|---|---|---|---|
| Side | Votes | % | |
| First Past the Post | 25,800 | 60.8 | |
| Mixed member proportional | 16,658 | 39.2 | |
| Total valid votes | 42,458 | 100.0 | |
References
- For a listing of each MPP's Queen's Park curriculum vitae see below:
- For Ruth Grier's Legislative Assembly information see "Ruth Grier, MPP". Parliamentary History. Toronto: Legislative Assembly of Ontario. 2014. Retrieved 2014-09-08.
- For Morley Kells' Legislative Assembly information see "Morley Kells, MPP". Parliamentary History. Toronto: Legislative Assembly of Ontario. 2014. Retrieved 2014-09-08.
- For Laurel Broten's Legislative Assembly information see "Laurel Broten, MPP". Parliamentary History. Toronto: Legislative Assembly of Ontario. 2014. Retrieved 2014-09-08.
- For Doug Holyday's Legislative Assembly information see "Doug Holyday, MPP". Parliamentary History. Toronto: Legislative Assembly of Ontario. 2014. Retrieved 2014-09-08.
- For Peter Milczyn's Legislative Assembly information see "Peter Milczyn, MPP". Parliamentary History. Toronto: Legislative Assembly of Ontario. 2014. Retrieved 2014-09-08.
- "Summary of Valid Votes Cast for each Candidate" (PDF). Elections Ontario. Retrieved 16 January 2019.
- Elections Ontario (2014). "Official result from the records, 024 Etobicoke—Lakeshore" (PDF). Retrieved 27 June 2015.
- "Official return from the records / Rapport des registres officiels - Etobicoke—Lakeshore" (PDF). Elections Ontario. 2013. Archived from the original (PDF) on 2014-05-05. Retrieved 2014-05-10.
- Canadian Press (July 4, 2013). "Deputy Mayor Doug Holyday to run for provincial Conservatives". Newstalk 1010. Retrieved July 4, 2013.
- "2011 Official Poll by Poll Results: Etobicoke-Lakeshore" (PDF). Elections Ontario. 2011. Retrieved 2013-06-02.
- Elections Ontario. "2007 Official Poll by Poll Results: Etobicoke-Lakeshore" (PDF). Archived from the original (PDF) on 2014-05-01. Retrieved 2013-06-02.
- Elections Ontario. "Poll by Poll Elections Ontario, General Election of October 2, 2003:Etobicoke—Lakeshore". Retrieved 2013-06-02.
- Elections Ontario. "Poll by Poll Elections Ontario, General Election of June 3, 1999: Etobicoke—Lakeshore". Retrieved 2013-06-02.
- "Summary of Valid Ballots by Candidate". Elections Ontario. 1995-06-08. Archived from the original on 2014-03-15. Retrieved 2013-06-02.
- "How Metro-Area Voted". The Toronto Daily Star. Toronto. 1990-09-07. p. A10.
- "How Metro-Area Voted". The Toronto Daily Star. Toronto. 1987-09-11. p. A12.