Kalamazoo–Portage metropolitan area
The Kalamazoo–Portage Metropolitan Area comprises a region surrounding Kalamazoo. 2015 estimates placed it as the 151st largest among similarly designated areas in the United States. 2015 estimates place the combined statistical area 85th among similarly designated areas.
Metropolitan Kalamazoo
| |
|---|---|
 Downtown Kalamazoo skyline | |
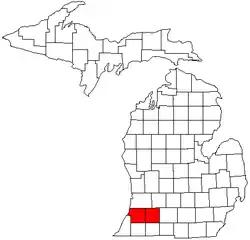
 Map of Michigan highlighting the Kalamazoo-Portage metropolitan area | |
| Coordinates: 42.1724°N 85.3524°W | |
| Country | |
| State | |
| Largest city | Kalamazoo |
| Counties | List
|
| Population (2015) | |
| • MSA | 335,340 |
| • CSA | 530,672 |
| Time zone | UTC-5 (EST) |
| • Summer (DST) | UTC-4 (EDT) |
Definitions
The Kalamazoo–Portage Metropolitan Area is a United States metropolitan area defined by the federal Office of Management and Budget (OMB) consisting of two counties, Kalamazoo and Van Buren, in western Michigan, anchored by the cities of Kalamazoo and Portage. As of the 2010 census, the Metropolitan Statistical Area (MSA) had a population of 326,589.[1]
The Kalamazoo–Battle Creek–Portage Combined Statistical Area ties for 3rd largest CSA in the U.S. state of Michigan. As of the 2010 census, the CSA had a population of 524,030. The CSA combines the two population centers of Kalamazoo and Battle Creek. It includes the two counties of the Kalamazoo–Portage Metropolitan Statistical Area plus one metropolitan area, Battle Creek in Calhoun County and one micropolitan area, Sturgis in St. Joseph County.
Cities and towns

Places with 25,000 to 100,000 inhabitants
Places with 5,000 to 25,000 inhabitants
- Albion
- Antwerp Township
- Bedford Charter Township
- Comstock Charter Township
- Cooper Township
- Emmett Charter Township
- Kalamazoo Charter Township
- Marshall
- Oshtemo Township
- Pavilion Township
- Paw Paw Township
- Pennfield Charter Township
- Richland Township
- Ross Township
- Schoolcraft Township
- Springfield
- Texas Township
Demographics
As of the census[2] of 2000, there were 314,866 people, 121,461 households, and 78,270 families residing within the MSA. The racial makeup of the MSA was 85.38% White, 8.64% African American, 0.54% Native American, 1.46% Asian, 0.03% Pacific Islander, 1.80% from other races, and 2.16% from two or more races. Hispanic or Latino of any race were 3.79% of the population.
The median income for a household in the MSA was $40,694, and the median income for a family was $49,889. Males had a median income of $37,464 versus $26,514 for females. The per capita income for the MSA was $19,809.
References
- "Population of Michigan Regions, 2000 and 2010". michigan.gov.
- "U.S. Census website". United States Census Bureau. Retrieved 2008-01-31.

