List of countries by meat consumption
This is a list of countries by meat consumption. Meat is animal flesh that is eaten as food.[1]
Accuracy
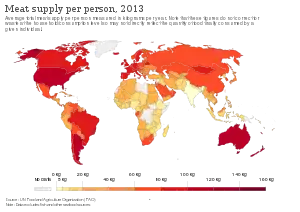
The figures tabulated below do not represent per capita amounts of meat eaten by humans. Instead, they represent FAO figures for carcass mass availability (with "carcass mass" for poultry estimated as ready-to-cook mass),[2] divided by population. The amount eaten by humans differs from carcass mass availability because the latter does not account for losses, which include bones, losses in retail and food service or home preparation (including trim and cooking), spoilage and "downstream" waste, and amounts consumed by pets (compare dressed weight).[3][4][5] As an example of the difference, for 2002, when the FAO figure for US per capita meat consumption was 124.48 kg (274.4 lb), the USDA estimate of US per capita loss-adjusted meat consumption was 62.6 kg (138 lb).[6] Additionally, the 2002 FAO study was potentially misleading for countries with high levels of meat export compared to their population, as it relied on production data using full carcass mass availability, whereas exports generally contain less bones, cartilage and other things not typically used for human consumption. For example, the FAO (2002) figure for Denmark, which has one of the highest meat export rates compared to its population, was 145.9 kg (322 lb) (highest in the world). More recent FAO figures (2009) have taken the earlier discrepancy into account, resulting in a significantly lower 95.2 kg (210 lb) for Denmark (13th in the world).[7][8] When further adjusted for loss, calculations by DTU Fødevareinstituttet suggest the actual consumption was 48 kg (106 lb) per adult.[8]
Meat consumption by country
| Country | kg/person (2002)[9][note 1] | kg/person (2009)[10] | kg/person (2017)[11] |
|---|---|---|---|
| 38.2 | |||
| 18.3 | 19.5 | 17.33 | |
| 24.9 | 26.8 | ||
| 19 | 22.4 | ||
| 56 | 84.3 | ||
| 79.7 | 98.3 | 91.40 | |
| 27.7 | 45.8 | ||
| 108.2 | 111.5 | 94.61 | |
| 94.1 | 102 | ||
| 15.9 | 32 | ||
| 123.6 | 109.5 | ||
| 70.7 | |||
| 3.1 | 4 | 3.29 | |
| 88.7 | 74.5 | ||
| 58.6 | 78.4 | ||
| 86.1 | 76.9 | ||
| 74.7 | 42.5 | ||
| 16.2 | 20.9 | ||
| 3 | |||
| 50 | 59.1 | ||
| 21.4 | 27.9 | ||
| 27.3 | 26.2 | ||
| 82.4 | 85.3 | 78.60 | |
| 69.4 | 53 | ||
| 11.2 | 14.8 | ||
| 3.5 | 5.2 | ||
| 13.9 | 16.6 | ||
| 14.4 | 12.7 | ||
| 108.1 | 94.3 | 69.99 | |
| 26.3 | 46.1 | ||
| 11.3 | 13.3 | ||
| 28 | 33.5 | ||
| 14.3 | 13 | ||
| 66.4 | 74.1 | 71.97 | |
| 52.4 | 58.2 | 50.20 | |
| 33.9 | 46.5 | 43.92 | |
| 7.6 | 13.4 | ||
| 13.3 | 13.4 | ||
| 4.8 | 5.3 | ||
| 40.4 | 51.1 | ||
| 49.9 | 66.3 | ||
| 32.2 | 49.4 | ||
| 131.3 | 78.1 | ||
| 77.3 | 83.4 | ||
| 145.9 | 95.2 | ||
| 17.1 | 23.7 | ||
| 67.1 | 68.6 | ||
| 37.8 | 53.7 | ||
| 45 | 56.4 | ||
| 22.5 | 25.6 | 19.94 | |
| 21.4 | 28.3 | ||
| 7.7 | 7.7 | ||
| 67.4 | 59.6 | ||
| 7.9 | 8.5 | 4.22 | |
| 39.1 | 38.8 | ||
| 67.4 | 74.8 | ||
| 101.1 | 86.7 | ||
| 13.2 | 14.6 | ||
| 112.2 | 101.9 | ||
| 46 | 66.4 | ||
| 5.2 | 8.1 | ||
| 26 | 25.5 | ||
| 82.1 | 88.1 | ||
| 9.9 | 13.9 | 9.32 | |
| 78.7 | 74.8 | ||
| 97 | 61 | ||
| 12.7 | 13.6 | ||
| 52.6 | |||
| 23.8 | 28.8 | ||
| 6.5 | 8.6 | ||
| 13 | 16.2 | ||
| 31.8 | 39 | ||
| 15.3 | 15.6 | 14.19 | |
| 24.7 | 34.3 | ||
| 100.7 | 76 | ||
| 84.8 | 86.2 | ||
| 5.2 | 4.4 | 3.16 | |
| 8.3 | 11.6 | 11.27 | |
| 23.1 | 36.3 | 28.98 | |
| 106.3 | 87.9 | ||
| 97.1 | 96 | 80.35 | |
| 90.4 | 90.7 | ||
| 56.8 | 59.1 | ||
| 45.9 | 45.9 | 36.45 | |
| 29.8 | 42 | ||
| 44.8 | 62.6 | 43.65 | |
| 14.3 | 16.7 | ||
| 32.1 | 38.5 | ||
| 60.2 | 119.2 | ||
| 39 | 36.9 | ||
| 15 | 21.3 | ||
| 45.7 | 61.5 | ||
| 63.1 | 58.8 | ||
| 15.4 | 18.3 | ||
| 7.9 | 10.4 | ||
| 28.6 | 33.5 | ||
| 49.5 | 78.2 | ||
| 141.7 | 107.9 | ||
| 35.4 | 40.8 | ||
| 17.6 | 14.7 | ||
| 5.1 | 8.3 | ||
| 50.9 | 52.3 | 54.75 | |
| 16.6 | 21.6 | ||
| 19 | 22.2 | ||
| 86.9 | 84.5 | ||
| 13.9 | |||
| 29.9 | 29.7 | ||
| 39.6 | 49.4 | ||
| 58.6 | 63.8 | 47.71 | |
| 22.7 | 26.8 | ||
| 108.8 | 82.1 | ||
| 57.7 | |||
| 20.6 | 30.1 | ||
| 5.6 | 7.8 | 7.21 | |
| 10.7 | 32.1 | ||
| 34 | 28.3 | ||
| 10 | 9.9 | ||
| 89.3 | 85.5 | 76.60 | |
| 73.3 | 91 | ||
| 76.6 | 72.6 | ||
| 142.1 | 106.4 | 72.14 | |
| 14.9 | 25.3 | ||
| 11.2 | 25.6 | ||
| 8.6 | 8.8 | 5.91 | |
| 61.7 | 66 | ||
| 10.8 | 13.4 | ||
| 49.8 | |||
| 12.3 | 14.7 | 12.79 | |
| 54.5 | 63.5 | ||
| 73 | |||
| 70.3 | 41.9 | 52.68 | |
| 34.5 | 20.8 | 47.53 | |
| 31.1 | 33.6 | 29.62 | |
| 78.1 | 76.9 | ||
| 91.1 | 93.4 | ||
| 90.5 | |||
| 46.8 | |||
| 54.5 | 64.7 | ||
| 51 | 69.2 | 60.66 | |
| 4.4 | 6.5 | ||
| 99.3 | 70.8 | ||
| 124.1 | 93.6 | ||
| 79.1 | 91.4 | ||
| 82.6 | 87.2 | ||
| 9.6 | 16.5 | ||
| 44.6 | 54.4 | 54.05 | |
| 17.7 | 15.8 | ||
| 45.2 | |||
| 77.6 | [12] | ||
| 51.1 | 35.6 | ||
| 6.1 | 7.3 | ||
| 71.1 | |||
| 67.4 | 60.4 | ||
| 88 | 88.3 | ||
| 9.7 | 11.9 | ||
| 39 | 58.6 | 50.17 | |
| 48 | 54.1 | 55.89 | |
| 118.6 | 97 | ||
| 6.6 | 6.3 | ||
| 21 | 19.1 | ||
| 40.3 | 47.5 | ||
| 34.2 | 26.9 | ||
| 76.1 | 80.2 | ||
| 72.9 | 74.7 | ||
| 21.2 | 22.8 | ||
| 8.7 | 14.7 | ||
| 27.9 | 25.8 | 22.85 | |
| 41.3 | 33.8 | ||
| 10 | 9.6 | 6.82 | |
| 8.5 | 11.7 | ||
| 57.8 | 47.7 | ||
| 25.5 | 25.9 | ||
| 19.3 | 25.3 | 30.39 | |
| 41.7 | 58.6 | ||
| 11.7 | 11 | ||
| 32.3 | 48.5 | 41.68 | |
| 74.4 | 73.8 | ||
| 79.6 | 84.2 | ||
| 124.8 | 120.2 | 98.60 | |
| 6.6 | |||
| 98.6 | 55.3 | 81.04 | |
| 20.7 | 28.4 | ||
| 32.6 | 35.4 | ||
| 56.6 | 76.8 | ||
| 28.6 | 49.9 | 52.90 | |
| 14.7 | 17.9 | ||
| 11.9 | 12.3 | ||
| 15.2 | 21.3 | 13.64 |
- Source: Food and Agriculture Organization of the United Nations (FAO), FAOSTAT on-line statistical service (FAO, Rome, 2004). Available online at: http://faostat3.fao.org/
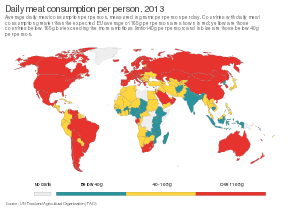
- Meat consumption per capita refers to the total meat retained for use in country per person per year. Total meat includes meat from animals slaughtered in countries, irrespective of their origin, and comprises horsemeat, poultry, and meat from all other domestic or wild animals such as camels, rabbits, reindeer, and game animals
- Per capita calculations were conducted by WRI using FAO data on meat production and trade, and using U.N. data on population. Meat consumption was calculated using a trade balance approach - total production plus imports, minus exports
![]() European Union in 2017: 69.6 kg/person
European Union in 2017: 69.6 kg/person
See also
Notes
- These are the original numbers reported by the FAO in 2002. They were changed by the FAO in later updates[10] (following the same standardized system they used in 2009)
References
- Lawrie, R. A.; Ledward, D. A. (2006). Lawrie’s meat science (7th ed.). Cambridge: Woodhead Publishing Limited. ISBN 978-1-84569-159-2.
- FAOSTAT. (Statistical database of the Food and Agriculture Organization of the United Nations. Methods and Standards. http://faostat3.fao.org/mes/methodology_list/E
- Loss-adjusted food availability documentation. United States Department of Agriculture, Economic Research Service. http://www.ers.usda.gov/data-products/food-availability-(per-capita)-data-system/loss-a<djusted-food-availability-documentation.aspx
- Buzby, J. C. H. F. Wells, B. Axtman and J. Mickey. 2009. Supermarket loss estimates for fresh fruit, vegetables, meat, poultry, and seafood and their use in the ERS loss-adjusted food availability data. United States Department of Agriculture. Econ. Infor. Bull. EIB-44. 26 pp.
- Muth, M. K., S. A.Karns, S. J. Nielsen, J. C. Buzby and H. F. Wells. 2011. Consumer-level food loss estimates and their use in the ERS loss-adjusted food availability data. United States Department of Agriculture Tech. Bull. TB-1927. 123 pp.
- Food availability (per capita) data system. (Excel files). United States Department of Agriculture, Economic Research Service. http://www.ers.usda.gov/data-products/food-availability-(per-capita)-data-system/.aspx#26705
- Foodculture.dk (11 March 2013). "Forkerte tal om danskernes forbrug fordrejer køddebatten". Retrieved 31 May 2016.
- Landbrug & Fødevarer (14 August 2013). "Danskernes forbrug af kød". Archived from the original on 25 September 2013. Retrieved 31 May 2016.
- "Meat consumption per capita". The Guardian. 2009. Retrieved 21 February 2019.
- Food and Agriculture Organization of the United Nations (FAO) (2013). "Current Worldwide Annual Meat Consumption per capita". ChartsBin. Retrieved 21 February 2019.
- "Agricultural output - Meat consumption - OECD Data". theOECD.
- the State Union of Serbia and Montenegro was dissolved in 2006
- Brown, Felicity (2 September 2009). "Meat consumption per capita". Retrieved 3 September 2014.
External links
- "FAO's Animal Production and Health Division: Meat & Meat Products". fao.org. Retrieved 2017-07-12.
- "Agricultural output - Meat consumption". theOECD. Retrieved 2017-07-12.
| Poultry |   | |
|---|---|---|
| Livestock | ||
| Game | ||
| Fish | ||
| Shellfish and other seafood | ||
| Insects | ||
| Cuts and preparation | ||
| List articles | ||
| Related subjects |
| |
| ||