Oneida County, Idaho
Oneida County is a county located in the U.S. state of Idaho. As of the 2010 Census the county had a population of 4,286.[1] The county seat and largest city is Malad City.[2] Most of the county's population lives in Malad City and the surrounding Malad Valley.
Oneida County | |
|---|---|
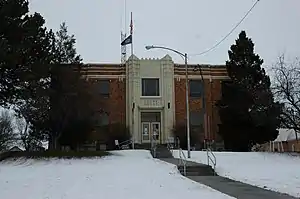 Oneida County Courthouse in Malad City | |
 Seal | |
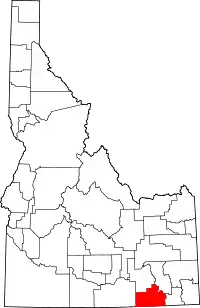 Location within the U.S. state of Idaho | |
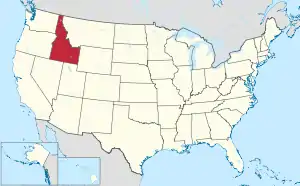 Idaho's location within the U.S. | |
| Coordinates: 42°13′N 112°31′W | |
| Country | |
| State | |
| Founded | January 22, 1864 |
| Named for | Oneida Lake, New York |
| Seat | Malad City |
| Largest city | Malad City |
| Area | |
| • Total | 1,202 sq mi (3,110 km2) |
| • Land | 1,200 sq mi (3,000 km2) |
| • Water | 1.5 sq mi (4 km2) 0.1% |
| Population (2010) | |
| • Total | 4,286 |
| • Estimate (2019) | 4,531 |
| • Density | 3.8/sq mi (1.5/km2) |
| Time zone | UTC−7 (Mountain) |
| • Summer (DST) | UTC−6 (MDT) |
| Congressional district | 2nd |
| Website | oneidacountyid |
History
The county is named for Oneida Lake, New York, the area from which most of the early settlers had emigrated.[3]
Oneida County was organized on January 22, 1864 with its county seat established at Soda Springs in present-day Caribou County.[4] The county seat was moved to Malad City in 1866 because of its population growth and location on the freight road and stagecoach line between Corinne, Utah, and the mines in Butte, Montana.
Early in its lengthy history, Oneida County had the distinction of being Idaho's largest county by both area and population. Its initial size was 32,708 mi2 making it the third largest of the 17 counties created by the first legislature of Idaho Territory in 1863 and early 1864. When the US Congress created Montana Territory on May 26, 1864, it also transferred a portion of Oneida County over to Dakota Territory. Even with the loss of territory, the act left Oneida County as Idaho's largest remaining Idaho county at 20,621 mi2. Alturas County exchanged territory with Boise County in 1866 to increase its land area above that of Oneida County. Oneida County lost significant territory to Wyoming Territory in 1868, to the creation of Bear Lake County in 1875, and to the creation of Cassia County in 1879. Minor adjustments to boundaries occurred in 1871, 1875, and 1877. Creation of Bingham County in 1885 left Oneida County with only 2,633 mi2, while creation of Franklin and Power Counties further reduced the county's area to 1,219 mi2 in 1913. Minor changes to boundaries occurred in 1917 and 1927 that gave Oneida County its present land area.
Early loss of territory had no impact on population growth of the county as some areas lost had almost no population or were offset by heavy migration of Mormons occurring along Idaho's southern border. Oneida County was officially Idaho Territory's 3rd most populous behind Boise and Ada counties at Idaho Territory's first decennial census in 1870. However, the county's actual population was severely undercounted as a result of its lack of a surveyed southern boundary. The survey of Idaho's southern border by 1872 revealed that the 1870 Census had erroneously assigned eight Idaho settlements in the Bear Lake Valley to Rich County, Utah and five Idaho settlements in the Cache Valley to Cache County, Utah. Had the settlements been accurately assigned to Oneida County in 1870, the county would have been Idaho's largest with 4,647 residents.[5][6] Oneida County would go on to officially become Idaho's most populous county at the 1880 Census with 6,964 residents even after it had lost populated territory to creation of Bear Lake and Cassia Counties.[7] The loss of large population centers achieved through the creation of Bingham County resulted in the county's first decline in population at the 1890 Census. While diminished in significance, the county was still one of the State's more prominent counties at that time. Oneida County did retain developing population centers at Malad City, American Falls, and Preston. Their growth led to a peak in the county's population at the 1910 Census. The county lost much of its prominence with the creation of Franklin and Power Counties in 1913. The loss in territory again caused a population decline while Malad City and even outlying areas experienced growth through the 1920 Census. After the 1920 Census, Oneida County experienced fifty years of population decline, losing more than half of its 1920 population by the 1970 Census. The county has regained less than 40% of its lost population as of the 2016 Census estimate.[8]
Geography
According to the U.S. Census Bureau, the county has a total area of 1,202 square miles (3,110 km2), of which 1,200 square miles (3,100 km2) is land and 1.5 square miles (3.9 km2) (0.1%) is water.[9]
Oxford Peak is the highest point in the county at 9,285 ft (2830.2 m) above sea level. Alternating valleys and ridges of mountains or hills typify the topography, with grassland and sagebrush covering most areas. The Curlew National Grassland lies within the county.
Adjacent counties
- Power County – north
- Bannock County – northeast
- Franklin County – east
- Cache County, Utah – southeast
- Box Elder County, Utah – south
- Cassia County – west
Major highways
National protected areas
- Caribou National Forest (part)
- Curlew National Grassland (part)
- Sawtooth National Forest (part)
Demographics
| Historical population | |||
|---|---|---|---|
| Census | Pop. | %± | |
| 1870 | 1,922 | — | |
| 1880 | 6,964 | 262.3% | |
| 1890 | 6,819 | −2.1% | |
| 1900 | 8,933 | 31.0% | |
| 1910 | 15,170 | 69.8% | |
| 1920 | 6,723 | −55.7% | |
| 1930 | 5,870 | −12.7% | |
| 1940 | 5,417 | −7.7% | |
| 1950 | 4,387 | −19.0% | |
| 1960 | 3,603 | −17.9% | |
| 1970 | 2,864 | −20.5% | |
| 1980 | 3,258 | 13.8% | |
| 1990 | 3,492 | 7.2% | |
| 2000 | 4,125 | 18.1% | |
| 2010 | 4,286 | 3.9% | |
| 2019 (est.) | 4,531 | 5.7% | |
| U.S. Decennial Census[10] 1790–1960[11] 1900–1990[12] 1990–2000[13] 2010–2018[1] 2019[14] | |||
2000 census
As of the census[15] of 2000, there were 4,125 people, 1,430 households, and 1,092 families living in the county. The population density was 3 people per square mile (1/km2). There were 1,755 housing units at an average density of 2 per square mile (1/km2). The racial makeup of the county was 97.50% White, 0.12% Black or African American, 0.32% Native American, 0.15% Asian, 0.07% Pacific Islander, 1.36% from other races, and 0.48% from two or more races. 2.30% of the population were Hispanic or Latino of any race. 27.2% were of English, 20.0% Welsh, 12.0% "American", 7.1% German, and 6.8% Danish ancestry.
There were 1,430 households, out of which 38.40% had children under the age of 18 living with them, 68.50% were married couples living together, 4.50% had a female householder with no husband present, and 23.60% were non-families. 22.50% of all households were made up of individuals, and 11.90% had someone living alone who was 65 years of age or older. The average household size was 2.85 and the average family size was 3.35.
In the county, the population was spread out, with 32.00% under the age of 18, 7.70% from 18 to 24, 23.10% from 25 to 44, 21.40% from 45 to 64, and 15.90% who were 65 years of age or older. The median age was 36 years. For every 100 females there were 103.10 males. For every 100 females age 18 and over, there were 100.40 males.
The median income for a household in the county was $34,309, and the median income for a family was $38,341. Males had a median income of $29,730 versus $19,808 for females. The per capita income for the county was $13,829. About 6.70% of families and 10.80% of the population were below the poverty line, including 13.00% of those under age 18 and 10.80% of those age 65 or over.
2010 census
As of the 2010 United States Census, there were 4,286 people, 1,545 households, and 1,161 families living in the county.[16] The population density was 3.6 inhabitants per square mile (1.4/km2). There were 1,906 housing units at an average density of 1.6 per square mile (0.62/km2).[17] The racial makeup of the county was 96.7% white, 0.5% Asian, 0.5% American Indian, 0.2% black or African American, 1.1% from other races, and 1.0% from two or more races. Those of Hispanic or Latino origin made up 2.9% of the population.[16] In terms of ancestry, 38.3% were English, 15.1% were Welsh, 12.8% were "American", 10.7% were German, 5.8% were Swedish, and 5.1% were Danish.[18]
Of the 1,545 households, 36.4% had children under the age of 18 living with them, 65.9% were married couples living together, 6.1% had a female householder with no husband present, 24.9% were non-families, and 22.5% of all households were made up of individuals. The average household size was 2.74 and the average family size was 3.24. The median age was 39.1 years.[16]
The median income for a household in the county was $44,599 and the median income for a family was $51,371. Males had a median income of $43,362 versus $24,821 for females. The per capita income for the county was $17,950. About 11.9% of families and 13.4% of the population were below the poverty line, including 14.2% of those under age 18 and 13.0% of those age 65 or over.[19]
Arts and culture
Museums and other points of interest
Oneida County contains seven buildings listed on the National Register of Historic Places:
- The Co-Op Block and J. N. Ireland Bank, in Malad City
- The D.L. Evans, Sr. Bungalow, in Malad City
- The Jedd Jones House, in Malad City
- The Malad Second Ward Tabernacle, in Malad City
- The Oneida County Courthouse, in Malad City
- The Samaria Historic District, in Samaria
- The United Presbyterian Church, in Malad City
Notable people
- John V. Evans (1925–2014), Governor of Idaho (1977–87); born in Malad City
- William Marion Jardine (1879–1955), U.S. Secretary of Agriculture (1925–29) and the U.S. Ambassador to Egypt; born in Oneida County.[20]
Communities
City
Unincorporated communities
Politics
Like all of archconservative, Mormon southeastern Idaho, Oneida County is overwhelmingly Republican. The last Democratic presidential candidate to carry the county was Harry S. Truman in 1948, and Jimmy Carter in 1976 was the last Democrat to crack thirty percent in the county.
| Year | Republican | Democratic | Third parties |
|---|---|---|---|
| 2016 | 74.0% 1,531 | 8.9% 184 | 17.1% 353 |
| 2012 | 88.0% 1,838 | 10.4% 217 | 1.6% 34 |
| 2008 | 79.7% 1,724 | 17.6% 381 | 2.6% 57 |
| 2004 | 83.9% 1,789 | 14.3% 304 | 1.9% 40 |
| 2000 | 79.3% 1,426 | 17.1% 307 | 3.6% 65 |
| 1996 | 57.5% 993 | 24.9% 429 | 17.6% 304 |
| 1992 | 38.2% 713 | 18.8% 351 | 43.0% 802[lower-alpha 1] |
| 1988 | 70.1% 1,269 | 28.1% 508 | 1.8% 33 |
| 1984 | 80.5% 1,528 | 19.0% 360 | 0.5% 10 |
| 1980 | 74.2% 1,461 | 22.0% 434 | 3.8% 75 |
| 1976 | 61.1% 1,065 | 36.6% 637 | 2.3% 40 |
| 1972 | 71.5% 1,204 | 23.9% 402 | 4.7% 79 |
| 1968 | 66.2% 1,114 | 27.6% 465 | 6.2% 105 |
| 1964 | 59.1% 1,111 | 40.9% 768 | |
| 1960 | 58.2% 1,111 | 41.8% 799 | |
| 1956 | 64.2% 1,324 | 35.8% 738 | |
| 1952 | 67.6% 1,547 | 32.3% 739 | 0.0% 1 |
| 1948 | 48.5% 962 | 50.9% 1,008 | 0.6% 12 |
| 1944 | 43.2% 935 | 56.7% 1,227 | 0.1% 1 |
| 1940 | 44.1% 1,140 | 55.7% 1,440 | 0.2% 4 |
| 1936 | 36.2% 955 | 63.4% 1,673 | 0.4% 10 |
| 1932 | 41.7% 1,047 | 57.6% 1,449 | 0.7% 18 |
| 1928 | 53.6% 1,184 | 46.1% 1,020 | 0.3% 7 |
| 1924 | 42.8% 956 | 23.7% 530 | 33.5% 747 |
| 1920 | 66.6% 1,500 | 33.4% 752 | |
| 1916 | 43.3% 1,014 | 55.4% 1,298 | 1.3% 31 |
| 1912 | 60.4% 2,373 | 35.3% 1,386 | 4.3% 169 |
| 1908 | 61.5% 2,595 | 35.9% 1,512 | 2.6% 110 |
| 1904 | 74.3% 2,839 | 23.7% 906 | 2.0% 75 |
| 1900 | 60.8% 1,891 | 39.3% 1,222 |
Notes
- The leading candidate, Independent Ross Perot, received 590 votes while Independent James Gritz received 210 votes, Libertarian Andre Marrou and Independent Lenora Fulani each received 1 vote.
References
- "State & County QuickFacts". United States Census Bureau. Archived from the original on July 17, 2011. Retrieved July 1, 2014.
- "Find a County". National Association of Counties. Retrieved June 7, 2011.
- Idaho.gov – Oneida County Archived August 15, 2009, at the Wayback Machine accessed May 29, 2009
- "An Act Creating the County of Oneida", Session Laws of Idaho Territory: 1863–1864, p. 625
- Ninth Census--Volume I (PDF). Washington: Government Printing Office. 1872. pp. 23, 275–276. Retrieved June 30, 2017.
- "The Southern Boundary of Idaho". Idaho Museum of Natural History. Retrieved June 30, 2017.
- 1880 Census, v.1-08 p. 56
- Idaho Atlas of Historical County Boundaries. Chicago: The Newberry Library. 2010. pp. 13, 162–172.
- "US Gazetteer files: 2010, 2000, and 1990". United States Census Bureau. February 12, 2011. Retrieved April 23, 2011.
- "U.S. Decennial Census". United States Census Bureau. Retrieved July 1, 2014.
- "Historical Census Browser". University of Virginia Library. Retrieved July 1, 2014.
- "Population of Counties by Decennial Census: 1900 to 1990". United States Census Bureau. Retrieved July 1, 2014.
- "Census 2000 PHC-T-4. Ranking Tables for Counties: 1990 and 2000" (PDF). United States Census Bureau. Retrieved July 1, 2014.
- "QuickFacts. Idaho counties". Retrieved May 17, 2020.
- "U.S. Census website". United States Census Bureau. Retrieved January 31, 2008.
- "DP-1 Profile of General Population and Housing Characteristics: 2010 Demographic Profile Data". United States Census Bureau. Archived from the original on February 13, 2020. Retrieved January 9, 2016.
- "Population, Housing Units, Area, and Density: 2010 – County". United States Census Bureau. Archived from the original on February 13, 2020. Retrieved January 9, 2016.
- "DP02 SELECTED SOCIAL CHARACTERISTICS IN THE UNITED STATES – 2006–2010 American Community Survey 5-Year Estimates". United States Census Bureau. Archived from the original on February 13, 2020. Retrieved January 9, 2016.
- "DP03 SELECTED ECONOMIC CHARACTERISTICS – 2006–2010 American Community Survey 5-Year Estimates". United States Census Bureau. Archived from the original on February 13, 2020. Retrieved January 9, 2016.
- "William Marion Jardine". NNDB. Retrieved September 25, 2012.
- Leip, David. "Dave Leip's Atlas of U.S. Presidential Elections". uselectionatlas.org. Retrieved April 4, 2018.
External links
- Official website
- County Parcel Map
- State of Idaho official site – Oneida County
- City-Data.com Comprehensive Statistical Data and more about Oneida County
Places adjacent to Oneida County, Idaho | |
|---|---|
Municipalities and communities of Oneida County, Idaho, United States | ||
|---|---|---|
| City | Map of Idaho highlighting Oneida County | |
| Unincorporated communities | ||
| Ghost town | ||
| ||
Boise (capital) | ||
| Topics |
| |
| Society | ||
| Regions | ||
| Larger cities | ||
| Smaller cities | ||
| Counties |
| |
| Authority control |
|---|