2016 United States presidential election in Idaho
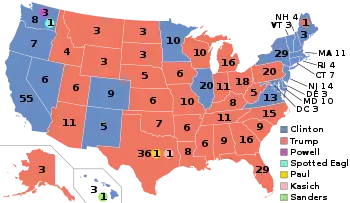
The 2016 United States presidential election in Idaho was held on Tuesday, November 8, 2016, as part of the 2016 United States presidential election in which all 50 states plus the District of Columbia participated. Idaho voters chose electors to represent them in the Electoral College via a popular vote, pitting the Republican Party's nominee, businessman Donald Trump, and running mate Indiana Governor Mike Pence against Democratic Party nominee, former Secretary of State Hillary Clinton, and her running mate Virginia Senator Tim Kaine. Idaho has four electoral votes in the Electoral College.[2]
| |||||||||||||||||||||||||||||||||
| Turnout | 75.87% | ||||||||||||||||||||||||||||||||
|---|---|---|---|---|---|---|---|---|---|---|---|---|---|---|---|---|---|---|---|---|---|---|---|---|---|---|---|---|---|---|---|---|---|
| |||||||||||||||||||||||||||||||||
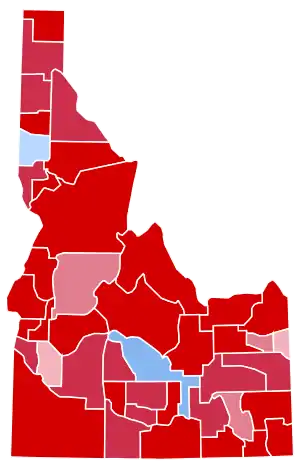 County Results
| |||||||||||||||||||||||||||||||||
| |||||||||||||||||||||||||||||||||
| Elections in Idaho |
|---|
 |
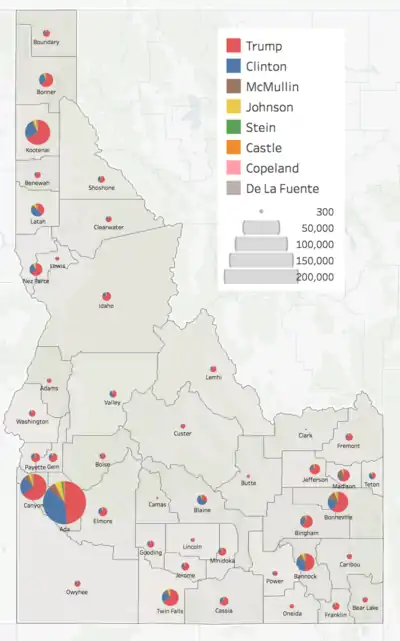
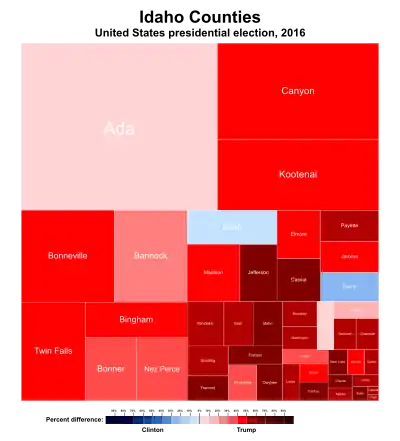
Trump carried the state with 59.25% of the vote, while Clinton received 27.48%. Third party candidate Evan McMullin carried 6.75% of the popular vote, making Idaho his second-strongest state, only after neighboring Utah.[3]
Primary elections
Republican primary
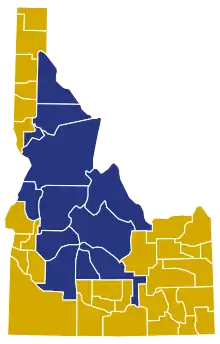
With only a thousand dollar filing fee, thirteen candidates appear on the Republican presidential primary ballot:[4]
| Idaho Republican primary, March 8, 2016 | |||||
|---|---|---|---|---|---|
| Candidate | Votes | Percentage | Actual delegate count | ||
| Bound | Unbound | Total | |||
| Ted Cruz | 100,889 | 45.44% | 20 | 0 | 20 |
| Donald Trump | 62,413 | 28.11% | 12 | 0 | 12 |
| Marco Rubio | 35,290 | 15.90% | 0 | 0 | 0 |
| John Kasich | 16,514 | 7.44% | 0 | 0 | 0 |
| Ben Carson (withdrawn) | 3,853 | 1.74% | 0 | 0 | 0 |
| Jeb Bush (withdrawn) | 939 | 0.42% | 0 | 0 | 0 |
| Rand Paul (withdrawn) | 834 | 0.38% | 0 | 0 | 0 |
| Mike Huckabee (withdrawn) | 358 | 0.16% | 0 | 0 | 0 |
| Chris Christie (withdrawn) | 353 | 0.16% | 0 | 0 | 0 |
| Carly Fiorina (withdrawn) | 242 | 0.11% | 0 | 0 | 0 |
| Rick Santorum (withdrawn) | 211 | 0.10% | 0 | 0 | 0 |
| Lindsey Graham (withdrawn) | 80 | 0.04% | 0 | 0 | 0 |
| Peter Messina (withdrawn) | 28 | 0.01% | 0 | 0 | 0 |
| Unprojected delegates: | 0 | 0 | 0 | ||
| Total: | 222,004 | 100.00% | 32 | 0 | 32 |
| Source: The Green Papers | |||||
Democratic caucuses
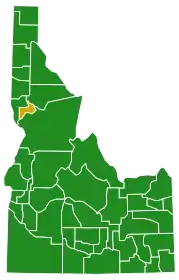
| Candidate | Popular vote | Estimated delegates | |||
|---|---|---|---|---|---|
| Count | Percentage | Pledged | Unpledged | Total | |
| Bernie Sanders | 18,640 | 78.04% | 18 | 2 | 20 |
| Hillary Clinton | 5,065 | 21.21% | 5 | 1 | 6 |
| Rocky De La Fuente | 4 | 0.02% | |||
| Uncommitted | 175 | 0.73% | 1 | 1 | |
| Total | 23,884 | 100% | 23 | 4 | 27 |
| Source: The Green Papers Idaho Democratic Party - Official Delegation for Pledged Delegates | |||||
Constitution primary
The Constitution Party of Idaho held its primary on March 8.
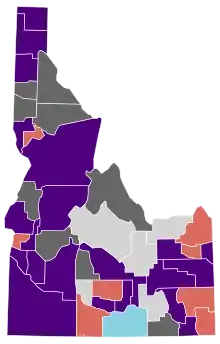
| Idaho Constitution Party presidential primary, 2016[5][6][7] | |||
|---|---|---|---|
| Candidate | Popular vote | Pledged delegates | |
| Count | Percentage | ||
| 250 | 51.7% | 8 | |
| J.R. Myers | 139 | 28.7% | 0 |
| Patrick Anthony Ockander | 95 | 19.6% | 0 |
| Total: | 484 | 100% | 8 |
| Key: | Withdrew prior to contest |
Polling
General election
Predictions
| Source | Ranking | As of |
|---|---|---|
| Los Angeles Times[8] | Safe R | November 6, 2016 |
| CNN[9] | Safe R | November 4, 2016 |
| Cook Political Report[10] | Safe R | November 7, 2016 |
| Electoral-vote.com[11] | Safe R | November 8, 2016 |
| Sabato's Crystal Ball[12] | Safe R | November 7, 2016 |
| Fox News[13] | Safe R | November 7, 2016 |
Results
| Party | Candidate | Popular vote | Percentage | ||
|---|---|---|---|---|---|
| Republican | Donald Trump | 409,055 | 59.25% | ||
| Democratic | Hillary Clinton | 189,765 | 27.48% | ||
| Independent | Evan McMullin | 46,476 | 6.73% | ||
| Libertarian | Gary Johnson | 28,331 | 4.10% | ||
| Green | Jill Stein | 8,496 | 1.23% | ||
| National Constitution | Darrell L. Castle | 4,403 | 0.64% | ||
| Constitution | Scott Copeland | 2,356 | 0.34% | ||
| Reform | Roque De La Fuente | 1,373 | 0.20% | ||
| Other/Write-in | 178 | 0.03% | |||
| Total | 690,433 | 100.00% | |||
| Source: Idaho Secretary of State Election Division New York Times | |||||
Results breakdown
By county
| County | Trump | Votes | Clinton | Votes | Stein | Votes | Johnson | Votes | McMullin | Votes | Other | Votes |
|---|---|---|---|---|---|---|---|---|---|---|---|---|
| Ada | 47.91% | 93,752 | 38.68% | 75,677 | 1.60% | 3,138 | 5.10% | 9,984 | 5.74% | 11,226 | 0.97% | 1,892 |
| Adams | 71.28% | 1,556 | 19.01% | 415 | 0.87% | 19 | 3.80% | 83 | 3.66% | 80 | 1.37% | 30 |
| Bannock | 51.41% | 17,180 | 30.95% | 10,342 | 1.55% | 518 | 4.40% | 1,471 | 10.32% | 3,449 | 1.36% | 456 |
| Bear Lake | 75.24% | 2,203 | 8.71% | 255 | 0.38% | 11 | 1.84% | 54 | 12.50% | 366 | 1.33% | 39 |
| Benewah | 74.15 | 3,103 | 18.40% | 770 | 1.00% | 42 | 3.61% | 151 | 1.46% | 61 | 1.39% | 58 |
| Bingham | 65.61 | 10,907 | 17.59% | 2,924 | 0.75% | 124 | 2.51% | 417 | 12.04% | 2,002 | 1.51% | 241 |
| Blaine | 31.15% | 3,340 | 59.83% | 6,416 | 1.64% | 176 | 3.95% | 424 | 2.69% | 289 | 0.74% | 79 |
| Boise | 70.08 | 2,673 | 20.37% | 777 | 0.92% | 35 | 4.54% | 173 | 2.94% | 112 | 1.16% | 44 |
| Bonner | 63.71 | 13,343 | 27.78% | 5,819 | 1.89% | 396 | 3.64% | 762 | 1.78% | 372 | 1.19% | 251 |
| Bonneville | 60.38% | 26,699 | 20.19% | 8,930 | 0.90% | 399 | 3.70% | 1,634 | 13.62% | 6,022 | 1.22% | 437 |
| Boundary | 73.39% | 3,789 | 18.07% | 933 | 1.55% | 80 | 3.12% | 161 | 2.52% | 130 | 1.35% | 70 |
| Butte | 74.31% | 914 | 13.01% | 160 | 0.57% | 7 | 2.03% | 25 | 9.27% | 114 | 0.82% | 10 |
| Camas | 69.49% | 410 | 18.64% | 110 | 1.02% | 6 | 3.90% | 23 | 5.59% | 33 | 1.36% | 8 |
| Canyon | 64.88% | 47,222 | 23.20% | 16,883 | 1.10% | 797 | 3.82% | 2,778 | 5.79% | 4,216 | 1.17% | 889 |
| Caribou | 74.96% | 2,275 | 8.93% | 271 | 0.49% | 14 | 2.11% | 64 | 12.26% | 372 | 1.25% | 38 |
| Cassia | 72.74% | 5,949 | 12.67% | 1,036 | 0.45% | 37 | 2.47% | 202 | 10.43% | 853 | 1.23% | 101 |
| Clark | 71.73% | 203 | 15.55% | 44 | 0.35% | 1 | 1.41% | 4 | 8.13% | 23 | 2.82% | 8 |
| Clearwater | 75.03% | 2,852 | 18.52% | 704 | 1.00% | 38 | 2.55% | 97 | 1.89% | 72 | 1.00% | 38 |
| Custer | 73.61% | 1,777 | 17.69% | 427 | 1.24% | 30 | 2.78% | 67 | 3.40% | 82 | 1.28% | 31 |
| Elmore | 68.25% | 5,816 | 21.29% | 1,814 | 0.90% | 77 | 3.90% | 332 | 4.41% | 376 | 1.26% | 107 |
| Franklin | 70.94% | 3,901 | 7.00% | 385 | 0.55% | 30 | 2.13% | 117 | 16.58% | 912 | 2.80% | 154 |
| Fremont | 71.57% | 4,090 | 11.39% | 651 | 0.35% | 20 | 2.22% | 127 | 13.14% | 751 | 1.32% | 76 |
| Gem | 75.18% | 5,980 | 15.45% | 1,229 | 0.72% | 57 | 3.03% | 241 | 4.49% | 357 | 1.14% | 90 |
| Gooding | 72.11% | 3,743 | 17.92% | 930 | 0.58% | 30 | 2.12% | 110 | 5.64% | 293 | 1.64% | 85 |
| Idaho | 78.23% | 6,441 | 14.53% | 1,196 | 0.63% | 52 | 3.09% | 254 | 2.00% | 165 | 1.52% | 125 |
| Jefferson | 73.52% | 8,436 | 8.51% | 976 | 0.48% | 55 | 2.39% | 274 | 13.59% | 1,560 | 1.52% | 174 |
| Jerome | 68.79% | 4,644 | 19.69% | 1,329 | 0.77% | 52 | 3.23% | 218 | 6.21% | 419 | 1.32% | 89 |
| Kootenai | 67.03% | 44,449 | 24.53% | 16,264 | 1.12% | 744 | 3.93% | 2,604 | 2.35% | 1,557 | 1.05% | 692 |
| Latah | 39.98% | 7,265 | 44.53% | 8,093 | 2.55% | 463 | 6.59% | 1,197 | 3.83% | 696 | 2.52% | 459 |
| Lemhi | 73.51% | 3,011 | 17.90% | 733 | 0.76% | 31 | 3.37% | 138 | 3.39% | 139 | 1.07% | 44 |
| Lewis | 75.60% | 1,202 | 16.98% | 270 | 0.82% | 13 | 3.90% | 62 | 1.07% | 17 | 1.64% | 26 |
| Lincoln | 67.73% | 1,184 | 20.59% | 360 | 1.03% | 18 | 3.09% | 54 | 5.84% | 102 | 1.71% | 30 |
| Madison | 56.99% | 8,941 | 7.66% | 1,201 | 0.44% | 69 | 3.90% | 612 | 29.76% | 4,669 | 1.25% | 196 |
| Minidoka | 71.13% | 4,887 | 16.98% | 1,167 | 0.6% | 41 | 3.01% | 207 | 6.74% | 463 | 1.52% | 106 |
| Nez Perce | 62.20% | 10,699 | 28.07% | 4,828 | 1.18% | 203 | 5.11% | 879 | 2.05% | 352 | 1.39% | 240 |
| Oneida | 74.03% | 1,531 | 8.90% | 184 | 0.00% | 0 | 1.79% | 37 | 13.10% | 271 | 2.17% | 45 |
| Owyhee | 77.76% | 3,052 | 15.06% | 591 | 0.66% | 26 | 2.75% | 108 | 2.75% | 108 | 1.02% | 40 |
| Payette | 74.55% | 6,489 | 17.31% | 1,507 | 0.68% | 59 | 2.84% | 247 | 3.61% | 314 | 1.01% | 88 |
| Power | 60.41% | 1,666 | 25.34% | 699 | 0.94% | 26 | 3.34% | 92 | 8.45% | 233 | 1.53% | 42 |
| Shoshone | 64.39% | 3,297 | 27.03% | 1,384 | 1.05% | 54 | 4.28% | 219 | 1.70% | 87 | 1.54% | 79 |
| Teton | 43.55% | 2,167 | 43.39% | 2,159 | 1.99% | 99 | 3.70% | 184 | 6.57% | 327 | 0.80% | 40 |
| Twin Falls | 66.37% | 19,828 | 20.86% | 6,233 | 1.09% | 326 | 3.60% | 1,076 | 6.91% | 2,065 | 1.16% | 346 |
| Valley | 54.33% | 2,906 | 35.76% | 1,913 | 0.99% | 53 | 4.30% | 230 | 3.63% | 194 | 0.99% | 53 |
| Washington | 73.69% | 3,283 | 17.42% | 776 | 0.58% | 26 | 3.10% | 138 | 3.93% | 175 | 1.27% | 57 |
See also
| Elections in Idaho |
|---|
 |
References
- Secretary of State: Lawerence Denney. "Nov 08, 2016 General Election Results". www.sos.idaho.gov. Retrieved 2020-05-16.
- "Distribution of Electoral Votes". National Archives and Records Administration. Retrieved November 25, 2020.
- "2016 Presidential Election Statistics". Dave Leip’s Atlas of U.S. Presidential Elections. Retrieved 2018-03-05.
- "News". Idgop.org. Retrieved 2016-03-11.
- "Mar 08, 2016 Presidential Primary Election Results United States - by County". sos.idaho.gov. Idaho Secretary Of State. Retrieved 2016-11-25.
- Gr, The; Inquirer (2016-03-10). "Scott Copeland wins Idaho Constitution Party primary". The Grand Inquirer. Archived from the original on 2016-11-26. Retrieved 2016-11-26.
- Gr, The; Inquirer (2016-03-02). "Patrick Ockander drops out of Constitution Party presidential race, endorses J.R. Myers and Ted Cruz". The Grand Inquirer. Archived from the original on 2016-11-26. Retrieved 2016-11-26.
- "Our final map has Clinton winning with 352 electoral votes. Compare your picks with ours". Los Angeles Times. 2016-11-06. Retrieved 2016-11-13.
- Chalian, David (November 4, 2016). "Road to 270: CNN's new election map". CNN. Retrieved March 3, 2019.
- "2016 Electoral Scorecard". The Cook Political Report. November 7, 2016. Retrieved March 3, 2019.
- "2016 Electoral Map Prediction". Electoral-vote.com. November 8, 2016. Retrieved March 3, 2019.
- Sabato, Larry J. (November 7, 2016). "2016 President". University of Virginia Center for Politics. Retrieved March 3, 2019.
- "Electoral Scorecard: Map shifts again in Trump's favor, as Clinton holds edge". Fox News. 2016-11-07. Retrieved 2016-11-13.
.jpg.webp)

