Power County, Idaho
Power County is a county located in the U.S. state of Idaho. As of the 2010 Census, the county had a population of 7,817.[1] The county seat and largest city is American Falls.[2] The county was created by the Idaho Legislature on January 30, 1913, by a partition of Cassia County. It is named for an early hydroelectric power plant (1902) at the American Falls.[3]
Power County | |
|---|---|
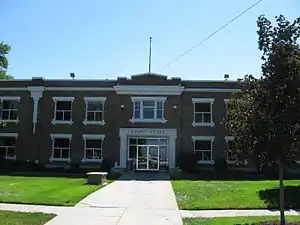 Power County Courthouse, American Falls | |
 Seal | |
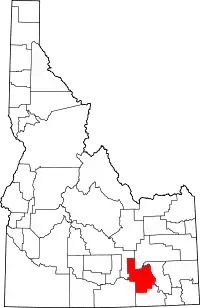 Location within the U.S. state of Idaho | |
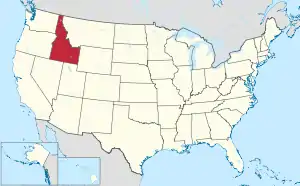 Idaho's location within the U.S. | |
| Coordinates: 42°41′N 112°50′W | |
| Country | |
| State | |
| Founded | January 30, 1913 |
| Named for | power plant at the American Falls Dam |
| Seat | American Falls |
| Largest city | American Falls |
| Area | |
| • Total | 1,443 sq mi (3,740 km2) |
| • Land | 1,404 sq mi (3,640 km2) |
| • Water | 38 sq mi (100 km2) 2.7% |
| Population (2010) | |
| • Total | 7,817 |
| • Estimate (2018) | 7,768 |
| • Density | 5.4/sq mi (2.1/km2) |
| Time zone | UTC−7 (Mountain) |
| • Summer (DST) | UTC−6 (MDT) |
| Congressional district | 2nd |
| Website | www |
Geography
According to the U.S. Census Bureau, the county has a total area of 1,443 square miles (3,740 km2), of which 1,404 square miles (3,640 km2) is land and 38 square miles (98 km2) (2.7%) is water.[4]
Adjacent counties
- Bannock County – east
- Oneida County – south
- Bingham County – north
- Blaine County – northwest
- Cassia County – southwest
National protected areas
- Caribou National Forest (part)
- Craters of the Moon National Monument and Preserve (part)
- Curlew National Grassland (part)
- Minidoka National Wildlife Refuge (part)
- Sawtooth National Forest (part)
Government
Power County's commissioners are:[5]
- Ronald Funk (Chairman, District 1)
- William Lasley (District 2)
- Delane Anderson (District 3)
| Year | Republican | Democratic | Third parties |
|---|---|---|---|
| 2020 | 68.6% 2,116 | 28.0% 865 | 3.4% 105 |
| 2016 | 60.4% 1,666 | 25.3% 699 | 14.3% 393 |
| 2012 | 64.4% 1,870 | 33.8% 982 | 1.8% 52 |
| 2008 | 61.7% 1,754 | 36.1% 1,027 | 2.2% 61 |
| 2004 | 71.2% 2,105 | 28.0% 829 | 0.8% 24 |
| 2000 | 69.1% 1,872 | 27.9% 755 | 3.0% 82 |
| 1996 | 51.1% 1,501 | 36.4% 1,070 | 12.4% 365 |
| 1992 | 45.4% 1,352 | 28.1% 837 | 26.5% 788 |
| 1988 | 61.7% 1,838 | 36.7% 1,095 | 1.6% 48 |
| 1984 | 76.5% 2,298 | 22.6% 678 | 0.9% 28 |
| 1980 | 71.1% 2,235 | 23.1% 727 | 5.8% 181 |
| 1976 | 50.0% 1,374 | 46.8% 1,286 | 3.3% 90 |
| 1972 | 64.5% 1,405 | 28.7% 625 | 6.9% 150 |
| 1968 | 60.3% 1,222 | 28.7% 582 | 11.1% 224 |
| 1964 | 45.4% 966 | 54.6% 1,161 | |
| 1960 | 52.6% 1,065 | 47.4% 960 | |
| 1956 | 59.0% 1,108 | 41.0% 769 | |
| 1952 | 68.5% 1,308 | 31.6% 603 | |
| 1948 | 52.1% 875 | 47.3% 795 | 0.7% 11 |
| 1944 | 52.8% 895 | 47.2% 801 | |
| 1940 | 50.5% 951 | 49.4% 931 | 0.2% 3 |
| 1936 | 39.1% 708 | 59.3% 1,075 | 1.6% 29 |
| 1932 | 34.7% 603 | 64.9% 1,126 | 0.4% 7 |
| 1928 | 56.5% 852 | 43.3% 653 | 0.2% 3 |
| 1924 | 43.1% 757 | 17.9% 314 | 39.0% 684 |
| 1920 | 67.3% 1,155 | 32.7% 561 | |
| 1916 | 47.4% 1,024 | 50.0% 1,079 | 2.6% 57 |
Demographics
| Historical population | |||
|---|---|---|---|
| Census | Pop. | %± | |
| 1920 | 5,105 | — | |
| 1930 | 4,457 | −12.7% | |
| 1940 | 3,965 | −11.0% | |
| 1950 | 3,988 | 0.6% | |
| 1960 | 4,111 | 3.1% | |
| 1970 | 4,864 | 18.3% | |
| 1980 | 6,844 | 40.7% | |
| 1990 | 7,086 | 3.5% | |
| 2000 | 7,538 | 6.4% | |
| 2010 | 7,817 | 3.7% | |
| 2018 (est.) | 7,768 | [7] | −0.6% |
| U.S. Decennial Census[8] 1790-1960[9] 1900-1990[10] 1990-2000[11] 2010-2018[1] | |||
2000 census
As of the census[12] of 2000, there were 7,538 people, 2,560 households, and 1,968 families living in the county. The population density was 5 people per square mile (2/km2). There were 2,844 housing units at an average density of 2 per square mile (1/km2). The racial makeup of the county was 83.78% White, 0.09% Black or African American, 3.29% Native American, 0.32% Asian, 0.04% Pacific Islander, 11.10% from other races, and 1.38% from two or more races. 21.73% of the population were Hispanic or Latino of any race. 18.0% were of German, 17.6% English and 10.9% American ancestry.
There were 2,560 households, out of which 40.90% had children under the age of 18 living with them, 63.40% were married couples living together, 8.80% had a female householder with no husband present, and 23.10% were non-families. 20.30% of all households were made up of individuals, and 8.80% had someone living alone who was 65 years of age or older. The average household size was 2.92 and the average family size was 3.38.
In the county, the population was spread out, with 33.80% under the age of 18, 8.40% from 18 to 24, 25.40% from 25 to 44, 22.00% from 45 to 64, and 10.40% who were 65 years of age or older. The median age was 32 years. For every 100 females, there were 101.00 males. For every 100 females age 18 and over, there were 99.90 males.
The median income for a household in the county was $32,226, and the median income for a family was $36,685. Males had a median income of $29,676 versus $20,930 for females. The per capita income for the county was $14,007. About 10.80% of families and 16.10% of the population were below the poverty line, including 20.10% of those under age 18 and 12.70% of those age 65 or over.
2010 census
As of the 2010 United States Census, there were 7,817 people, 2,641 households, and 2,019 families living in the county.[13] The population density was 5.6 inhabitants per square mile (2.2/km2). There were 2,944 housing units at an average density of 2.1 per square mile (0.81/km2).[14] The racial makeup of the county was 75.1% white, 2.3% American Indian, 0.4% Asian, 0.3% black or African American, 0.1% Pacific islander, 19.5% from other races, and 2.4% from two or more races. Those of Hispanic or Latino origin made up 29.8% of the population.[13] In terms of ancestry, 16.7% were German, 16.7% were English, and 7.2% were American.[15]
Of the 2,641 households, 40.7% had children under the age of 18 living with them, 60.6% were married couples living together, 10.1% had a female householder with no husband present, 23.6% were non-families, and 19.8% of all households were made up of individuals. The average household size was 2.94 and the average family size was 3.39. The median age was 33.2 years.[13]
The median income for a household in the county was $40,843 and the median income for a family was $46,391. Males had a median income of $35,674 versus $29,844 for females. The per capita income for the county was $18,412. About 8.3% of families and 11.1% of the population were below the poverty line, including 13.7% of those under age 18 and 12.3% of those age 65 or over.[16]
References
- "State & County QuickFacts". United States Census Bureau. Archived from the original on December 22, 2015. Retrieved July 1, 2014.
- "Find a County". National Association of Counties. Retrieved June 7, 2011.
- Idaho.gov - Power County Archived August 15, 2009, at the Wayback Machine accessed May 28, 2009
- "US Gazetteer files: 2010, 2000, and 1990". United States Census Bureau. February 12, 2011. Retrieved April 23, 2011.
- "Commissioners - Power County, Idaho". Retrieved November 12, 2020.
- Leip, David. "Dave Leip's Atlas of U.S. Presidential Elections". uselectionatlas.org. Retrieved April 4, 2018.
- "Population and Housing Unit Estimates". Retrieved September 7, 2019.
- "U.S. Decennial Census". United States Census Bureau. Retrieved July 1, 2014.
- "Historical Census Browser". University of Virginia Library. Retrieved July 1, 2014.
- "Population of Counties by Decennial Census: 1900 to 1990". United States Census Bureau. Retrieved July 1, 2014.
- "Census 2000 PHC-T-4. Ranking Tables for Counties: 1990 and 2000" (PDF). United States Census Bureau. Retrieved July 1, 2014.
- "U.S. Census website". United States Census Bureau. Retrieved January 31, 2008.
- "DP-1 Profile of General Population and Housing Characteristics: 2010 Demographic Profile Data". United States Census Bureau. Archived from the original on February 13, 2020. Retrieved January 9, 2016.
- "Population, Housing Units, Area, and Density: 2010 - County". United States Census Bureau. Archived from the original on February 13, 2020. Retrieved January 9, 2016.
- "DP02 SELECTED SOCIAL CHARACTERISTICS IN THE UNITED STATES – 2006-2010 American Community Survey 5-Year Estimates". United States Census Bureau. Archived from the original on February 13, 2020. Retrieved January 9, 2016.
- "DP03 SELECTED ECONOMIC CHARACTERISTICS – 2006-2010 American Community Survey 5-Year Estimates". United States Census Bureau. Archived from the original on February 13, 2020. Retrieved January 9, 2016.
External links
Places adjacent to Power County, Idaho | ||||||||||
|---|---|---|---|---|---|---|---|---|---|---|
| ||||||||||
Municipalities and communities of Power County, Idaho, United States | ||
|---|---|---|
| Cities | Map of Idaho highlighting Power County | |
| CDP | ||
| Unincorporated communities | ||
| Indian reservation | ||
| Footnotes | ‡This populated place also has portions in an adjacent county or counties | |
| ||
Boise (capital) | ||
| Topics |
| |
| Society | ||
| Regions | ||
| Larger cities | ||
| Smaller cities | ||
| Counties |
| |
| Authority control |
|---|