Twin Falls County, Idaho
Twin Falls County is a county in the south central part of the U.S. state of Idaho. As of the 2010 Census, the county had a population of 77,230, making it the sixth most populous county in Idaho.[1] The county seat and largest city is Twin Falls.[2]
Twin Falls County | |
|---|---|
 | |
 Seal | |
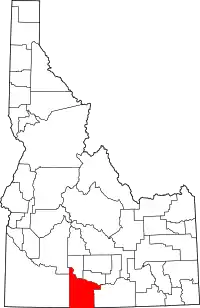 Location within the U.S. state of Idaho | |
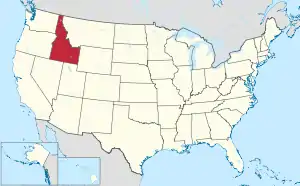 Idaho's location within the U.S. | |
| Coordinates: 42°21′N 114°40′W | |
| Country | |
| State | |
| Founded | February 21, 1907 |
| Named for | Snake River waterfall |
| Seat | Twin Falls |
| Largest city | Twin Falls |
| Area | |
| • Total | 1,928 sq mi (4,990 km2) |
| • Land | 1,921 sq mi (4,980 km2) |
| • Water | 7.1 sq mi (18 km2) 0.4% |
| Population (2010) | |
| • Total | 77,230 |
| • Estimate (2018) | 86,081 |
| • Density | 40/sq mi (15/km2) |
| Time zone | UTC−7 (Mountain) |
| • Summer (DST) | UTC−6 (MDT) |
| Congressional district | 2nd |
| Website | www |
Twin Falls County is part of the Twin Falls, ID Twin Falls Metropolitan Statistical Area.
Prior to the 1860s, the Twin Falls County area was an unorganized part of Shoshone lands, then as part of the Oregon Country. The area was first organized as part of the original Owyhee County in 1864 as part of Idaho Territory. In 1879 it was partitioned away from Owyhee County to form part of Cassia County. The county is named for a split waterfall on the Snake River of the same name. The Snake River is the county's northern boundary.
Even after Idaho became a state in 1890, the Twin Falls area was very sparsely populated and without significant settlements. That changed after the city of Twin Falls was founded in 1904,[3] and Milner Dam was completed in 1905. Most of the county's other towns were established during this period as well. In response to local government needs for these new communities, which were as much as 80 miles (130 km) away from Cassia County's seat at Albion, Twin Falls County was created by the Idaho Legislature on February 21, 1907.[4]
Geography
According to the U.S. Census Bureau, the county has a total area of 1,928 square miles (4,990 km2), of which 1,921 square miles (4,980 km2) is land and 7.1 square miles (18 km2) (0.4%) is water.[5]
Adjacent counties
- Gooding County - north
- Jerome County - northeast
- Cassia County - east
- Elko County, Nevada - south/Pacific Time Border
- Owyhee County - west
- Elmore County - northwest
National protected areas
Demographics
| Historical population | |||
|---|---|---|---|
| Census | Pop. | %± | |
| 1910 | 13,543 | — | |
| 1920 | 28,398 | 109.7% | |
| 1930 | 29,828 | 5.0% | |
| 1940 | 36,403 | 22.0% | |
| 1950 | 40,979 | 12.6% | |
| 1960 | 41,842 | 2.1% | |
| 1970 | 41,807 | −0.1% | |
| 1980 | 52,927 | 26.6% | |
| 1990 | 53,580 | 1.2% | |
| 2000 | 64,284 | 20.0% | |
| 2010 | 77,230 | 20.1% | |
| 2018 (est.) | 86,081 | [6] | 11.5% |
| U.S. Decennial Census[7] 1790-1960[8] 1900-1990[9] 1990-2000[10] 2010-2018[1] | |||
2000 census
As of the census[11] of 2000, there were 64,284 people, 23,853 households, and 16,959 families living in the county. The population density was 33 people per square mile (13/km2). There were 25,595 housing units at an average density of 13 per square mile (5/km2). The racial makeup of the county was 92.47% White, 0.19% Black or African American, 0.71% Native American, 0.76% Asian, 0.08% Pacific Islander, 3.77% from other races, and 2.02% from two or more races. 9.37% of the population were Hispanic or Latino of any race. 17.9% were of German, 17.7% English, 10.9% American and 7.3% Irish ancestry.
There were 23,853 households, out of which 34.70% had children under the age of 18 living with them, 58.00% were married couples living together, 9.20% had a female householder with no husband present, and 28.90% were non-families. 23.60% of all households were made up of individuals, and 10.40% had someone living alone who was 65 years of age or older. The average household size was 2.64 and the average family size was 3.13.
In the county, the population was spread out, with 27.90% under the age of 18, 10.40% from 18 to 24, 26.00% from 25 to 44, 21.50% from 45 to 64, and 14.30% who were 65 years of age or older. The median age was 35 years. For every 100 females, there were 96.50 males. For every 100 females age 18 and over, there were 93.70 males.
The median income for a household in the county was $34,506, and the median income for a family was $39,886. Males had a median income of $30,058 versus $20,825 for females. The per capita income for the county was $16,678. About 9.10% of families and 12.70% of the population were below the poverty line, including 16.00% of those under age 18 and 9.30% of those age 65 or over.
2010 census
As of the 2010 United States Census, there were 77,230 people, 28,760 households, and 19,954 families living in the county.[12] The population density was 40.2 inhabitants per square mile (15.5/km2). There were 31,072 housing units at an average density of 16.2 per square mile (6.3/km2).[13] The racial makeup of the county was 88.9% white, 1.2% Asian, 0.8% American Indian, 0.4% black or African American, 0.1% Pacific islander, 6.3% from other races, and 2.3% from two or more races. Those of Hispanic or Latino origin made up 13.7% of the population.[12] In terms of ancestry, 20.2% were German, 14.5% were English, 10.8% were Irish, and 7.0% were American.[14]
Of the 28,760 households, 35.4% had children under the age of 18 living with them, 54.1% were married couples living together, 10.5% had a female householder with no husband present, 30.6% were non-families, and 24.3% of all households were made up of individuals. The average household size was 2.65 and the average family size was 3.16. The median age was 34.4 years.[12]
The median income for a household in the county was $42,455 and the median income for a family was $49,188. Males had a median income of $35,777 versus $26,257 for females. The per capita income for the county was $19,892. About 10.6% of families and 13.0% of the population were below the poverty line, including 16.9% of those under age 18 and 10.7% of those age 65 or over.[15]
Communities
Politics
Twin Falls County leans heavily Republican; it has not voted for a Democratic presidential nominee since 1936, and even in the Democratic landslide of 1964 Barry Goldwater still carried Twin Falls by 20 percentage points.
| Year | Republican | Democratic | Third parties |
|---|---|---|---|
| 2020 | 70.9% 25,897 | 25.7% 9,391 | 3.4% 1,224 |
| 2016 | 66.4% 19,828 | 20.9% 6,233 | 12.8% 3,813 |
| 2012 | 69.7% 19,773 | 26.6% 7,541 | 3.7% 1,055 |
| 2008 | 66.5% 19,032 | 30.1% 8,621 | 3.4% 960 |
| 2004 | 74.4% 19,672 | 24.4% 6,458 | 1.2% 305 |
| 2000 | 70.1% 15,794 | 25.6% 5,777 | 4.3% 959 |
| 1996 | 54.1% 12,393 | 29.8% 6,826 | 16.1% 3,677 |
| 1992 | 44.0% 10,335 | 28.1% 6,593 | 28.0% 6,575 |
| 1988 | 63.9% 13,243 | 34.1% 7,078 | 2.0% 413 |
| 1984 | 78.0% 16,974 | 21.0% 4,567 | 1.1% 230 |
| 1980 | 73.5% 17,425 | 20.4% 4,835 | 6.1% 1,448 |
| 1976 | 65.8% 12,659 | 31.6% 6,085 | 2.5% 489 |
| 1972 | 74.0% 13,075 | 18.9% 3,344 | 7.1% 1,254 |
| 1968 | 62.9% 11,564 | 21.8% 4,001 | 15.3% 2,808 |
| 1964 | 60.1% 11,518 | 39.9% 7,638 | |
| 1960 | 62.2% 12,171 | 37.9% 7,413 | |
| 1956 | 68.1% 12,097 | 31.9% 5,666 | |
| 1952 | 76.1% 14,471 | 23.9% 4,548 | 0.0% 4 |
| 1948 | 55.7% 7,833 | 42.8% 6,019 | 1.5% 209 |
| 1944 | 56.3% 7,946 | 43.4% 6,128 | 0.3% 42 |
| 1940 | 55.2% 9,031 | 44.6% 7,286 | 0.2% 34 |
| 1936 | 38.7% 4,966 | 58.3% 7,476 | 3.0% 386 |
| 1932 | 42.1% 4,928 | 54.6% 6,395 | 3.4% 396 |
| 1928 | 72.7% 6,791 | 26.5% 2,471 | 0.8% 76 |
| 1924 | 51.0% 4,630 | 18.1% 1,641 | 30.9% 2,800 |
| 1920 | 67.2% 5,894 | 32.8% 2,882 | |
| 1916 | 40.0% 3,083 | 51.6% 3,974 | 8.4% 644 |
| 1912 | 20.1% 1,074 | 32.6% 1,741 | 47.4% 2,533[lower-alpha 1] |
| 1908 | 55.6% 1,757 | 33.3% 1,051 | 11.1% 350 |
Notes
- The leading "other" candidate, Progressive Theodore Roosevelt, received 1,650 votes while Socialist Eugene Debs received 781 votes and Prohibition candidate Eugene Chafin received 102 votes.
References
- "State & County QuickFacts". United States Census Bureau. Retrieved July 1, 2018.
- "Find a County". National Association of Counties. Retrieved June 7, 2011.
- Hayes, Anna Hansen (April 19, 1962). "Water turned desert into a Magic Valley". Lewiston Morning Tribune. (Idaho). p. 9, section 2.
- Idaho.gov - Twin Falls County Archived September 25, 2009, at the Wayback Machine accessed May 29, 2009
- "US Gazetteer files: 2010, 2000, and 1990". United States Census Bureau. February 12, 2011. Retrieved April 23, 2011.
- "Population and Housing Unit Estimates". Retrieved July 25, 2019.
- "U.S. Decennial Census". United States Census Bureau. Retrieved July 1, 2014.
- "Historical Census Browser". University of Virginia Library. Retrieved July 1, 2014.
- "Population of Counties by Decennial Census: 1900 to 1990". United States Census Bureau. Retrieved July 1, 2014.
- "Census 2000 PHC-T-4. Ranking Tables for Counties: 1990 and 2000" (PDF). United States Census Bureau. Retrieved July 1, 2014.
- "U.S. Census website". United States Census Bureau. Retrieved January 31, 2008.
- "DP-1 Profile of General Population and Housing Characteristics: 2010 Demographic Profile Data". United States Census Bureau. Archived from the original on February 13, 2020. Retrieved January 9, 2016.
- "Population, Housing Units, Area, and Density: 2010 - County". United States Census Bureau. Archived from the original on February 13, 2020. Retrieved January 9, 2016.
- "DP02 SELECTED SOCIAL CHARACTERISTICS IN THE UNITED STATES – 2006-2010 American Community Survey 5-Year Estimates". United States Census Bureau. Archived from the original on February 13, 2020. Retrieved January 9, 2016.
- "DP03 SELECTED ECONOMIC CHARACTERISTICS – 2006-2010 American Community Survey 5-Year Estimates". United States Census Bureau. Archived from the original on February 13, 2020. Retrieved January 9, 2016.
- Leip, David. "Dave Leip's Atlas of U.S. Presidential Elections". uselectionatlas.org. Retrieved April 4, 2018.
External links
Places adjacent to Twin Falls County, Idaho | ||||||||||
|---|---|---|---|---|---|---|---|---|---|---|
| ||||||||||
Municipalities and communities of Twin Falls County, Idaho, United States | ||
|---|---|---|
| Cities | Map of Idaho highlighting Twin Falls County | |
| Unincorporated community | ||
| ||
Boise (capital) | ||
| Topics |
| |
| Society | ||
| Regions | ||
| Larger cities | ||
| Smaller cities | ||
| Counties |
| |
| Authority control |
|---|