Bear Lake County, Idaho
Bear Lake County is a county in the U.S. state of Idaho. As of the 2010 United States Census the county had a population of 5,986.[1] The county seat is Paris,[2] and Montpelier is the largest city.
Bear Lake County | |
|---|---|
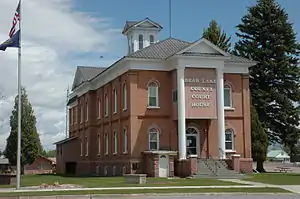 Bear Lake County Courthouse | |
 Seal | |
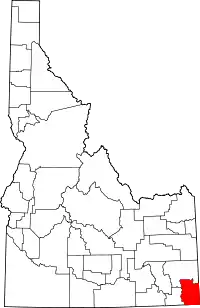 Location within the U.S. state of Idaho | |
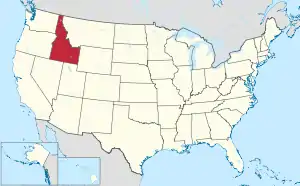 Idaho's location within the U.S. | |
| Coordinates: 42°17′N 111°20′W | |
| Country | |
| State | |
| Founded | January 5, 1875 |
| Named for | Bear Lake |
| Seat | Paris |
| Largest city | Montpelier |
| Area | |
| • Total | 1,049 sq mi (2,720 km2) |
| • Land | 975 sq mi (2,530 km2) |
| • Water | 75 sq mi (190 km2) 7.1% |
| Population (2010) | |
| • Total | 5,986 |
| • Estimate (2019) | 6,125 |
| • Density | 6.3/sq mi (2.4/km2) |
| Time zone | UTC−7 (Mountain) |
| • Summer (DST) | UTC−6 (MDT) |
| Congressional district | 2nd |
| Website | bearlakecounty |
The county is named after Bear Lake, a large alpine lake at an elevation of 5,924 feet (1,806 m) above sea level. The northern half of the 20-mile-long (32 km) lake is in Idaho, the southern half in Utah. The county was established in 1875 in the Idaho Territory, fifteen years before statehood.[3]
History
Peg-Leg Smith established a trading post on the Oregon Trail from 1848 to 1850 near Dingle.[4] The first settlement in the Bear Lake Valley was Paris, settled by Mormon pioneers led by Charles Rich on September 26, 1863;·[3] thirty families comprised the original settlement. In the spring of 1864, Montpelier was settled on the other side of the valley on the Oregon Trail. Bear Lake County was established in 1875,[5] and the railroad was extended through Montpelier in 1892.
Geography
Bear Lake County comprises the state's southeast corner. Its east boundary line abuts the west line of the state of Wyoming and its south boundary line abuts the north line of the state of Utah. According to the US Census Bureau, the county has a total area of 1,049 square miles (2,720 km2), of which 975 sq mi (2,530 km2) is land and 75 sq mi (190 km2) (6.1%) is water.[6] The county is centered on Bear Lake Valley and includes the surrounding mountain ranges. The valley is high in the mountains, with its lowest elevation over 5,900 feet (1,800 m) above sea level. The highest point in the county is Meade Peak at 9,957 feet (3,035 m).
Adjacent counties
- Caribou County - north
- Lincoln County, Wyoming - east
- Rich County, Utah - south
- Franklin County - west
National protected areas
Demographics
| Historical population | |||
|---|---|---|---|
| Census | Pop. | %± | |
| 1880 | 3,235 | — | |
| 1890 | 6,057 | 87.2% | |
| 1900 | 7,051 | 16.4% | |
| 1910 | 7,729 | 9.6% | |
| 1920 | 8,783 | 13.6% | |
| 1930 | 7,872 | −10.4% | |
| 1940 | 7,911 | 0.5% | |
| 1950 | 6,834 | −13.6% | |
| 1960 | 7,148 | 4.6% | |
| 1970 | 5,801 | −18.8% | |
| 1980 | 6,931 | 19.5% | |
| 1990 | 6,084 | −12.2% | |
| 2000 | 6,411 | 5.4% | |
| 2010 | 5,986 | −6.6% | |
| 2019 (est.) | 6,125 | 2.3% | |
| US Decennial Census[7] 1790-1960[8] 1900-1990[9] 1990-2000[10] 2010-2018[1] 2019[11] | |||
2000 census
As of the 2000 United States Census,[12] there were 6,411 people, 2,259 households, and 1,710 families in the county. The population density was 7 people per square mile (3/km2). There were 3,268 housing units at an average density of 3 per square mile (1/km2). The racial makeup of the county was 97.66% White, 0.09% Black or African American, 0.53% Native American, 0.08% Asian, 0.05% Pacific Islander, 1.08% from other races, and 0.51% from two or more races. 2.40% of the population were Hispanic or Latino of any race. 28.6% were of English, 16.1% American, 9.4% German, 7.1% Danish, 6.2% Swiss and 5.5% Swedish ancestry.
There were 2,259 households, out of which 38.80% had children under the age of 18 living with them, 66.90% were married couples living together, 6.40% had a female householder with no husband present, and 24.30% were non-families. 22.20% of all households were made up of individuals, and 12.10% had someone living alone who was 65 years of age or older. The average household size was 2.81 and the average family size was 3.33.
The county population contained 33.00% under the age of 18, 7.40% from 18 to 24, 22.40% from 25 to 44, 21.70% from 45 to 64, and 15.60% who were 65 years of age or older. The median age was 36 years. For every 100 females there were 98.40 males. For every 100 females age 18 and over, there were 96.70 males.
The median income for a household in the county was $32,162, and the median income for a family was $38,351. Males had a median income of $33,958 versus $17,829 for females. The per capita income for the county was $13,592. About 7.10% of families and 9.60% of the population were below the poverty line, including 11.30% of those under age 18 and 9.20% of those age 65 or over.
2010 census
As of the 2010 United States Census, there were 5,986 people, 2,281 households, and 1,661 families in the county.[13] The population density was 6.1 inhabitants per square mile (2.4/km2). There were 3,914 housing units at an average density of 4.0 per square mile (1.5/km2).[14] The racial makeup of the county was 96.3% white, 0.5% American Indian, 0.4% Asian, 0.1% black or African American, 1.6% from other races, and 1.1% from two or more races. Those of Hispanic or Latino origin made up 3.6% of the population.[13] In terms of ancestry, 37.1% were English, 10.2% were German, 8.0% were American, and 7.6% were Danish.[15]
Of the 2,281 households, 32.4% had children under the age of 18 living with them, 63.3% were married couples living together, 6.3% had a female householder with no husband present, 27.2% were non-families, and 24.0% of all households were made up of individuals. The average household size was 2.61 and the average family size was 3.12. The median age was 40.5 years.[13]
The median income for a household in the county was $43,374 and the median income for a family was $47,092. Males had a median income of $39,023 versus $26,417 for females. The per capita income for the county was $19,284. About 11.2% of families and 13.9% of the population were below the poverty line, including 14.1% of those under age 18 and 12.0% of those age 65 or over.[16]
Communities
Census-designated place
Politics
Bear Lake County voters have been reliably Republican for several decades. In only one national election since 1948 has the county selected the Democratic Party candidate.
| Year | Republican | Democratic | Third parties |
|---|---|---|---|
| 2020 | 87.9% 2,914 | 10.6% 350 | 1.6% 52 |
| 2016 | 75.2% 2,203 | 8.7% 255 | 16.1% 470 |
| 2012 | 88.2% 2,489 | 10.7% 302 | 1.1% 31 |
| 2008 | 80.8% 2,377 | 17.1% 502 | 2.2% 64 |
| 2004 | 82.4% 2,506 | 16.3% 494 | 1.3% 40 |
| 2000 | 79.2% 2,296 | 17.8% 517 | 3.0% 86 |
| 1996 | 56.4% 1,583 | 28.7% 805 | 15.0% 420 |
| 1992 | 49.7% 1,419 | 19.7% 562 | 30.6% 873 |
| 1988 | 69.9% 2,084 | 29.1% 867 | 1.0% 29 |
| 1984 | 84.5% 2,760 | 14.7% 481 | 0.8% 26 |
| 1980 | 82.5% 2,941 | 14.2% 508 | 3.3% 118 |
| 1976 | 66.6% 2,094 | 30.5% 960 | 2.9% 90 |
| 1972 | 69.5% 2,213 | 22.5% 716 | 8.0% 256 |
| 1968 | 60.2% 1,866 | 34.1% 1,058 | 5.7% 177 |
| 1964 | 43.1% 1,409 | 56.9% 1,857 | |
| 1960 | 55.7% 1,963 | 44.3% 1,563 | |
| 1956 | 64.2% 2,181 | 35.8% 1,218 | |
| 1952 | 64.4% 2,300 | 35.7% 1,274 | |
| 1948 | 48.5% 1,590 | 50.7% 1,664 | 0.8% 26 |
| 1944 | 48.2% 1,613 | 51.8% 1,732 | 0.1% 2 |
| 1940 | 46.5% 1,761 | 53.5% 2,026 | |
| 1936 | 40.3% 1,404 | 59.6% 2,078 | 0.1% 4 |
| 1932 | 50.9% 1,785 | 49.1% 1,721 | 0.1% 3 |
| 1928 | 61.0% 1,802 | 38.8% 1,146 | 0.2% 7 |
| 1924 | 54.2% 1,611 | 29.6% 881 | 16.2% 481 |
| 1920 | 61.7% 1,831 | 38.3% 1,138 | |
| 1916 | 43.4% 1,229 | 55.4% 1,566 | 1.2% 34 |
| 1912 | 51.0% 1,271 | 36.7% 916 | 12.3% 307 |
| 1908 | 60.4% 1,460 | 38.6% 933 | 1.0% 23 |
| 1904 | 66.3% 1,538 | 33.1% 769 | 0.6% 14 |
| 1900 | 49.5% 1,055 | 50.5% 1,077 |
References
- "State & County QuickFacts". US Census Bureau. Archived from the original on July 7, 2011. Retrieved June 28, 2014.
- "Find a County". National Association of Counties. Archived from the original on July 4, 2012. Retrieved June 7, 2011.
- Rich, A.M.; Rich, Russell (April 12, 1962). "Indians once traded beside Bear Lake". Lewiston Morning Tribune. (Idaho). p. 6, section 2.
- "Archived copy" (PDF). Archived from the original (PDF) on July 7, 2010. Retrieved 31 August 2010.CS1 maint: archived copy as title (link) THOMAS L. (PEG-LEG) SMITH'S HUDSON'S BAY COMPANY FUR TRADE OPERATIONS
- "Bear Lake County". State of Idaho. Archived from the original on January 4, 2013. Retrieved December 3, 2012.
- "US Gazetteer files: 2010, 2000, and 1990". US Census Bureau. February 12, 2011. Retrieved 23 April 2011.
- "US Decennial Census". US Census Bureau. Retrieved June 28, 2014.
- "Historical Census Browser". University of Virginia Library. Retrieved June 28, 2014.
- "Population of Counties by Decennial Census: 1900 to 1990". US Census Bureau. Retrieved June 28, 2014.
- "Census 2000 PHC-T-4. Ranking Tables for Counties: 1990 and 2000" (PDF). US Census Bureau. Retrieved June 28, 2014.
- "QuickFacts. Idaho counties". Retrieved May 17, 2020.
- "U.S. Census website". US Census Bureau. Retrieved January 31, 2008.
- "Profile of General Population and Housing Characteristics: 2010 Demographic Profile Data". US Census Bureau. Archived from the original on 13 February 2020. Retrieved 4 January 2016.
- "Population, Housing Units, Area, and Density: 2010 - County". US Census Bureau. Archived from the original on 13 February 2020. Retrieved 4 January 2016.
- "Selected Social Characteristics in the US – 2006-2010 American Community Survey 5-Year Estimates". US Census Bureau. Archived from the original on 13 February 2020. Retrieved 4 January 2016.
- "Selected Economic Characteristics – 2006-2010 American Community Survey 5-Year Estimates". US Census Bureau. Archived from the original on 13 February 2020. Retrieved 4 January 2016.
- Alton ID Google Maps (accessed January 16, 2019)
- Raymond ID Google Maps (accessed 16 January 2019)
- Wooleys ID Google Maps (accessed 16 January 2019)
- Leip, David. "Atlas of US Presidential Elections". uselectionatlas.org. Retrieved April 4, 2018.
External links
- Official website
- State of Idaho official site - Bear Lake County
- News-Examiner - Montpelier newspaper
- Bear Lake Valley Convention & Visitors Bureau
- Bear Lake County School District #33
- The rights of citizenship : brief in re H.R. Bills no. 1478, 6153, and the Petition of the citizens of Bear Lake County, Idaho Territory (1885?)
Places adjacent to Bear Lake County, Idaho | ||||||||||
|---|---|---|---|---|---|---|---|---|---|---|
| ||||||||||
Municipalities and communities of Bear Lake County, Idaho, United States | ||
|---|---|---|
| Cities | Map of Idaho highlighting Bear Lake County | |
| CDP | ||
| Unincorporated communities | ||
| ||
Boise (capital) | ||
| Topics |
| |
| Society | ||
| Regions | ||
| Larger cities | ||
| Smaller cities | ||
| Counties |
| |
| Authority control |
|---|