Bannock County, Idaho
Bannock County is a county in the southeastern part of Idaho. As of the 2010 United States Census the population was 82,839,[1] making it the fifth-most populous county in Idaho. The county seat and largest city is Pocatello.[2] The county was established in 1893 and named after the local Bannock tribe.[3] It is one of the counties with territories included in the Fort Hall Indian Reservation of the federally recognized Shoshone-Bannock Tribes.
Bannock County | |
|---|---|
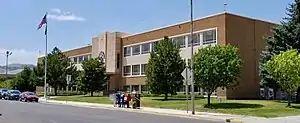 Bannock County Courthouse in Pocatello | |
 Seal | |
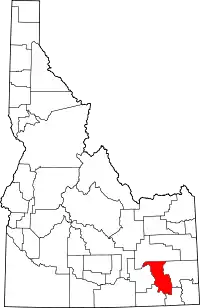 Location within the U.S. state of Idaho | |
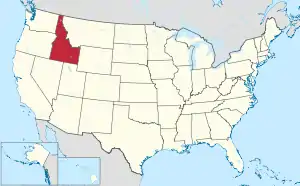 Idaho's location within the U.S. | |
| Coordinates: 42°40′N 112°13′W | |
| Country | |
| State | |
| Founded | March 6, 1893 |
| Named for | Bannock tribe |
| Seat | Pocatello |
| Largest city | Pocatello |
| Area | |
| • Total | 1,147 sq mi (2,970 km2) |
| • Land | 1,112 sq mi (2,880 km2) |
| • Water | 35 sq mi (90 km2) 3.1% |
| Population (2010) | |
| • Total | 82,839 |
| • Estimate (2019) | 87,808 |
| • Density | 79/sq mi (31/km2) |
| Time zone | UTC−7 (Mountain) |
| • Summer (DST) | UTC−6 (MDT) |
| Congressional district | 2nd |
| Website | www |
Bannock County is part of the Pocatello, Idaho Metropolitan Statistical Area.
Geography
According to the US Census Bureau, the county has a total area of 1,147 square miles (2,970 km2), of which 1,112 square miles (2,880 km2) is land and 35 square miles (91 km2) (3.1%) is water.[4] The Portneuf River flows through the county, meeting the Snake River (the American Falls Reservoir) at the county's lowest point, its northwestern corner. Bonneville Peak, on the eastern border in the Portneuf Range, is the county's highest point at 9,271 feet (2825 m) ASL; on its western slopes is the Pebble Creek ski area.
Adjacent counties
- Bingham County - north
- Caribou County - east
- Franklin County - southeast
- Oneida County - southwest
- Power County - west
Highways
 - Interstate 15
 - Interstate 86
 - US 30
 - US 91
 - SH-40
National protected area
- Caribou National Forest (part)
Demographics
| Historical population | |||
|---|---|---|---|
| Census | Pop. | %± | |
| 1900 | 11,702 | — | |
| 1910 | 19,242 | 64.4% | |
| 1920 | 27,532 | 43.1% | |
| 1930 | 31,266 | 13.6% | |
| 1940 | 34,759 | 11.2% | |
| 1950 | 41,745 | 20.1% | |
| 1960 | 49,342 | 18.2% | |
| 1970 | 52,200 | 5.8% | |
| 1980 | 65,421 | 25.3% | |
| 1990 | 66,026 | 0.9% | |
| 2000 | 75,565 | 14.4% | |
| 2010 | 82,839 | 9.6% | |
| 2019 (est.) | 87,808 | 6.0% | |
| US Decennial Census[5] 1790-1960[6] 1900-1990[7] 1990-2000[8] 2010-2018[1] 2019[9] | |||
2000 census
As of the 2000 United States Census,[10] there were 75,565 people, 27,192 households, and 19,224 families in the county. The population density was 68 people per square mile (26/km2). There were 29,102 housing units at an average density of 26 per square mile (10/km2). The racial makeup of the county was 91.29% White, 0.59% Black or African American, 2.91% Native American, 0.99% Asian, 0.16% Pacific Islander, 2.08% from other races, and 1.98% from two or more races. 4.68% of the population were Hispanic or Latino of any race. 23.1% were of English, 14.2% German, 11.1% American and 7.4% Irish ancestry.
There were 27,192 households, out of which 36.50% had children under the age of 18 living with them, 56.70% were married couples living together, 10.00% had a female householder with no husband present, and 29.30% were non-families. 22.80% of all households were made up of individuals, and 7.60% had someone living alone who was 65 years of age or older. The average household size was 2.69 and the average family size was 3.20.
The county population contained 28.10% under the age of 18, 14.60% from 18 to 24, 27.20% from 25 to 44, 20.00% from 45 to 64, and 10.10% who were 65 years of age or older. The median age was 30 years. For every 100 females, there were 97.70 males. For every 100 females age 18 and over, there were 94.40 males.
The median income for a household in the county was $36,683, and the median income for a family was $44,192. Males had a median income of $36,056 versus $23,595 for females. The per capita income for the county was $17,148. About 9.80% of families and 13.90% of the population were below the poverty line, including 15.60% of those under age 18 and 7.60% of those age 65 or over.
2010 census
As of the 2010 United States Census, there were 82,839 people, 30,682 households, and 20,836 families in the county.[11] The population density was 74.5 inhabitants per square mile (28.8/km2). There were 33,191 housing units at an average density of 29.8 per square mile (11.5/km2).[12] The racial makeup of the county was 89.8% white, 3.2% American Indian, 1.3% Asian, 0.8% black or African American, 0.2% Pacific islander, 2.1% from other races, and 2.7% from two or more races. Those of Hispanic or Latino origin made up 6.7% of the population.[11] In terms of ancestry, 23.4% were English, 16.9% were German, 9.3% were Irish, and 7.0% were American.[13]
Of the 30,682 households, 35.5% had children under the age of 18 living with them, 52.2% were married couples living together, 10.7% had a female householder with no husband present, 32.1% were non-families, and 24.9% of all households were made up of individuals. The average household size was 2.64 and the average family size was 3.17. The median age was 31.4 years.[11]
The median income for a household in the county was $44,848 and the median income for a family was $54,650. Males had a median income of $43,538 versus $28,870 for females. The per capita income for the county was $21,275. About 10.6% of families and 14.0% of the population were below the poverty line, including 16.6% of those under age 18 and 4.2% of those age 65 or over.[14]
Government and politics
The last Democratic candidate for President to win the county was Lyndon B. Johnson in 1964,[15] although subsequent Republican victories have been by smaller margins than those in neighboring counties.
| Year | Republican | Democratic | Third parties |
|---|---|---|---|
| 2020 | 58.7% 23,331 | 36.9% 14,682 | 4.5% 1,770 |
| 2016 | 51.4% 17,180 | 31.0% 10,342 | 17.6% 5,894 |
| 2012 | 59.1% 21,010 | 37.2% 13,214 | 3.7% 1,299 |
| 2008 | 54.6% 19,356 | 41.7% 14,792 | 3.6% 1,289 |
| 2004 | 61.6% 21,479 | 37.0% 12,903 | 1.3% 462 |
| 2000 | 59.1% 18,223 | 35.3% 10,892 | 5.6% 1,737 |
| 1996 | 44.8% 14,058 | 40.8% 12,806 | 14.4% 4,513 |
| 1992 | 37.3% 12,016 | 34.4% 11,091 | 28.3% 9,104 |
| 1988 | 52.4% 14,986 | 45.7% 13,074 | 1.9% 541 |
| 1984 | 65.8% 18,742 | 33.0% 9,399 | 1.3% 355 |
| 1980 | 61.9% 18,477 | 28.9% 8,639 | 9.2% 2,743 |
| 1976 | 53.7% 13,172 | 41.8% 10,261 | 4.6% 1,117 |
| 1972 | 57.9% 12,856 | 35.3% 7,840 | 6.7% 1,495 |
| 1968 | 48.0% 10,234 | 42.6% 9,084 | 9.5% 2,016 |
| 1964 | 36.7% 7,825 | 63.3% 13,483 | |
| 1960 | 42.1% 9,157 | 57.9% 12,586 | |
| 1956 | 53.5% 10,476 | 46.5% 9,101 | |
| 1952 | 55.3% 10,864 | 44.6% 8,771 | 0.1% 27 |
| 1948 | 35.9% 5,580 | 62.2% 9,679 | 1.9% 301 |
| 1944 | 35.8% 5,413 | 64.1% 9,681 | 0.1% 11 |
| 1940 | 34.1% 5,419 | 65.9% 10,493 | 0.0% 1 |
| 1936 | 28.6% 3,830 | 70.5% 9,443 | 0.9% 120 |
| 1932 | 35.8% 4,676 | 63.3% 8,271 | 0.9% 112 |
| 1928 | 53.2% 5,297 | 46.2% 4,602 | 0.5% 54 |
| 1924 | 45.0% 4,520 | 16.1% 1,612 | 39.0% 3,914 |
| 1920 | 62.0% 4,871 | 38.0% 2,986 | |
| 1916 | 40.1% 2,950 | 55.5% 4,084 | 4.4% 322 |
| 1912 | 48.0% 2,316 | 30.8% 1,486 | 21.1% 1,019 |
| 1908 | 56.8% 2,690 | 39.9% 1,892 | 3.3% 158 |
| 1904 | 68.6% 2,826 | 25.8% 1,063 | 5.6% 232 |
| 1900 | 51.6% 1,684 | 48.4% 1,581 |
Similar to other Idaho counties, an elected three-member county commission heads the county government. Other elected officials include clerk, treasurer, sheriff, assessor, coroner, and prosecutor.[17]
Like other eastern Idaho counties, Bannock County has a significant Mormon population which strongly tends to vote Republican. However, a substantial trade union presence in the county - as well as the Idaho State University community - often gives Democrats an overall advantage, especially in local races. Bannock County routinely elects more Democrats than Republicans to county-level offices.
At the state level Bannock County is located in Legislative Districts 28 and 29.[18] Democrats currently control two of these six seats in the Idaho Legislature.[19] In 2016, Republicans were able to win House Seat A in District 29.
Idaho Department of Correction operates the Pocatello Women's Correctional Center (PWCC) in Pocatello and in Bannock County.[20]
Communities
References
- "State & County QuickFacts". US Census Bureau. Archived from the original on July 6, 2011. Retrieved June 28, 2014.
- "Find a County". National Association of Counties. Archived from the original on May 31, 2011. Retrieved June 7, 2011.
- Idaho.gov - Bannock County Archived August 10, 2009, at the Wayback Machine - accessed May 31, 2009
- "US Gazetteer files: 2010, 2000, and 1990". US Census Bureau. February 12, 2011. Retrieved April 23, 2011.
- "US Decennial Census". US Census Bureau. Retrieved June 28, 2014.
- "Historical Census Browser". University of Virginia Library. Retrieved June 28, 2014.
- "Population of Counties by Decennial Census: 1900 to 1990". US Census Bureau. Retrieved June 28, 2014.
- "Census 2000 PHC-T-4. Ranking Tables for Counties: 1990 and 2000" (PDF). US Census Bureau. Retrieved June 28, 2014.
- "QuickFacts. Idaho counties". Retrieved May 17, 2020.
- "U.S. Census website". US Census Bureau. Retrieved January 31, 2008.
- "Profile of General Population and Housing Characteristics: 2010 Demographic Profile Data". US Census Bureau. Archived from the original on February 13, 2020. Retrieved January 4, 2016.
- "Population, Housing Units, Area, and Density: 2010 - County". US Census Bureau. Archived from the original on February 13, 2020. Retrieved January 4, 2016.
- "Selected Social Characteristics in the US – 2006-2010 American Community Survey 5-Year Estimates". US Census Bureau. Archived from the original on February 13, 2020. Retrieved January 4, 2016.
- "Selected Economic Characteristics – 2006-2010 American Community Survey 5-Year Estimates". US Census Bureau. Archived from the original on February 13, 2020. Retrieved January 4, 2016.
- Dave Leip's Atlas of US Presidential Elections
- Leip, David. "Atlas of US Presidential Elections". uselectionatlas.org. Retrieved April 4, 2018.
- Bannock County Elections
- Idaho Legislative District Map Archived November 17, 2011, at the Wayback Machine
- Idaho Legislative Districts Archived November 10, 2008, at the Wayback Machine
- Static Printable Map of Pocatello & Chubbuck Archived September 27, 2011, at the Wayback Machine. City of Pocatello. Retrieved June 4, 2011.
- Blackrock ID Google Maps (accessed 16 January 2019)
- Portneuf ID Google Maps (accessed 16 January 2019)
- Red Rock Junction ID Google Maps (accessed 16 January 2019)
- Robin ID Google Maps (accessed 16 January 2019)
- Zenda ID Google Maps (accessed 16 January 2019)
Further reading
External links
- County website
- Chisholm, Hugh, ed. (1911). . Encyclopædia Britannica. 3 (11th ed.). Cambridge University Press. p. 354.
Places adjacent to Bannock County, Idaho | ||||||||||
|---|---|---|---|---|---|---|---|---|---|---|
| ||||||||||
Municipalities and communities of Bannock County, Idaho, United States | ||
|---|---|---|
| Cities | Map of Idaho highlighting Bannock County | |
| CDPs | ||
| Unincorporated communities | ||
| Indian reservation | ||
| Ghost town | ||
| Footnotes | ‡This populated place also has portions in an adjacent county or counties | |
| ||
Boise (capital) | ||
| Topics |
| |
| Society | ||
| Regions | ||
| Larger cities | ||
| Smaller cities | ||
| Counties |
| |
| Authority control |
|---|