Bingham County, Idaho
Bingham County is a county in the U.S. state of Idaho. As of the 2010 United States Census, the population was 45,607.[1] The county seat and largest city is Blackfoot.[2]
Bingham County | |
|---|---|
 | |
 Seal | |
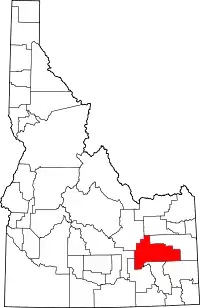 Location within the U.S. state of Idaho | |
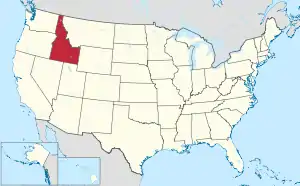 Idaho's location within the U.S. | |
| Coordinates: 43°13′N 112°24′W | |
| Country | |
| State | |
| Founded | January 13, 1885 |
| Named for | Henry H. Bingham |
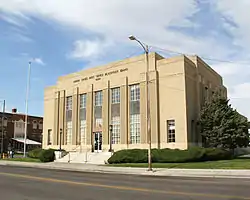
| Seat | Blackfoot |
| Largest city | Blackfoot |
| Area | |
| • Total | 2,120 sq mi (5,500 km2) |
| • Land | 2,094 sq mi (5,420 km2) |
| • Water | 26 sq mi (70 km2) 1.2% |
| Population (2010) | |
| • Total | 45,607 |
| • Estimate (2019) | 46,811 |
| • Density | 22.3/sq mi (8.6/km2) |
| Time zone | UTC−7 (Mountain) |
| • Summer (DST) | UTC−6 (MDT) |
| Congressional district | 2nd |
| Website | www |
Bingham County comprises the Blackfoot, ID Micropolitan Statistical Area, which is included in the Idaho Falls-Rexburg-Blackfoot, ID Combined Statistical Area.
History
Bingham County was created January 13, 1885. It was named for Henry H. Bingham, a congressman from Pennsylvania and friend of William Bunn, Idaho's Territorial Governor. The county was formed from Oneida County and was later partitioned itself to form Bannock (1893), Fremont (1893), Bonneville (1911), Power (1913), and Butte (1917) counties.[3]
Geography
According to the US Census Bureau, the county has a total area of 2,120 square miles (5,500 km2), of which 2,094 square miles (5,420 km2) is land and 26 square miles (67 km2) (1.2%) is water.[4] The Snake River flows southwest through the middle of Bingham County; at the county's southwest corner the river flows into the American Falls Reservoir. At the SE county corner is the Blackfoot Reservoir and Dam, impounding waters of the Blackfoot River. Outflow from the Blackfoot Dam flows northwesterly through the lower part of Bingham County, discharging into the Snake River.
Smaller buttes called the East Butte and the Middle Butte located in the Snake River Plain are visible south of US Route 20.
Adjacent counties
- Jefferson County - north
- Bonneville County - east
- Caribou County - southeast
- Bannock County - south
- Power County - southwest
- Blaine County - west
- Butte County - northwest
Highways
 - Interstate 15
 - US 20
 - US 26
 - US 91
 - SH-39
Demographics
| Historical population | |||
|---|---|---|---|
| Census | Pop. | %± | |
| 1890 | 13,575 | — | |
| 1900 | 10,447 | −23.0% | |
| 1910 | 23,306 | 123.1% | |
| 1920 | 18,310 | −21.4% | |
| 1930 | 18,561 | 1.4% | |
| 1940 | 21,044 | 13.4% | |
| 1950 | 23,271 | 10.6% | |
| 1960 | 28,218 | 21.3% | |
| 1970 | 29,167 | 3.4% | |
| 1980 | 36,489 | 25.1% | |
| 1990 | 37,583 | 3.0% | |
| 2000 | 41,735 | 11.0% | |
| 2010 | 45,607 | 9.3% | |
| 2019 (est.) | 46,811 | 2.6% | |
| US Decennial Census[5] 1790-1960[6] 1900-1990[7] 1990-2000[8] 2010-2018[1] 2019[9] | |||
2000 census
As of the 2000 United States Census,[10] there were 41,735 people, 13,317 households, and 10,706 families in the county. The population density was 20 people per square mile (8/km2). There were 14,303 housing units at an average density of 7 per square mile (3/km2). The racial makeup of the county was 82.43% White, 0.17% Black or African American, 6.70% Native American, 0.57% Asian, 0.03% Pacific Islander, 7.95% from other races, and 2.14% from two or more races. 13.30% of the population were Hispanic or Latino of any race. 23.6% were of English, 12.5% American, 8.9% German and 5.1% Danish ancestry.
There were 13,317 households, out of which 44.60% had children under the age of 18 living with them, 66.70% were married couples living together, 9.80% had a female householder with no husband present, and 19.60% were non-families. 17.10% of all households were made up of individuals, and 7.70% had someone living alone who was 65 years of age or older. The average household size was 3.10 and the average family size was 3.52.
The county population contained 34.90% under the age of 18, 9.70% from 18 to 24, 25.30% from 25 to 44, 19.70% from 45 to 64, and 10.30% who were 65 years of age or older. The median age was 30 years. For every 100 females there were 100.00 males. For every 100 females age 18 and over, there were 97.90 males.
The median income for a household in the county was $36,423, and the median income for a family was $40,312. Males had a median income of $31,950 versus $21,591 for females. The per capita income for the county was $14,365. About 9.90% of families and 12.40% of the population were below the poverty line, including 16.30% of those under age 18 and 7.20% of those age 65 or over.
2010 census
As of the 2010 United States Census, there were 45,607 people, 14,999 households, and 11,731 families in the county.[11] The population density was 21.8 inhabitants per square mile (8.4/km2). There were 16,141 housing units at an average density of 7.7 per square mile (3.0/km2).[12] The racial makeup of the county was 80.6% white, 6.5% American Indian, 0.6% Asian, 0.2% black or African American, 0.1% Pacific islander, 9.8% from other races, and 2.1% from two or more races. Those of Hispanic or Latino origin made up 17.2% of the population.[11] In terms of ancestry, 22.3% were English, 12.7% were German, 5.9% were American, and 5.0% were Irish.[13]
Of the 14,999 households, 43.6% had children under the age of 18 living with them, 62.4% were married couples living together, 10.5% had a female householder with no husband present, 21.8% were non-families, and 18.5% of all households were made up of individuals. The average household size was 3.02 and the average family size was 3.45. The median age was 31.8 years.[11]
The median income for a household in the county was $44,128 and the median income for a family was $51,750. Males had a median income of $39,703 versus $25,815 for females. The per capita income for the county was $18,633. About 13.2% of families and 14.7% of the population were below the poverty line, including 18.4% of those under age 18 and 10.5% of those age 65 or over.[14]
Communities
Politics
Bingham County voters are reliably Republican. In no national election since 1948 has the county selected the Democratic Party candidate.
| Year | Republican | Democratic | Third parties |
|---|---|---|---|
| 2020 | 76.5% 15,295 | 20.6% 4,124 | 2.9% 577 |
| 2016 | 65.6% 10,907 | 17.6% 2,924 | 16.8% 2,794 |
| 2012 | 76.0% 13,440 | 21.6% 3,822 | 2.4% 416 |
| 2008 | 71.3% 12,230 | 25.8% 4,424 | 2.9% 502 |
| 2004 | 76.9% 12,734 | 21.8% 3,605 | 1.4% 226 |
| 2000 | 73.5% 10,628 | 22.9% 3,310 | 3.6% 527 |
| 1996 | 56.4% 8,391 | 28.9% 4,304 | 14.7% 2,186 |
| 1992 | 45.9% 7,333 | 22.3% 3,565 | 31.8% 5,093 |
| 1988 | 68.9% 10,131 | 29.6% 4,346 | 1.6% 228 |
| 1984 | 78.7% 11,900 | 20.3% 3,064 | 1.0% 152 |
| 1980 | 76.1% 11,781 | 18.9% 2,933 | 5.0% 773 |
| 1976 | 60.8% 7,327 | 36.1% 4,347 | 3.1% 371 |
| 1972 | 64.3% 6,886 | 23.1% 2,476 | 12.6% 1,343 |
| 1968 | 60.2% 6,484 | 27.8% 2,988 | 12.0% 1,293 |
| 1964 | 50.6% 5,364 | 49.4% 5,231 | |
| 1960 | 55.1% 5,934 | 44.9% 4,843 | |
| 1956 | 63.2% 5,853 | 36.8% 3,412 | |
| 1952 | 66.9% 6,114 | 33.1% 3,024 | 0.1% 5 |
| 1948 | 49.0% 3,162 | 49.6% 3,197 | 1.4% 89 |
| 1944 | 48.4% 3,223 | 51.5% 3,428 | 0.1% 7 |
| 1940 | 48.9% 3,662 | 51.0% 3,815 | 0.2% 11 |
| 1936 | 34.9% 2,354 | 62.4% 4,215 | 2.7% 184 |
| 1932 | 42.5% 2,894 | 55.9% 3,802 | 1.6% 111 |
| 1928 | 64.3% 3,236 | 35.3% 1,778 | 0.4% 21 |
| 1924 | 53.5% 2,693 | 13.8% 696 | 32.7% 1,649 |
| 1920 | 73.6% 3,293 | 26.5% 1,184 | |
| 1916 | 43.3% 1,885 | 53.0% 2,306 | 3.6% 158 |
| 1912 | 47.9% 1,410 | 27.7% 814 | 24.4% 719 |
| 1908 | 59.9% 3,277 | 32.0% 1,749 | 8.1% 442 |
| 1904 | 71.2% 3,186 | 19.9% 890 | 9.0% 402 |
| 1900 | 47.1% 1,436 | 52.9% 1,613 |
References
- "State & County QuickFacts". US Census Bureau. Archived from the original on July 7, 2011. Retrieved June 28, 2014.
- "Find a County". National Association of Counties. Archived from the original on May 31, 2011. Retrieved June 7, 2011.
- Idaho.gov - Bingham County Archived August 14, 2009, at the Wayback Machine - accessed May 31, 2009
- "US Gazetteer files: 2010, 2000, and 1990". US Census Bureau. February 12, 2011. Retrieved April 23, 2011.
- "US Decennial Census". US Census Bureau. Retrieved June 28, 2014.
- "Historical Census Browser". University of Virginia Library. Retrieved June 28, 2014.
- "Population of Counties by Decennial Census: 1900 to 1990". US Census Bureau. Retrieved June 28, 2014.
- "Census 2000 PHC-T-4. Ranking Tables for Counties: 1990 and 2000" (PDF). US Census Bureau. Retrieved June 28, 2014.
- "QuickFacts. Idaho counties". Retrieved May 17, 2020.
- "U.S. Census website". US Census Bureau. Retrieved January 31, 2008.
- "Profile of General Population and Housing Characteristics: 2010 Demographic Profile Data". US Census Bureau. Archived from the original on February 13, 2020. Retrieved January 4, 2016.
- "Population, Housing Units, Area, and Density: 2010 - County". US Census Bureau. Archived from the original on 13 February 2020. Retrieved 4 January 2016.
- "Selected Social Characteristics in the US – 2006-2010 American Community Survey 5-Year Estimates". US Census Bureau. Archived from the original on February 13, 2020. Retrieved January 4, 2016.
- "Selected Economic Characteristics – 2006-2010 American Community Survey 5-Year Estimates". US Census Bureau. Archived from the original on February 13, 2020. Retrieved January 4, 2016.
- Alridge ID Google Maps (accessed 18 January 2019)
- Cerro Grande ID Google Maps (accessed 18 January 2019)
- Clarkson ID Google Maps (accessed 18 January 2019)
- Coffee Point ID Google Maps (accessed 18 January 2019)
- Collins ID Google Maps (accessed 18 January 2019)
- (accessed 4 December 2020)
- Gibson ID Google Maps (accessed 18 January 2019)
- Goshen ID Google Maps (accessed 18 January 2019)
- Mcdonaldville ID Google Maps (accessed 18 January 2019)
- Morgan ID Google Maps (accessed 18 January 2019)
- Rising River ID Google Maps (accessed 18 January 2019)
- Rose ID Google Maps (accessed 18 January 2019)
- Sterling ID Google Maps (accessed 18 January 2019)
- Thomas ID Google Maps (accessed 18 January 2019)
- Wapello ID Google Maps (accessed 18 January 2019)
- Wolverine ID Google Maps (accessed 18 January 2019)
- Woodville ID Google Maps (accessed 18 January 2019)
- Leip, David. "Atlas of US Presidential Elections". uselectionatlas.org. Retrieved April 4, 2018.
External links
 Media related to Bingham County, Idaho at Wikimedia Commons
- Official Bingham County, Idaho website
Places adjacent to Bingham County, Idaho | ||||||||||
|---|---|---|---|---|---|---|---|---|---|---|
| ||||||||||
Municipalities and communities of Bingham County, Idaho, United States | ||
|---|---|---|
| Cities | Map of Idaho highlighting Bingham County | |
| CDPs | ||
| Unincorporated communities | ||
| Indian reservation | ||
| Footnotes | ‡This populated place also has portions in an adjacent county or counties | |
| ||
Boise (capital) | ||
| Topics |
| |
| Society | ||
| Regions | ||
| Larger cities | ||
| Smaller cities | ||
| Counties |
| |
| Authority control |
|---|