Statistics of the COVID-19 pandemic in mainland China
This article presents official statistics gathered during the COVID-19 pandemic in mainland China.
Hold cursor ![]() over location to display name; click to go to location article.
over location to display name; click to go to location article.
As of 7 October 2020, there have been 2951 total (200 active) imported cases in mainland China, with no deaths recorded among them:[9]
- Anhui: 1 total imported case (all recovered).[10]
- Beijing: 176 total imported cases (1 active).[11]
- Chongqing: 9 total imported cases (1 active).[12]
- Fujian: 118 total imported cases (14 active[lower-alpha 2]).[13]
- Gansu: 78 total imported cases (all recovered).[14]
- Guangdong: 452 total imported cases (25 active[lower-alpha 3]).[15]
- Guangxi: 8 total imported cases (3 active[lower-alpha 4]).[16]
- Guizhou: 1 total imported case (all recovered).[17]
- Hebei: 26 total imported cases (1 active[lower-alpha 5]).[18]
- Heilongjiang: 387 total imported cases (all recovered).[19]
- Henan: 8 total imported cases (4 active[lower-alpha 6]).[20]
- Hunan: 1 total imported case (all recovered).[21]
- Inner Mongolia: 191 total imported cases (6 active[lower-alpha 7]).[22]
- Jiangsu: 22 total imported cases (all recovered).[23]
- Jiangxi: 2 total imported cases (all recovered).[lower-alpha 8].[24]
- Jilin: 19 total imported cases (3 active)[lower-alpha 9].[25]
- Liaoning: 21 total imported cases (all recovered).[26]
- Shaanxi: 63 total imported cases (8 active).[27]
- Shandong: 25 total imported cases (2 active).[28]
- Shanghai: 321 total imported cases (22 active).[29]
- Shanxi: 64 total imported cases (all recovered).[30]
- Sichuan: 21 total imported cases (all recovered)[lower-alpha 10].[31]
- Tianjin: 55 total imported cases (2 active).[32]
- Yunnan: 11 total imported cases (all recovered).[33]
- Zhejiang: 50 total imported cases (all recovered).[34]
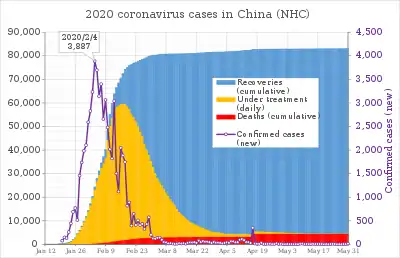
The case count in mainland China only includes symptomatic cases. It excludes patients who test positive but do not have symptoms, of which there were 889 as of 11 February 2020.[35] It's also reported that there were more than 43,000 by the end of February 2020.[36][37][38] On 17 April, following the Wuhan government's issuance of a report on accounting for COVID-19 deaths that occurred at home that went previously unreported, as well as the subtraction of deaths that were previously double-counted by different hospitals, the NHC retrospectively revised their cumulative totals dating to 16 April, adding 325 cumulative cases and 1,290 deaths.[39]
| COVID-19 pandemic in mainland China by provinces Data released by Chinese provinces as of 24:00 (UTC+8) 5 January 2021[40][41] | |||||||||
|---|---|---|---|---|---|---|---|---|---|
| Chinese provinces | Pop. (mil.) (2019) | Cases | Deaths | Fatality | Recov. | Active | Cases /1M pop | Deaths /1M pop | Ref. |
| China (mainland) | 1,400.0500 | 86,338 | 4,634 | 5.37 | 81,319 | 385 | 61.67 | 3.31 | [42][41] |
| Hubei | 59.2700 | 68,148 | 4,512 | 6.62 | 63,627 | 9 | 1,149.8 | 76.13 | [43][41] |
| ——Wuhan, Hubei | 11.2120 | 50,340 | 3,869 | 7.69 | 46,471 | 0 | 4,489.8 | 345.08 | [43] |
| Guangdong | 115.2100 | 1,963 | 8 | 0.41 | 1,922 | 33 | 17.0 | 0.07 | [44] [41] |
| Zhejiang | 58.5000 | 1,291 | 1 | 0.08 | 1,279 | 11 | 22.1 | 0.02 | [45] [41] |
| Henan | 96.4000 | 1,288 | 22 | 1.71 | 1,259 | 7 | 13.4 | 0.23 | [41] |
| Shanghai | 24.2814 | 1,277 | 7 | 0.55 | 1,174 | 96 | 52.6 | 0.29 | [41] |
| Hunan | 69.1838 | 1,020 | 4 | 0.39 | 1,015 | 1 | 14.7 | 0.06 | [41] |
| Anhui | 63.6590 | 992 | 6 | 0.60 | 985 | 1 | 15.6 | 0.09 | [41] |
| Xinjiang | 25.2322 | 980 | 3 | 0.31 | 952 | 25 | 38.8 | 0.12 | [41] |
| Heilongjiang | 37.5130 | 949 | 13 | 1.37 | 936 | 0 | 25.3 | 0.35 | [41] |
| Jiangxi | 46.6610 | 935 | 1 | 0.11 | 934 | 0 | 20.0 | 0.02 | [41] |
| Beijing | 21.5360 | 947 | 9 | 0.95 | 932 | 6 | 44.0 | 0.42 | [46] [41] |
| Shandong | 100.7021 | 848 | 7 | 0.83 | 841 | 0 | 8.4 | 0.07 | [41] |
| Sichuan | 83.7500 | 783 | 3 | 0.38 | 735 | 45 | 9.3 | 0.04 | [41] |
| Jiangsu | 80.7000 | 676 | 0 | 0 | 666 | 10 | 8.4 | 0 | [41] |
| Chongqing | 31.2432 | 589 | 6 | 1.02 | 582 | 1 | 18.9 | 0.19 | [41] |
| Shaanxi | 38.7621 | 484 | 3 | 0.62 | 438 | 43 | 12.5 | 0.08 | [41] |
| Fujian | 39.7300 | 461 | 1 | 0.22 | 423 | 37 | 11.6 | 0.03 | [41] |
| Hebei | 75.9197 | 373 | 6 | 1.61 | 362 | 5 | 4.9 | 0.08 | [41] |
| Inner Mongolia | 25.3960 | 307 | 1 | 0.33 | 282 | 24 | 12.1 | 0.04 | [41] |
| Tianjin | 15.6183 | 289 | 3 | 1.04 | 266 | 20 | 18.5 | 0.19 | [41] |
| Liaoning | 43.5170 | 288 | 2 | 0.69 | 280 | 6 | 6.6 | 0.05 | [41] |
| Guangxi | 49.6000 | 260 | 2 | 0.77 | 258 | 0 | 5.2 | 0.04 | [41] |
| Shanxi | 37.2922 | 218 | 0 | 0 | 213 | 5 | 5.8 | 0 | [41] |
| Yunnan | 48.5830 | 217 | 2 | 0.92 | 209 | 6 | 4.5 | 0.04 | [41] |
| Hainan | 9.4472 | 171 | 6 | 3.51 | 165 | 0 | 18.1 | 0.64 | [41] |
| Gansu | 26.4743 | 181 | 2 | 1.10 | 177 | 2 | 6.8 | 0.08 | [41] |
| Jilin | 26.9073 | 157 | 2 | 1.27 | 155 | 0 | 5.8 | 0.07 | [41] |
| Guizhou | 36.2295 | 147 | 2 | 1.36 | 145 | 0 | 4.1 | 0.06 | [41] |
| Ningxia | 6.9466 | 75 | 0 | 0 | 75 | 0 | 10.8 | 0 | [41] |
| Qinghai | 6.0782 | 18 | 0 | 0 | 18 | 0 | 2.96 | 0 | [41] |
| Tibet | 3.5056 | 1 | 0 | 0 | 1 | 0 | 0.29 | 0 | [41] |
Notes
- Cities under "Imported" category has only active cases that are imported from outside Mainland China. In other words, there are currently no active local cases in these cities.
- FJ: 33 in Fuzhou, 61 in Xiamen, 22 in Quanzhou, 1 in Zhangzhou, 1 in Ningde; 104 additional recovered: Specific location to be clarified.
- GD: 25 (active) in Guangzhou, 3 (active) in Zhanjiang, 1 (active) in Foshan; 4 additional recovered: Specific location to be clarified.
- GX: Specific location not differentiated.
- HE: Specific location not differentiated.
- HA: Specific location not differentiated.
- NM: Specific location not differentiated.
- JX: 2 in Nanchang
- JL: 4 (0 active) in Changchun, 1 (0 active) in Meihekou, 12 (3 active) in Jilin City, 2 (0 active) in Yanbian
- SC: 21 in Chengdu
References
- 国家卫生健康委员会办公厅 (5 February 2020). 新型冠状病毒感染肺炎的诊疗方案(试行第五版) (PDF). 国家卫生健康委员会办公厅 (in Chinese). Archived (PDF) from the original on 5 February 2020. Retrieved 5 February 2020.
- 2020年2月11日湖北省新型冠状病毒肺炎疫情情况 (in Chinese).
- Woodyatt, Amy; Kottasová, Ivana; Griffiths, James; Regan, Helen. "China changed how it counts coronavirus cases again. Here's why". CNN.
- 湖北省武汉市新冠肺炎疫情数据订正情况. National Health Commission. 2020-04-17. Retrieved 2020-04-17.
- "2019-nCoV Global Cases". gisanddata.maps.arcgis.com/. Retrieved 30 January 2020.
- 全球新冠病毒最新实时疫情地图_丁香园 (in Chinese). Retrieved 8 Oct 2020.
- 疫情通报(列表). nhc.gov.cn (in Chinese). Retrieved 2 March 2020.; current information about the 2020 coronavirus outbreak in Chinese provinces, other countries in the globe, see 疫情实时大数据报告. baidu.com (in Chinese). Retrieved 2 March 2020.
- 新冠肺炎疫情动态 (in Chinese). Retrieved 8 Oct 2020.
- 截至10月7日24时新型冠状病毒肺炎疫情最新情况 (in Chinese). National Health Commission. 8 Oct 2020. Retrieved 8 Oct 2020.
境外输入现有确诊病例200例(其中重症病例1例),现有疑似病例5例。累计确诊病例2951例,累计治愈出院病例2751例,无死亡病例。
- 安徽疫情地图. feiyan.wecity.qq.com. Retrieved 2020-10-08.
累计报告境外输入确诊病例1例,治愈出院1例
- 北京疫情地图. feiyan.wecity.qq.com. Retrieved 2020-10-08.
9月24日0时至24时,北京新增报告1例境外输入无症状感染者转确诊的病例。
- 重庆疫情地图. feiyan.wecity.qq.com. Retrieved 2020-10-08.
截至10月7日24时,重庆市现有境外输入在院确诊病例1例(为尼泊尔输入),累计治愈出院病例8例,累计报告境外输入确诊病例9例。
- 福建疫情地图. feiyan.wecity.qq.com. Retrieved 2020-10-08.
截至10月7日24时,福建省累计报告境外输入确诊病例118例,已治愈出院104例,目前住院14例,无死亡病例
- 甘肃疫情地图. feiyan.wecity.qq.com. Retrieved 2020-10-08.
甘肃无新增境外输入性新冠肺炎确诊病例
- 广东疫情地图. feiyan.wecity.qq.com. Retrieved 2020-10-08.
截至10月7日24时,全省累计报告新冠肺炎确诊病例1848例(境外输入452例)。目前在院25例。
- 广西疫情地图. feiyan.wecity.qq.com. Retrieved 2020-10-08.
全区现有境外输入确诊病例3例
- 贵州疫情地图. feiyan.wecity.qq.com. Retrieved 2020-10-08.
截至10月7日24时,贵州省累计报告本地确诊病例146例、境外输入病例1例,累计治愈出院病例145例、死亡病例2例,现有疑似病例0例、无症状感染者0例。
- 河北疫情地图. feiyan.wecity.qq.com. Retrieved 2020-10-08.
截至10月7日24时,河北省现有确诊病例1例(境外输入),累计治愈出院病例358例(含境外输入25例),累计死亡病例6例,累计报告本地确诊病例339例、境外输入病例26例。
- 黑龙江疫情地图. feiyan.wecity.qq.com. Retrieved 2020-10-08.
2020年10月7日0-24时,黑龙江省无新冠肺炎疫情报告。
- 河南疫情地图. feiyan.wecity.qq.com. Retrieved 2020-10-08.
累计报告境外输入确诊病例8例,4例出院,4例正在定点医院接受治疗。
- 湖南疫情地图. feiyan.wecity.qq.com. Retrieved 2020-10-08.
截至10月7日24时,湖南省累计报告新型冠状病毒肺炎确诊病例1019例,死亡病例4例,出院病例1015例。
- 内蒙古疫情地图. feiyan.wecity.qq.com. Retrieved 2020-10-08.
截至2020年10月8日7时,现有境外输入确诊病例6例,均在定点医院隔离治疗,所有密切接触者均在指定场所进行集中隔离医学观察,全程实行闭环管理,严防疫情扩散蔓延。
- 江苏疫情地图. feiyan.wecity.qq.com. Retrieved 2020-05-13.
截至5月12日24时,累计报告境外输入确诊病例22例,均已出院。
- 江西疫情地图. feiyan.wecity.qq.com. Retrieved 2020-04-12.
截至4月11日24时,全省累计报告境外输入确诊病例2例,累计出院病例2例,无住院确诊病例。
- 吉林疫情地图. feiyan.wecity.qq.com. Retrieved 2020-05-13.
截至5月12日24时,全省累计报告境外输入确诊病例19例,累计治愈出院16例(吉林市9例,延边州2例,长春市4例,梅河口市1例),在院隔离治疗3例(吉林市3例)。
- 辽宁疫情地图. feiyan.wecity.qq.com. Retrieved 2020-05-13.
5月12日0时至24时,辽宁省无新增新冠肺炎确诊病例,无新增治愈出院病例。 全省累计报告境外输入确诊病例21例,全部治愈出院。
- 陕西疫情地图. feiyan.wecity.qq.com. Retrieved 2020-05-13.
截至5月13日8时,陕西累计报告境外输入新冠肺炎确诊病例63例(治愈出院55例,无死亡病例),现有8例。
- 山东疫情地图. feiyan.wecity.qq.com. Retrieved 2020-05-13.
累计报告境外输入确诊病例25例。无新增治愈出院病例,累计治愈出院23例。
- 上海疫情地图. feiyan.wecity.qq.com. Retrieved 2020-05-13.
截至5月12日24时,累计报告境外输入性确诊病例321例,治愈出院299例,在院治疗22例(其中1例危重、1例重症)。
- 山西疫情地图. feiyan.wecity.qq.com. Retrieved 2020-05-13.
累计报告境外输入性确诊病例64例,治愈出院64例。
- 四川疫情地图. feiyan.wecity.qq.com. Retrieved 2020-05-13.
截至5月13日0时,全省累计报告新型冠状病毒肺炎确诊病例561例(其中境外输入21例),累计治愈出院558例,死亡3例。
- 天津疫情地图. feiyan.wecity.qq.com. Retrieved 2020-05-13.
截至5月12日24时,天津市累计报告境外输入性新型冠状病毒肺炎确诊病例55例,出院病例53例,在院2例(均为普通型)。
- 云南疫情地图. feiyan.wecity.qq.com. Retrieved 2020-05-13.
截至5月12日24时,累计境外输入确诊病例11例,全部治愈出院。
- 浙江疫情地图. feiyan.wecity.qq.com. Retrieved 2020-05-13.
截至5月12日24时,累计报告境外输入确诊病例50例,累计出院50例。
- 新型冠状病毒肺炎流行病学特征分析. 中华流行病学杂志 (in Chinese). 41 (2): 145–151. n.d.
- "Coronavirus Live Updates: Olympics Postponed; New York City Braces for a Deluge of Patients". The New York Times. 24 March 2020. Retrieved 24 March 2020.
- "A third of virus cases may be 'silent carriers', classified data suggests". South China Morning Post. 22 March 2020. Retrieved 24 March 2020.
- Kuo, Lily (23 March 2020). "Life after lockdown: has China really beaten coronavirus?". The Guardian. Retrieved 24 March 2020.
- "湖北省武汉市新冠肺炎疫情数据订正情况" [Revision of the data of the new coronary pneumonia epidemic situation in Wuhan City, Hubei Province] (in Chinese). National Health Commission. 17 April 2020. Retrieved 2 June 2020.
- 截至11月14日24时新型冠状病毒肺炎疫情最新情况 (in Chinese). National Health Commission. 15 November 2020. Retrieved 15 November 2020.
- 新型冠状病毒肺炎疫情实时大数据报告. baidu.com (in Chinese). Retrieved 15 November 2020.
- 疫情通报. National Health Commission of PR China (in Chinese). Retrieved 15 November 2020.
- 2020年6月22日湖北省新冠肺炎疫情情况. hubei.gov.cn (in Chinese). Retrieved 27 July 2020.
- 2020年7月27日广东省新冠肺炎疫情情况 (in Chinese). Retrieved 27 July 2020.
- 2020年7月16日浙江省新型冠状病毒肺炎疫情情况 (in Chinese). Retrieved 27 July 2020.
- 2020年7月16日北京市新型冠状病毒肺炎疫情情况 (in Chinese). Retrieved 27 July 2020.