2016 Virginia Democratic presidential primary
The 2016 Virginia Democratic presidential primary took place on March 1 in the U.S. state of Virginia as one of the Democratic Party's primaries ahead of the 2016 presidential election.
| |||||||||||||||||||
| |||||||||||||||||||
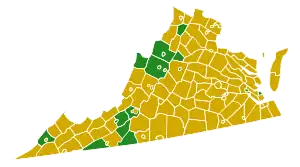 Election results by county.
Hillary Clinton
Bernie Sanders | |||||||||||||||||||

| Elections in Virginia |
|---|
 |
On the same day, dubbed "Super Tuesday," Democratic primaries were held in ten other states plus American Samoa, while the Republican Party held primaries in eleven states including their own Virginia primary.
Opinion polling
| Poll source | Date | 1st | 2nd | Other |
|---|---|---|---|---|
| Primary results | March 1, 2016 | Hillary Clinton 64.3% |
Bernie Sanders 35.2% |
Other 0.5% |
| SurveyMonkey[1]
Margin of error: ?
|
February 22–29, 2016 | Hillary Clinton 57% |
Bernie Sanders 36% |
Others / Undecided 7% |
| YouGov/CBS News[2]
Margin of error: 9.2%
|
February 22–26, 2016 | Hillary Clinton 59% |
Bernie Sanders 39% |
Others / Undecided 2% |
| Monmouth[3]
Margin of error: ± 5.6%
|
February 22–24, 2016 | Hillary Clinton 60% |
Bernie Sanders 33% |
Others / Undecided 7% |
| Roanoke College[4]
Margin of error: ± 4.8%
|
February 16–24, 2016 | Hillary Clinton 50% |
Bernie Sanders 33% |
Others / Undecided 17% |
| Public Policy Polling[5]
Margin of error: ± 4.4
|
February 14–16, 2016 | Hillary Clinton 56% |
Bernie Sanders 34% |
|
| Christopher Newport University[6]
Margin of error: ± 4.3%
|
February 3–14, 2016 | Hillary Clinton 52% |
Bernie Sanders 40% |
Others / Undecided 8% |
| Poll source | Date | 1st | 2nd | 3rd | Other |
|---|---|---|---|---|---|
| University of Mary Washington[7]
Registered voters:
|
November 4–9, 2015 | Hillary Clinton 58% (RV) 63% (LV) |
Bernie Sanders 32% (RV) 27% (LV) |
Martin O'Malley 4% (RV) 5% (LV) |
Don't know/None/Refused/Wouldn't vote in that primary 7% (RV) 5% (LV) |
| Christopher Newport University[8]
Margin of error: ± 5.1%
|
September 29 –October 8, 2015 | Hillary Clinton 40% |
Bernie Sanders 23% |
Joe Biden 23% |
Jim Webb 5%, Martin O'Malley 2%, Lincoln Chafee <1%, Someone Else 1%, Undecided/Don't Know/Refused 5% |
| Public Policy Polling[9]
Margin of error: ± 4.9%
|
July 13–15, 2015 | Hillary Clinton 64% |
Bernie Sanders 14% |
Jim Webb 8% |
Lincoln Chafee 5%, Martin O'Malley 2%, Not sure 7% |
| Christopher Newport University[10]
Margin of error: ± ?
|
April 13–24, 2015 | Hillary Clinton 80% |
Jim Webb 6% |
Joe Biden 5% |
Bernie Sanders 2%, Martin O'Malley 1%, Lincoln Chafee<1%, Someone else 2%, Undecided 3% |
| Christopher Newport University
Margin of error: ± ?
|
January 30 – February 10, 2015 | Hillary Clinton 65% |
Jim Webb 10% |
Joe Biden 8% |
Elizabeth Warren 8%, Deval Patrick 2%, Bernie Sanders 2%, Andrew Cuomo 1%, Martin O'Malley 1%, Someone else 1%, Undecided 2% |
| Poll source | Date | 1st | 2nd | 3rd | Other |
|---|---|---|---|---|---|
| Christopher Newport University
Margin of error: ± 5%
|
February 23–28, 2014 | Hillary Clinton 66% |
Joe Biden 19% |
Elizabeth Warren 7% |
Undecided 9% |
| Poll source | Date | 1st | 2nd | 3rd | Other |
|---|---|---|---|---|---|
| University of Mary Washington
Margin of error: ±?
|
September 25–29, 2013 | Hillary Clinton 34% |
Mark Warner 16% |
Joe Biden 9% |
Elizabeth Warren 3%, Andrew Cuomo 2%, Martin O'Malley 1%, None 12%, Don't know 17% |
| Public Policy Polling
Margin of error: ±5.2%
|
July 11–14, 2013 | Hillary Clinton 51% |
Joe Biden 14% |
Mark Warner 11% |
Elizabeth Warren 6%, Cory Booker 4%, Martin O'Malley 3%, Andrew Cuomo 2%, Brian Schweitzer 1%, Kirsten Gillibrand 0%, Someone else/Undecided 8% |
| Public Policy Polling
Margin of error: ± 4.8%
|
May 24–26, 2013 | Hillary Clinton 56% |
Joe Biden 14% |
Mark Warner 11% |
Andrew Cuomo 3%, Elizabeth Warren 3%, Kirsten Gillibrand 1%, Martin O'Malley 1%, Deval Patrick 0%, Brian Schweitzer 0%, Someone else/Undecided 10% |
| University of Mary Washington
Margin of error: ±?
|
March 20–24, 2013 | Hillary Clinton 38% |
Mark Warner 18% |
Joe Biden 10% |
Andrew Cuomo 3%, Martin O'Malley 3%, Other 1%, None 12%, Don't know 12% |
Results
Primary date: March 1, 2016
National delegates: 95
| Virginia Democratic primary, March 1, 2016 | |||||
|---|---|---|---|---|---|
| Candidate | Popular vote | Estimated delegates | |||
| Count | Percentage | Pledged | Unpledged | Total | |
| Hillary Clinton | 504,741 | 64.29% | |||
| Bernie Sanders | 276,370 | 35.20% | |||
| Martin O'Malley (withdrawn) | 3,930 | 0.50% | |||
| Uncommitted | N/A | ||||
| Total | 785,041 | 100% | 95 | 14 | 109 |
| Source: The Green Papers, Virginia Department of Elections | |||||
Results by county/Independent cities
| County[11] | Clinton | Votes | Sanders | Votes |
|---|---|---|---|---|
| Accomack | 72.0% | 1,790 | 27.4% | 682 |
| Albermarle | 54.6% | 8,288 | 45.0% | 6,844 |
| Alexandria | 69.5% | 16,310 | 29.9% | 7,031 |
| Alleghany | 63.3% | 433 | 36.0% | 246 |
| Amelia | 78.8% | 671 | 21.0% | 179 |
| Amherst | 65.2% | 1,044 | 34.1% | 546 |
| Appomattox | 67.0% | 448 | 32.1% | 215 |
| Arlington | 66.8% | 25,582 | 32.8% | 12,566 |
| Augusta | 48.0% | 1,639 | 51.4% | 1,754 |
| Bath | 63.0% | 148 | 36.6% | 86 |
| Bedford | 56.5% | 1,876 | 42.9% | 1,424 |
| Bland | 51.7% | 125 | 47.1% | 114 |
| Botetourt | 55.7% | 888 | 43.6% | 695 |
| Bristol | 56.3% | 428 | 42.6% | 324 |
| Brunswick | 89.7% | 1,354 | 10.1% | 153 |
| Buchanan | 70.3% | 523 | 28.4% | 211 |
| Buckingham | 76.6% | 902 | 23.1% | 272 |
| Buena Vista | 58.2% | 142 | 41.0% | 100 |
| Campbell | 65.8% | 1,299 | 33.8% | 667 |
| Caroline | 74.2% | 1,902 | 25.1% | 642 |
| Carroll | 57.1% | 601 | 42.4% | 446 |
| Charles City | 85.6% | 864 | 14.0% | 141 |
| Charlotte | 79.1% | 162 | 20.2% | 162 |
| Charlottesville | 46.3% | 3,889 | 53.4% | 4,483 |
| Chesapeake | 74.1% | 16,133 | 25.5% | 5,558 |
| Chesterfield | 66.0% | 22,617 | 33.6% | 11,514 |
| Clarke | 51.4% | 625 | 47.7% | 581 |
| Colonia Heights | 55.8% | 407 | 43.4% | 316 |
| Covington | 73.6% | 237 | 25.5% | 82 |
| Craig | 51.1% | 113 | 48.0% | 106 |
| Culpeper | 54.7% | 1,421 | 44.4% | 1,154 |
| Cumberland | 79.9% | 639 | 19.8% | 158 |
| Danville | 79.9% | 2,677 | 19.6% | 656 |
| Dickenson | 60.0% | 346 | 38.7% | 223 |
| Dinwiddie | 83.3% | 1,935 | 16.2% | 375 |
| Emporia | 88.7% | 407 | 10.9% | 50 |
| Essex | 82.1% | 643 | 17.1% | 134 |
| Fairfax (City) | 59.4% | 1,841 | 40.2% | 1,246 |
| Fairfax (County) | 63.0% | 88,147 | 36.4% | 50,930 |
| Falls Church | 61.2% | 1,588 | 38.5% | 1,000 |
| Fauquier | 54.5% | 2,860 | 44.7% | 2,345 |
| Floyd | 29.6% | 396 | 70.1% | 936 |
| Fluvanna | 57.6% | 1,355 | 41.8% | 984 |
| Franklin | 86.9% | 804 | 12.4% | 115 |
| Franklin | 62.6% | 1,675 | 36.6% | 980 |
| Frederick | 50.1% | 2,114 | 49.1% | 2,072 |
| Fredericksburg | 52.7% | 1,400 | 46.7% | 1,241 |
| Galax | 57.9% | 129 | 41.3% | 92 |
| Giles | 55.7% | 405 | 43.6% | 317 |
| Gloucester | 59.1% | 1,448 | 40.5% | 993 |
| Goochland | 71.5% | 1,574 | 28.3% | 624 |
| Grayson | 49.3% | 265 | 50.0% | 269 |
| Greene | 48.7% | 579 | 50.8% | 603 |
| Greensville | 87.7% | 832 | 11.9% | 113 |
| Halifax | 80.8% | 1,756 | 18.6% | 403 |
| Hampton | 77.9% | 13,542 | 21.7% | 3,770 |
| Hanover | 59.9% | 4,916 | 39.7% | 3,255 |
| Harrisonburg | 33.6% | 1,482 | 66.1% | 2,914 |
| Henrico | 69.8% | 28,170 | 29.7% | 11,994 |
| Henry | 72.7% | 1,810 | 26.7% | 664 |
| Highland | 49.4% | 86 | 50.6% | 88 |
| Hopewell | 77.4% | 1,177 | 22.2% | 337 |
| Isle of Wight | 73.9% | 2,449 | 25.7% | 853 |
| James City | 65.1% | 5,213 | 34.3% | 2,752 |
| King and Queen | 78.7% | 477 | 20.8% | 126 |
| King George | 59.4% | 916 | 39.7% | 612 |
| King William | 72.0% | 843 | 26.9% | 315 |
| Lancaster | 74.4% | 823 | 24.8% | 275 |
| Lee | 63.5% | 317 | 34.1% | 170 |
| Lexington | 61.2% | 403 | 37.9% | 250 |
| Loudoun | 58.6% | 21,180 | 40.8% | 14,730 |
| Louisa | 65.5% | 1,630 | 34.1% | 849 |
| Lunenburg | 83.5% | 736 | 16.0% | 141 |
| Lynchburg | 61.6% | 3,105 | 38.2% | 1,923 |
| Madison | 59.1% | 538 | 40.7% | 370 |
| Manassas | 58.0% | 1,813 | 41.1% | 1,284 |
| Manassas Park | 57.4% | 581 | 42.2% | 427 |
| Martinsville | 75.3% | 834 | 23.8% | 264 |
| Mathews | 63.2% | 435 | 35.9% | 247 |
| Mecklenburg | 80.3% | 1,589 | 19.2% | 379 |
| Middlesex | 64.4% | 509 | 35.4% | 280 |
| Montgomery | 40.7% | 3,507 | 59.0% | 5,090 |
| Nelson | 56.2% | 992 | 43.1% | 761 |
| New Kent | 67.8% | 951 | 31.4% | 440 |
| Newport News | 73.0% | 4,553 | 26.6% | 4,553 |
| Norfolk | 69.2% | 15,760 | 30.5% | 6,936 |
| Northampton | 72.5% | 868 | 27.1% | 324 |
| Northumberland | 75.1% | 823 | 24.2% | 265 |
| Norton | 53.8% | 86 | 45.0% | 72 |
| Nottoway | 78.1% | 829 | 21.1% | 224 |
| Orange | 59.9% | 1,322 | 39.4% | 870 |
| Page | 53.4% | 411 | 46.0% | 353 |
| Patrick | 48.9% | 361 | 50.3% | 372 |
| Petersburg | 85.4% | 4,100 | 14.3% | 688 |
| Pittsylvania | 75.2% | 2,371 | 24.3% | 766 |
| Poquoson | 46.5% | 295 | 52.8% | 335 |
| Portsmouth | 78.5% | 9,469 | 21.1% | 2,541 |
| Powhatan | 64.4% | 1,079 | 35.3% | 592 |
| Prince Edward | 75.9% | 1,366 | 23.3% | 420 |
| Prince George | 77.7% | 1,994 | 22.1% | 566 |
| Prince William | 63.9% | 26,443 | 35.5% | 14,701 |
| Pulaski | 58.3% | 837 | 41.0% | 588 |
| Radford | 41.6% | 472 | 57.7% | 655 |
| Richmond (City) | 60.6% | 21,828 | 39.2% | 14,117 |
| Richmond (County) | 80.1% | 333 | 19.2% | 80 |
| Roanoke (City) | 59.0% | 4,784 | 40.8% | 3,302 |
| Roanoke (County) | 54.3% | 3,325 | 45.1% | 2,761 |
| Rockbridge | 57.1% | 902 | 42.8% | 676 |
| Rockingham | 47.0% | 1,735 | 52.6% | 1,943 |
| Russell | 59.9% | 557 | 38.8% | 361 |
| Salem | 50.9% | 765 | 48.4% | 727 |
| Scott | 56.2% | 305 | 42.9% | 233 |
| Shenandoah | 50.5% | 960 | 48.8% | 929 |
| Smyth | 58.7% | 527 | 40.2% | 361 |
| Southampton | 83.8% | 1,199 | 15.1% | 216 |
| Spotsylvania | 60.4% | 5,399 | 38.9% | 3,480 |
| Stafford | 60.9% | 6,439 | 38.2% | 4,042 |
| Staunton | 44.8% | 1,115 | 54.8% | 1,365 |
| Suffolk | 79.5% | 7,537 | 20.0% | 1,895 |
| Surry | 81.8% | 812 | 17.5% | 174 |
| Sussex | 90.5% | 957 | 9.3% | 98 |
| Tazewell | 57.6% | 683 | 40.6% | 481 |
| Virginia Beach | 63.1% | 22,362 | 36.6% | 12,983 |
| Warren | 48.0% | 942 | 51.4% | 1,008 |
| Washington | 54.1% | 1,185 | 45.0% | 984 |
| Waynesboro | 50.3% | 788 | 49.0% | 769 |
| Westmoreland | 74.5% | 879 | 25.0% | 295 |
| Williamsburg | 49.0% | 1,159 | 50.7% | 1,199 |
| Winchester | 50.9% | 950 | 48.4% | 903 |
| Wise | 46.8% | 519 | 52.3% | 579 |
| Whythe | 55.3% | 529 | 44.2% | 423 |
| York | 61.4% | 3,292 | 38.1% | 2,041 |
| Total | 64.3% | 504,741 | 35.2% | 276,370 |
Analysis
After losing the state badly to Barack Obama in 2008, Hillary Clinton won Virginia by 29 points against Bernie Sanders in 2016. Her victory was primarily delivered by African Americans who backed Clinton 84-16, and women, who backed Clinton over Sanders by a margin of 70-30. Clinton also won the white vote in Virginia, 57-42, which comprised 63% of the electorate in the State. Clinton swept all income levels and educational attainment levels.
Clinton won most of the major cities in Virginia. She won Alexandria and Fairfax by a wide margin. She also won the D.C. suburbs as a whole, 65-35. This region has a large population of college-educated whites as well as African Americans. Clinton won the Northern Virginia Exurbs 60-40. She performed well in more rural Central Virginia and western Virginia including the Shenandoah Valley, winning 54-43 over Bernie Sanders and carrying the city of Roanoke. Clinton also won the eastern region of Virginia, including the major city of Richmond, by a margin of 66-34. She won in the Tidewater region of Virginia 72-28.
References
- "Trump's Lead Looks Steady in Run-Up to Super Tuesday". Retrieved 2016-03-01.
- "CBS News 2016 Battleground TrackerVirginia". Retrieved 2016-02-28.
- "VIRGINIA: TRUMP, CLINTON LEAD PRIMARIES" (PDF).
- "RC Poll: Clinton, Trump hold leads in Virginia primary elections; Cruz, Rubio in tight battle for second".
- "Subject: Clinton leads in 10 of 12 Early March Primaries; Benefits From Overwhelming Black Support" (PDF).
- "Trump leads GOP field, with Rubio and Cruz next; Clinton leads Sanders among Virginia Democrats" (PDF).
- "VIRGINIA SURVEY 2015" (PDF). umw.edu. Retrieved 2015-11-17.
- "Clinton top choice among Virginia Democrats, but Biden performs better against Republicans" (PDF). Cnu.edu. Retrieved 2015-10-12.
- "Bush leads GOP Field in Virginia Poll" (PDF). Public Policy Polling. Retrieved 2015-07-16.
- "Bush tops Clinton in battleground Virginia; Republican 2016 field still largely wide open, while Democrats rally strongly around Clinton" (PDF). Cnu.edu. Retrieved 2015-07-11.
- http://results.elections.virginia.gov/vaelections/2016%20March%20Democratic%20Presidential%20Primary/Site/President.html