2012 United States presidential election in Virginia
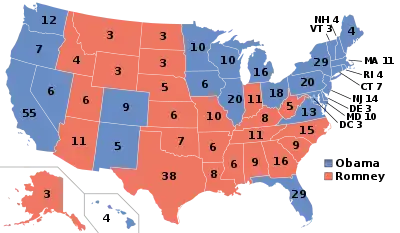
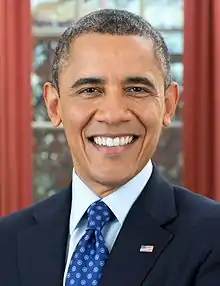
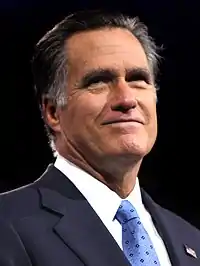
The 2012 United States presidential election in Virginia took place on November 6, 2012, as part of the presidential election in which all 50 states plus the District of Columbia participated. Virginia voters chose 13 electors to represent them in the Electoral College via a popular vote pitting incumbent Democratic President Barack Obama and his running mate, Vice President Joe Biden, against Republican challenger and former Massachusetts Governor Mitt Romney and his running mate, Congressman Paul Ryan.
| ||||||||||||||||||||||||||
| Turnout | 66.9% (voting eligible)[1] | |||||||||||||||||||||||||
|---|---|---|---|---|---|---|---|---|---|---|---|---|---|---|---|---|---|---|---|---|---|---|---|---|---|---|
| ||||||||||||||||||||||||||
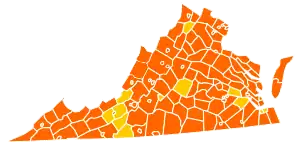
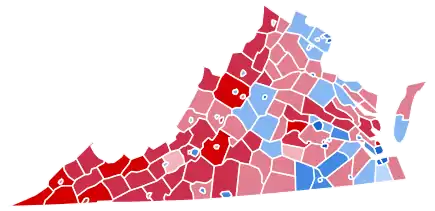 County and Independent City Results
| ||||||||||||||||||||||||||
| ||||||||||||||||||||||||||
Virginia was won by President Obama with 51.16% of the vote to Mitt Romney's 47.28%, a 3.88% margin of victory.[2] Third parties and write-ins received a cumulative 60,147 votes, representing 1.56% of the vote.
In 2008, Obama won the state by 6.30%, becoming the first Democratic presidential nominee to win Virginia since Lyndon B. Johnson's nationwide Democratic landslide of 1964, but it had otherwise been a reliably Republican state prior to this. However, 2008 represented a realignment election for Virginia.[3] Much of the Democratic gains can be attributed to the growth of progressive suburban Northern Virginia, particularly in Fairfax County, Loudoun County, and Prince William County, all of which voted for Obama twice despite becoming Republican strongholds after 1964. The Northern Virginia suburbs are generally dominated by Washington, D.C., the most Democratic region in the country, and increasing minority population has turned Virginia from a Republican to Democratic stronghold. Following this election, as well as the 2013 and 2014 elections, the state of Virginia would not be closely contested by the Republican Party, as margins increased for the Democratic Party statewide post-2014. Obama's increased strength in this heavily populated region more than canceled out his weakness across rural Virginia, which, similar to the rest of Appalachia, actually swung towards the Republican Party in 2008 due to the Democrats' increasingly environmentalist policies. Obama suffered a historically poor showing even in traditionally Democratic counties of Southwest Virginia, similar to his weak performance in neighboring West Virginia. This would ultimately foreshadow 2016, when the Republican nominee won the election without carrying Virginia for the first time since 1924. Despite its narrow margin, it would also begin to solidify Virginia's status as a Democratic stronghold, joining the Blue Wall.
Obama's 2012 win made him the first Democratic president since Franklin Roosevelt to carry Virginia for the Democrats in two consecutive elections. The Democratic margin of victory also made 2012 the first time since 1948 that Virginia was more Democratic than the nation as a whole, albeit by a narrow advantage of 0.02%: Obama carried Virginia by 3.88%, while winning nationally by 3.86%. This was also the first election since 1976 in which Virginia did not vote in the same way as neighboring North Carolina.
As of 2020, this was the last time the Republican nominee won Montgomery County, and the last time the Democratic nominee won Buckingham County in a statewide election, along with the independent city of Covington. It is also the last time the Democratic nominee for President of the United States won Caroline, Essex, Nelson, or Westmoreland counties.
Democratic primary
Because incumbent Democratic President Barack Obama was unopposed by members of his party in seeking reelection, no Democratic primary was held.
Republican primary
| |||||||||||||||||||
| |||||||||||||||||||
 Virginia results by county
Mitt Romney
Ron Paul | |||||||||||||||||||
.jpg.webp)
2012 U.S. presidential election | |
|---|---|
| Democratic Party | |
| Republican Party | |
| Related races | |
| |
The Republican primary took place on Super Tuesday, March 6, 2012.[4][5]
Virginia has 49 delegates to the 2012 Republican National Convention including three unbound superdelegates. 33 delegates are awarded on a winner-take-all basis by congressional district. The other 13 are awarded to the candidate who wins a majority statewide, or allocated proportionally if no one gets majority.[6]
| Virginia Republican primary, March 6, 2012[7][8] | |||
|---|---|---|---|
| Candidate | Votes | Percentage | Delegates[8][9] |
| Mitt Romney | 158,119 | 59.54% | 43 |
| Ron Paul | 107,451 | 40.46% | 3 |
| Uncommitted delegates: | 3 | ||
| Total: | 265,570 | 100.00% | 49 |
Ballot
Only Mitt Romney and Ron Paul appeared on the ballot. Other candidates failed to submit the necessary 10,000 signatures (including at least 400 from each of the state's 11 congressional districts) required to get on the ballot by the deadline of 22 December 2011.[10]
On 27 December, Rick Perry filed a lawsuit – joined later by Michele Bachmann, Newt Gingrich, Jon Huntsman and Rick Santorum – in the federal District Court for the Eastern District of Virginia in Richmond that challenged provisions that determine who can appear on the primary ballot. Perry and the other candidates argued that the chairman of the Virginia Republican Party and members of State Board of Elections violated their rights by enforcing state requirements as to the number of signatures, the qualifications for signers and the requirement that all petition circulators be "an eligible or registered qualified voter in Virginia." Perry and the other litigants argued that these restrictions "impose a severe burden" on their freedoms of speech and association under the First and Fourteenth Amendment.[11][12][13]
The case was Perry v. Judd. U.S. District Judge John A. Gibney, Jr. ruled on 29 December that he would not issue an injunction to stop the printing of ballots before a scheduled hearing on 13 January.[14] The Virginia Attorney General, Ken Cuccinelli, representing the state, made a motion to dismiss the case because of a lack of standing.[15] On 13 January, Judge Gibney, Jr. dismissed the lawsuit citing the equitable doctrine of laches ("sleeping on one's rights"), writing, "They knew the rules in Virginia many months ago... In essence, they played the game, lost, and then complained that the rules were unfair."[16] The United States Court of Appeals for the Fourth Circuit affirmed, emphasizing that the candidate plaintiffs' failure to file in a timely fashion required dismissal.[17]
The final results saw Romney win with 59.54% and 43 delegates of the vote to Ron Paul's 40.46% and 3 delegates.
General election
Candidate ballot access
Polling
The initial polling in 2010 showed Obama leading with margins from 4 to 11 points. In September 2011, the tide changed, and Romney won every poll conducted from September 2011 to December 2011, except one. In January and February 2012, both candidates were neck and neck with neither having a decisive lead. In March, Obama was able to pull ahead and beat Romney in most polls until about late September 2012. On October 4th, Romney won his first poll in a month, 48% to 45%. Throughout October, Romney won every poll but one for nearly three weeks. The latest polls in late October and early November shifted in Obama's favor, and Obama was able to successfully make the race near tied. Although Romney had won the final poll by 2 points, 50% to 48%, the average of the last three polls showed Obama leading 49% to 48%.[18][19]
Results
| Elections in Virginia |
|---|
 |
| United States presidential election in Virginia, 2012[20] | ||||||
|---|---|---|---|---|---|---|
| Party | Candidate | Running mate | Votes | Percentage | Electoral votes | |
| Democratic | Barack Obama (Incumbent) | Joe Biden (Incumbent) | 1,971,820 | 51.16% | 13 | |
| Republican | Mitt Romney | Paul Ryan | 1,822,522 | 47.28% | 0 | |
| Libertarian | Gary Johnson | Jim Gray | 31,216 | 0.81% | 0 | |
| Constitution | Virgil Goode | Jim Clymer | 13,058 | 0.34% | 0 | |
| Green | Jill Stein | Cheri Honkala | 8,627 | 0.22% | 0 | |
| Write-ins | Write-ins | 7,246 | 0.19% | 0 | ||
| Totals | 3,854,489 | 100.00% | 13 | |||
By county/city
| County/City | Obama% | Obama# | Romney% | Romney# | Others% | Others# | Total |
|---|---|---|---|---|---|---|---|
| Accomack | 47.69% | 7,655 | 51.17% | 8,213 | 1.14% | 183 | 16,051 |
| Albemarle | 55.20% | 29,757 | 43.22% | 23,297 | 1.58% | 853 | 53,907 |
| Alleghany | 47.44% | 3,403 | 50.12% | 3,595 | 2.44% | 175 | 7,173 |
| Amelia | 36.01% | 2,490 | 62.63% | 4,331 | 1.36% | 94 | 6,915 |
| Amherst | 39.41% | 5,900 | 59.29% | 8,876 | 1.30% | 194 | 14,970 |
| Appomattox | 30.91% | 2,453 | 67.30% | 5,340 | 1.79% | 142 | 7,935 |
| Arlington | 69.10% | 81,269 | 29.31% | 34,474 | 1.59% | 1,865 | 117,608 |
| Augusta | 28.07% | 9,451 | 70.16% | 23,624 | 1.77% | 597 | 33,672 |
| Bath | 40.22% | 894 | 57.31% | 1,274 | 2.47% | 55 | 2,223 |
| Bedford | 27.28% | 10,209 | 71.29% | 26,679 | 1.43% | 537 | 37,425 |
| Bland | 24.93% | 735 | 72.73% | 2,144 | 2.34% | 69 | 2,948 |
| Botetourt | 29.89% | 5,452 | 68.41% | 12,479 | 1.70% | 310 | 18,241 |
| Brunswick | 62.14% | 4,994 | 36.93% | 2,968 | 0.93% | 75 | 8,037 |
| Buchanan | 32.08% | 3,094 | 66.72% | 6,436 | 1.20% | 116 | 9,646 |
| Buckingham | 50.31% | 3,750 | 47.88% | 3,569 | 1.81% | 135 | 7,454 |
| Campbell | 29.56% | 7,595 | 68.86% | 17,695 | 1.58% | 406 | 25,696 |
| Caroline | 53.30% | 7,276 | 45.06% | 6,151 | 1.65% | 225 | 13,652 |
| Carroll | 28.53% | 3,685 | 67.63% | 8,736 | 3.85% | 497 | 12,918 |
| Charles City | 65.50% | 2,772 | 32.99% | 1,396 | 1.51% | 64 | 4,232 |
| Charlotte | 42.44% | 2,503 | 56.14% | 3,311 | 1.42% | 84 | 5,898 |
| Chesterfield | 45.44% | 77,694 | 53.18% | 90,934 | 1.38% | 2,360 | 170,988 |
| Clarke | 41.73% | 3,239 | 55.35% | 4,296 | 2.92% | 227 | 7,762 |
| Craig | 31.12% | 830 | 65.88% | 1,757 | 3.00% | 80 | 2,667 |
| Culpeper | 40.99% | 8,285 | 57.30% | 11,580 | 1.71% | 346 | 20,211 |
| Cumberland | 47.98% | 2,422 | 50.28% | 2,538 | 1.74% | 88 | 5,048 |
| Dickenson | 35.82% | 2,473 | 61.91% | 4,274 | 2.27% | 157 | 6,904 |
| Dinwiddie | 48.20% | 6,550 | 50.59% | 6,875 | 1.21% | 164 | 13,589 |
| Essex | 53.15% | 3,016 | 45.85% | 2,602 | 1.00% | 57 | 5,675 |
| Fairfax | 59.57% | 315,273 | 39.07% | 206,773 | 1.37% | 7,241 | 529,287 |
| Fauquier | 39.27% | 13,965 | 59.16% | 21,034 | 1.57% | 558 | 35,557 |
| Floyd | 35.74% | 2,732 | 61.13% | 4,673 | 3.13% | 239 | 7,644 |
| Fluvanna | 46.22% | 5,893 | 52.38% | 6,678 | 1.40% | 178 | 12,749 |
| Franklin | 34.04% | 9,090 | 62.60% | 16,718 | 3.37% | 899 | 26,707 |
| Frederick | 34.87% | 12,690 | 62.81% | 22,858 | 2.32% | 846 | 36,394 |
| Giles | 36.14% | 2,730 | 61.70% | 4,660 | 2.16% | 163 | 7,553 |
| Gloucester | 35.08% | 6,764 | 62.94% | 12,137 | 1.98% | 382 | 19,283 |
| Goochland | 35.12% | 4,676 | 63.45% | 8,448 | 1.43% | 191 | 13,315 |
| Grayson | 29.04% | 2,068 | 67.42% | 4,801 | 3.54% | 252 | 7,121 |
| Greene | 36.46% | 3,290 | 61.72% | 5,569 | 1.82% | 164 | 9,023 |
| Greensville | 63.64% | 3,135 | 35.85% | 1,766 | 0.51% | 25 | 4,926 |
| Halifax | 46.53% | 7,766 | 52.08% | 8,694 | 1.39% | 232 | 16,692 |
| Hanover | 30.98% | 18,294 | 67.63% | 39,940 | 1.40% | 824 | 59,058 |
| Henrico | 55.22% | 89,594 | 43.42% | 70,449 | 1.35% | 2,198 | 162,241 |
| Henry | 41.33% | 10,317 | 56.02% | 13,984 | 2.65% | 662 | 24,963 |
| Highland | 32.48% | 459 | 65.39% | 924 | 2.12% | 30 | 1,413 |
| Isle of Wight | 42.07% | 8,761 | 56.67% | 11,802 | 1.27% | 264 | 20,827 |
| James City | 43.35% | 17,879 | 55.39% | 22,843 | 1.26% | 518 | 41,240 |
| King and Queen | 47.74% | 1,745 | 51.03% | 1,865 | 1.23% | 45 | 3,655 |
| King George | 39.53% | 4,477 | 58.31% | 6,604 | 2.15% | 244 | 11,325 |
| King William | 37.48% | 3,344 | 61.26% | 5,466 | 1.27% | 113 | 8,923 |
| Lancaster | 45.24% | 3,149 | 53.91% | 3,753 | 0.85% | 59 | 6,961 |
| Lee | 26.91% | 2,583 | 71.34% | 6,847 | 1.75% | 168 | 9,598 |
| Loudoun | 51.53% | 82,479 | 47.04% | 75,292 | 1.43% | 2,289 | 160,060 |
| Louisa | 42.26% | 6,953 | 56.01% | 9,215 | 1.73% | 284 | 16,452 |
| Lunenburg | 46.81% | 2,684 | 51.78% | 2,969 | 1.41% | 81 | 5,734 |
| Madison | 39.90% | 2,639 | 58.50% | 3,869 | 1.60% | 106 | 6,614 |
| Mathews | 33.62% | 1,807 | 64.91% | 3,488 | 1.47% | 79 | 5,374 |
| Mecklenburg | 45.90% | 6,921 | 52.88% | 7,973 | 1.21% | 183 | 15,077 |
| Middlesex | 38.98% | 2,370 | 59.52% | 3,619 | 1.50% | 91 | 6,080 |
| Montgomery | 48.53% | 19,903 | 48.78% | 20,006 | 2.68% | 1,100 | 41,009 |
| Nelson | 50.56% | 4,171 | 47.84% | 3,947 | 1.60% | 132 | 8,250 |
| New Kent | 32.46% | 3,555 | 66.16% | 7,246 | 1.39% | 152 | 10,953 |
| Northampton | 57.63% | 3,741 | 41.23% | 2,676 | 1.14% | 74 | 6,491 |
| Northumberland | 42.22% | 3,191 | 57.03% | 4,310 | 0.75% | 57 | 7,558 |
| Nottoway | 48.85% | 3,344 | 49.80% | 3,409 | 1.36% | 93 | 6,846 |
| Orange | 42.01% | 6,870 | 56.52% | 9,244 | 1.47% | 240 | 16,354 |
| Page | 36.41% | 3,724 | 62.03% | 6,344 | 1.56% | 160 | 10,228 |
| Patrick | 29.27% | 2,417 | 68.07% | 5,622 | 2.66% | 220 | 8,259 |
| Pittsylvania | 35.39% | 10,858 | 62.78% | 19,263 | 1.83% | 560 | 30,681 |
| Powhatan | 26.33% | 4,088 | 72.14% | 11,200 | 1.53% | 237 | 15,525 |
| Prince Edward | 55.55% | 5,132 | 42.78% | 3,952 | 1.68% | 155 | 9,239 |
| Prince George | 43.57% | 6,991 | 55.33% | 8,879 | 1.10% | 176 | 16,046 |
| Prince William | 57.34% | 103,331 | 41.32% | 74,458 | 1.34% | 2,406 | 180,195 |
| Pulaski | 36.05% | 5,292 | 60.76% | 8,920 | 3.19% | 468 | 14,680 |
| Rappahannock | 45.44% | 1,980 | 53.04% | 2,311 | 1.51% | 66 | 4,357 |
| Richmond | 41.75% | 1,574 | 57.29% | 2,160 | 0.95% | 36 | 3,770 |
| Roanoke | 36.53% | 18,711 | 61.75% | 31,624 | 1.72% | 882 | 51,217 |
| Rockbridge | 40.17% | 4,088 | 57.95% | 5,898 | 1.88% | 191 | 10,177 |
| Rockingham | 28.87% | 10,065 | 69.37% | 24,186 | 1.76% | 615 | 34,866 |
| Russell | 30.76% | 3,718 | 67.67% | 8,180 | 1.57% | 190 | 12,088 |
| Scott | 23.97% | 2,395 | 74.45% | 7,439 | 1.58% | 158 | 9,992 |
| Shenandoah | 33.39% | 6,469 | 64.72% | 12,538 | 1.89% | 366 | 19,373 |
| Smyth | 32.64% | 4,171 | 65.58% | 8,379 | 1.78% | 227 | 12,777 |
| Southampton | 47.90% | 4,437 | 51.09% | 4,733 | 1.01% | 94 | 9,264 |
| Spotsylvania | 43.41% | 25,165 | 54.93% | 31,844 | 1.66% | 965 | 57,974 |
| Stafford | 44.87% | 27,182 | 53.61% | 32,480 | 1.52% | 921 | 60,583 |
| Surry | 59.80% | 2,576 | 38.79% | 1,671 | 1.42% | 61 | 4,308 |
| Sussex | 61.73% | 3,358 | 37.15% | 2,021 | 1.12% | 61 | 5,440 |
| Tazewell | 20.65% | 3,661 | 78.07% | 13,843 | 1.29% | 228 | 17,732 |
| Warren | 38.64% | 6,452 | 59.10% | 9,869 | 2.26% | 377 | 16,698 |
| Washington | 27.61% | 7,076 | 70.77% | 18,141 | 1.62% | 415 | 25,632 |
| Westmoreland | 52.89% | 4,295 | 45.95% | 3,731 | 1.16% | 94 | 8,120 |
| Wise | 25.04% | 3,760 | 73.75% | 11,076 | 1.21% | 182 | 15,018 |
| Wythe | 30.61% | 3,783 | 67.36% | 8,324 | 2.03% | 251 | 12,358 |
| York | 38.83% | 13,183 | 59.51% | 20,204 | 1.67% | 566 | 33,953 |
| Alexandria | 71.11% | 52,199 | 27.58% | 20,249 | 1.31% | 963 | 73,411 |
| Bedford | 43.67% | 1,225 | 54.44% | 1,527 | 1.89% | 53 | 2,805 |
| Bristol | 33.73% | 2,492 | 64.71% | 4,780 | 1.56% | 115 | 7,387 |
| Buena Vista | 36.38% | 919 | 61.92% | 1,564 | 1.70% | 43 | 2,526 |
| Charlottesville | 75.74% | 16,510 | 22.22% | 4,844 | 2.03% | 443 | 21,797 |
| Chesapeake | 49.85% | 55,052 | 48.81% | 53,900 | 1.33% | 1,473 | 110,425 |
| Colonial Heights | 29.50% | 2,544 | 68.89% | 5,941 | 1.61% | 139 | 8,624 |
| Covington | 56.61% | 1,319 | 41.85% | 975 | 1.55% | 36 | 2,330 |
| Danville | 60.47% | 12,218 | 38.42% | 7,763 | 1.10% | 223 | 20,204 |
| Emporia | 66.51% | 1,793 | 32.86% | 886 | 0.63% | 17 | 2,696 |
| Fairfax | 57.19% | 6,651 | 41.06% | 4,775 | 1.75% | 203 | 11,629 |
| Falls Church | 68.93% | 5,015 | 29.51% | 2,147 | 1.57% | 114 | 7,276 |
| Franklin | 64.98% | 2,833 | 34.31% | 1,496 | 0.71% | 31 | 4,360 |
| Fredericksburg | 62.35% | 7,131 | 35.50% | 4,060 | 2.15% | 246 | 11,437 |
| Galax | 39.53% | 900 | 58.50% | 1,332 | 1.98% | 45 | 2,277 |
| Hampton | 70.64% | 46,966 | 28.03% | 18,640 | 1.33% | 884 | 66,490 |
| Harrisonburg | 55.50% | 8,654 | 42.10% | 6,565 | 2.40% | 375 | 15,594 |
| Hopewell | 57.35% | 5,179 | 41.40% | 3,739 | 1.25% | 113 | 9,031 |
| Lexington | 55.30% | 1,486 | 42.65% | 1,146 | 2.05% | 55 | 2,687 |
| Lynchburg | 43.76% | 15,948 | 54.34% | 19,806 | 1.90% | 694 | 36,448 |
| Manassas | 55.78% | 8,478 | 42.52% | 6,463 | 1.70% | 259 | 15,200 |
| Manassas Park | 61.83% | 2,879 | 36.49% | 1,699 | 1.68% | 78 | 4,656 |
| Martinsville | 61.35% | 3,855 | 36.79% | 2,312 | 1.86% | 117 | 6,284 |
| Newport News | 64.32% | 51,100 | 34.28% | 27,230 | 1.40% | 1,114 | 79,444 |
| Norfolk | 72.02% | 62,687 | 26.59% | 23,147 | 1.39% | 1,209 | 87,043 |
| Norton | 37.94% | 566 | 59.99% | 895 | 2.08% | 31 | 1,492 |
| Petersburg | 89.79% | 14,283 | 09.60% | 1,527 | 0.62% | 98 | 15,908 |
| Poquoson | 23.63% | 1,679 | 74.75% | 5,312 | 1.62% | 115 | 7,106 |
| Portsmouth | 70.77% | 32,501 | 28.00% | 12,858 | 1.23% | 563 | 45,922 |
| Radford | 50.60% | 2,732 | 46.68% | 2,520 | 2.72% | 147 | 5,399 |
| Richmond | 77.81% | 75,921 | 20.55% | 20,050 | 1.64% | 1,598 | 97,569 |
| Roanoke | 60.10% | 24,134 | 37.33% | 14,991 | 2.57% | 1,030 | 40,155 |
| Salem | 38.64% | 4,760 | 59.25% | 7,299 | 2.10% | 259 | 12,318 |
| Staunton | 51.10% | 5,728 | 47.03% | 5,272 | 1.87% | 210 | 11,210 |
| Suffolk | 57.01% | 24,267 | 41.86% | 17,820 | 1.13% | 479 | 42,566 |
| Virginia Beach | 47.95% | 94,299 | 50.49% | 99,291 | 1.55% | 3,051 | 196,641 |
| Waynesboro | 43.68% | 3,840 | 54.49% | 4,790 | 1.83% | 161 | 8,791 |
| Williamsburg | 63.28% | 4,903 | 34.62% | 2,682 | 2.10% | 163 | 7,748 |
| Winchester | 49.48% | 5,094 | 48.04% | 4,946 | 2.49% | 256 | 10,296 |
Counties that flipped from Democratic to Republican
- King and Queen (largest community: King and Queen Court House)
- Montgomery (largest town: Blacksburg)
Analysis
Despite Indiana and neighboring North Carolina flipping back into the Republican column, Virginia remained in the Democratic column, voting for President Obama with a margin of 3.88%, albeit a reduced margin from 2008 when he carried it by 6.30%.[21] 2008 was the first time a Democrat carried the state of Virginia since Lyndon B. Johnson carried it in his landslide 1964 election.[22] Republican support, which had been anchored by the historically Republican D.C. suburbs, dwindled as the population grew. According to 270toWin, Obama carried Northern Virginia by 59.8% to Romney's 38.8%, a 21% margin, a great improvement from Al Gore's 3.2% win against George W. Bush in 2000 and John Kerry's 7.9% win against Bush in 2004.[3] The leftward shift of college-educated whites and dominance by the unabashedly liberal District of Columbia only furthered Democratic margins. Widening margins in Northern Virginia allowed Obama to counteract losses in Southwest Virginia as the Democrats increasingly supported environmentalist policies making them unpopular amongst Appalachian voters. Consequently, Democrats were able to comfortably carry it in every election following 2008: a Republican hasn't won statewide public office in Virginia since Bob McDonnell won the 2009 gubernatorial election.
According to exit polls from The New York Times,[23] voter demographics were split. Romney carried men 51-47 while Obama carried women 54-45. Men and women make up 47% and 53% of the electorate, respectively. While Romney expectedly carried white voters in a 61-37 landslide, Obama was able to offset these wins with 93-6, 64-33, and 66-32 landslides among African Americans, Hispanics, and Asians, respectively. Cumulatively, these minorities consisted of 28% of the electorate. Splits among age groups were also obvious: voters 18 to 29 and 30 to 44 favored Obama 61-36 and 54-45, respectively, while voters aged 46-64 favored the Republican ticket 53-44 and 65+ favored them 54-46. Romney was able to carry three of four education groups: those with no, some, or a college degree favored Romney by narrow margins of 50-49, 51-47, and 50-48, respectively, but Obama cancelled out these wins with a 57-42 win among postgraduates. Respectively, these groups comprise 46%, 25%, 30%, and 24% of voters. Self-identified moderates were carried by Obama 56-42, but Independents flipped back into the Republican column, backing Romney 54-43 after backing Obama by 1 percentage point in 2008.
Economic status also showed a clear political divide in exit polls. The president's strength came from lower-income voters: he carried those with an income under $30,000 by 61-38 and an income $30,000 to $50,000 by 60-38. Meanwhile, Romney carried those making over $50,000 by 52-47 and over $100,000 by 51-47. However, Romney's close win among the upper middle class was a good sign for Democrats: Bush carried them 57-43 in 2004, a 14-point win, and it solidified suburban Northern Virginia's shift left.
In terms of county performance, Romney flipped two counties back into the Republican column, including Montgomery, home to Virginia Tech in Blacksburg.[21] King and Queen County also returned to the Republican column. Obama racked up his greatest margins in independent cities, where he received upwards of 70% of the vote in many of them. Petersburg gave 89.79% of its vote to the Democratic ticket. On the opposite end of the spectrum, Romney's best performances were in Southwest Virginia and the Shenandoah Valley, where he garnered over 60% of ballots cast.
Despite polls predicting a close race, Obama's comfortable margin in the Old Dominion solidified the state's shift to the Democrats.[24] In 2016, Democrat Hillary Clinton would win the state by 5.32% against Donald Trump, one of the few state's where she improved on Obama's margins despite losing the election nationwide.[25] In 2020, then-Vice President and now-President Joe Biden won the state by 10.11%, the best margin for a Democrat since Franklin D. Roosevelt's 24.97% margin in 1944.[26]
See also
References
- Dr. Michael McDonald (December 31, 2012). "2012 General Election Turnout Rates". George Mason University. Archived from the original on April 24, 2013. Retrieved March 4, 2013.
- "VA Board of Elections". Archived from the original on May 10, 2013. Retrieved August 3, 2013.
- Savicki, Drew (July 20, 2020). "The Road to 270: Virginia". 270toWin. Retrieved December 4, 2020.
- "Primary and Caucus Printable Calendar". CNN. Retrieved January 12, 2012.
- "Presidential Primary Dates" (PDF). Federal Election Commission. Retrieved January 23, 2012.
- Nate Silver (March 4, 2012). "Romney Could Win Majority of Super Tuesday Delegates". FiveThirtyEight. Retrieved March 5, 2012.
- "Archived copy". Archived from the original on 2012-12-05. Retrieved 2012-03-22.CS1 maint: archived copy as title (link)
- "Virginia Republican". March 6, 2012. Retrieved March 6, 2012.
- "Super Tuesday Delegate Count". DemocraticConventionWatch.com. March 6, 2012. Archived from the original on December 8, 2012. Retrieved March 6, 2012.
- Anita Kumar, "Gingrich, Perry disqualified from Va. primary ballot" (December 24, 2011).
- Martin Weil and Anita Kumar. "" (December 27, 2011). Washington Post.
- Catalina Camia, "Perry sues to get on Virginia ballot" (December 28, 2011). USA Today.
- Kevin Liptak, "Candidates join Perry's Virginia lawsuit" (December 31, 2011). CNN.
- Rebecca Kaplan, "Perry Hearing on Virginia Ballot Challenge Set for Jan. 13 Archived 2012-03-04 at the Wayback Machine" (December 29, 2011). National Journal.
- Tom Schoenberg, "Virginia Argues Perry Can't Challenge Ballot" (January 4, 2012). Bloomberg.
- Catalina Camia, "Judge rejects Perry, GOP hopefuls for Va. ballot" (January 13, 2012). USA Today.
- Perry v. Judd, Unpublished E.D. Va. (2012).
- https://www.realclearpolitics.com/epolls/2012/president/va/virginia_romney_vs_obama-1774.html#polls
- https://uselectionatlas.org/POLLS/PRESIDENT/2012/polls.php?fips=51
- http://clerk.house.gov/member_info/electionInfo/2012election.pdf
- "Virginia - Election Results 2008". The New York Times. November 4, 2008. Retrieved December 4, 2020.
- "Virginia Presidential Election Voting History". 270toWin. Retrieved December 4, 2020.
- "President Exit Polls". The New York Times. ISSN 0362-4331. Retrieved 2020-12-05.
- Cohen, Micah (November 4, 2012). "In Virginia, It's Tradition Versus Change". FiveThirtyEight. Retrieved December 4, 2020.
- "Virginia Election Results 2016". The New York Times. 2017-08-01. ISSN 0362-4331. Retrieved 2020-12-05.
- "Virginia Election Results". The New York Times. 2020-11-03. ISSN 0362-4331. Retrieved 2020-12-05.
External links
- The Green Papers: for Virginia
- The Green Papers: Major state elections in chronological order