List of cities in Australia by population
This list of Australian cities by population provides rankings of Australian cities and towns according to various systems defined by the Australian Bureau of Statistics. The eight Greater Capital City Statistical Areas are listed for the state and territory capital cities. All Significant Urban Areas, representing urban agglomerations of over 10,000 population, are listed next. The fifty largest Urban Centres (built-up area) are ranked, and lastly the fifty largest Local Government Areas, the units of local government below the states and territories, are also ranked.
Greater capital city statistical areas by population
Each capital city forms its own Greater Capital City Statistical Area (GCCSA), which according to the Australian Bureau of Statistics (ABS) represents a broad functional definition of each of the eight state and territory capital cities.[1] In Australia, the population of the GCCSA is the most-often quoted figure for the population of capital cities. These units correspond broadly to the international concept of metropolitan areas.
| Rank | Greater Capital City Statistical Area | June 2019 estimated resident population[2] | 2018-19 growth[2] | 2018-19 % change[2] |
|---|---|---|---|---|
| 1 | Greater Sydney | 5,312,163 | 87,065 | 1.7 |
| 2 | Greater Melbourne | 5,078,193 | 113,480 | 2.3 |
| 3 | Greater Brisbane | 2,514,184 | 52,587 | 2.1 |
| 4 | Greater Perth | 2,085,973 | 27,405 | 1.3 |
| 5 | Greater Adelaide | 1,359,760 | 13,900 | 1.0 |
| 6 | Australian Capital Territory[lower-alpha 1] (Canberra) | 426,704 | 6,325 | 1.5 |
| 7 | Greater Hobart | 236,136 | 3,445 | 1.5 |
| 8 | Greater Darwin | 147,255 | -1,141 | -0.8 |
- Notes
- The GCCSA for Canberra covers the entire ACT, and is formally titled as such.
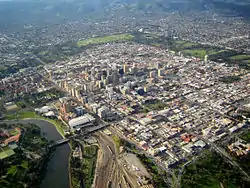
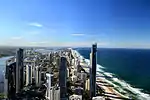
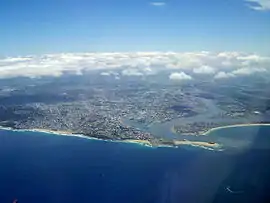
Significant urban areas by population
The following ranks the SUAs, including those of the capital cities (which are smaller than their respective GCCSAs, except for Canberra's, which includes adjacent Queanbeyan, in New South Wales). Capitals are in bold. Significant Urban Areas are defined to represent significant towns and cities, or agglomerations of smaller towns, that have at least 10,000 total population. Significant Urban Areas may contain more than one distinct Urban Centre.
.jpg.webp)
.jpg.webp)
| Rank | Significant Urban Areas |
State/territory | Population | Growth | % of national population (June 2019) | |
|---|---|---|---|---|---|---|
| Estimated resident population, June 2019[3] |
2011 Census[4] | |||||
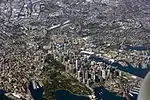
| 1 | Sydney | New South Wales | 4,914,343 | 4,231,954 | +19.10% | 20.93% |
| 2 | Melbourne | Victoria | 4,893,870 | 3,999,982 | +24.08% | 19.86% |
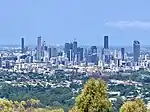
| 3 | Brisbane | Queensland | 2,430,180 | 2,065,996 | +19.20% | 9.85% |
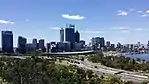
| 4 | Perth | Western Australia | 2,045,479 | 1,728,867 | +19.12% | 8.24% |
| 5 | Adelaide | South Australia | 1,340,794 | 1,262,940 | +6.56% | 5.38% |
| 6 | Gold Coast–Tweed Heads | Queensland/New South Wales | 693,671 | 557,822 | +21.75% | 2.72% |
| 7 | Newcastle–Maitland | New South Wales | 491,474 | 398,770 | +22.05% | 1.95% |
| 8 | Canberra–Queanbeyan | Australian Capital Territory/New South Wales | 462,136 | 391,645 | +16.83% | 1.83% |
| 9 | Sunshine Coast | Queensland | 341,069 | 270,770 | +23.14% | 1.33% |
| 10 | Central Coast | New South Wales | 335,470 | 297,713 | +12.68% | 1.31% |
| 11 | Wollongong | New South Wales | 306,034 | 268,944 | +12.57% | 1.21% |
| 12 | Geelong | Victoria | 275,794 | 173,454 | +54.67% | 1.07% |
| 13 | Hobart | Tasmania | 216,682 | 211,656 | +9.90% | 0.93% |
| 14 | Townsville | Queensland | 181,668 | 162,292 | +11.42% | 0.72% |
| 15 | Cairns | Queensland | 153,951 | 133,911 | +14.05% | 0.61% |
| 16 | Toowoomba | Queensland | 138,223 | 105,984 | +29.13% | 0.55% |
| 17 | Darwin | Northern Territory | 133,331 | 120,586 | +23.20% | 0.59% |
| 18 | Ballarat | Victoria | 107,652 | 91,801 | +14.89% | 0.42% |
| 19 | Bendigo | Victoria | 100,991 | 86,079 | +15.15% | 0.40% |
| 20 | Albury–Wodonga | New South Wales/Victoria | 94,837 | 82,083 | +14.03% | 0.37% |
| 21 | Launceston | Tasmania | 88,178 | 82,220 | +6.21% | 0.35% |
| 22 | Mackay | Queensland | 80,264 | 77,293 | +3.69% | 0.32% |
| 23 | Rockhampton | Queensland | 79,081 | 73,681 | +6.67% | 0.31% |
| 24 | Bunbury | Western Australia | 74,591 | 65,608 | +13.34% | 0.30% |
| 25 | Coffs Harbour | New South Wales | 72,541 | 64,243 | +11.80% | 0.29% |
| 26 | Melton | Victoria | 72,177 | 45,624 | +58.20% | 0.29% |
| 27 | Bundaberg | Queensland | 71,309 | 67,341 | +5.32% | 0.28% |
| 28 | Wagga Wagga | New South Wales | 56,675 | 52,042 | +8.45% | 0.23% |
| 29 | Hervey Bay | Queensland | 55,345 | 48,680 | +12.31% | 0.22% |
| 30 | Mildura–Wentworth | Victoria/New South Wales | 52,176 | 47,536 | +9.19% | 0.21% |
| 31 | Shepparton–Mooroopna | Victoria | 52,104 | 46,505 | +11.02% | 0.21% |
| 32 | Port Macquarie | New South Wales | 48,723 | 41,723 | +14.98% | 0.19% |
| 33 | Gladstone–Tannum Sands | Queensland | 45,631 | 41,966 | +7.54% | 0.18% |
| 34 | Tamworth | New South Wales | 43,188 | 38,735 | +10.68% | 0.17% |
| 35 | Traralgon–Morwell | Victoria | 42,249 | 39,705 | +5.74% | 0.17% |
| 36 | Orange | New South Wales | 40,804 | 36,468 | +11.04% | 0.16% |
| 37 | Bowral–Mittagong | New South Wales | 40,411 | 34,858 | +14.43% | 0.16% |
| 38 | Busselton | Western Australia | 39,618 | 30,286 | +28.51% | 0.16% |
| 39 | Warragul–Drouin | Victoria | 39,217 | 29,944 | +26.66% | 0.15% |
| 40 | Dubbo | New South Wales | 38,767 | 33,997 | +12.93% | 0.15% |
| 41 | Nowra–Bomaderry | New South Wales | 37,838 | 33,338 | +12.24% | 0.15% |
| 42 | Geraldton | Western Australia | 37,255 | 35,749 | +5.31% | 0.15% |
| 43 | Bathurst | New South Wales | 37,191 | 32,479 | +13.31% | 0.15% |
| 44 | Warrnambool | Victoria | 35,523 | 32,380 | +8.75% | 0.14% |
| 45 | Albany | Western Australia | 34,367 | 30,656 | +11.58% | 0.14% |
| 46 | Devonport | Tasmania | 30,629 | 29,051 | +4.29% | 0.12% |
| 47 | Mount Gambier | South Australia | 29,767 | 27,756 | +6.78% | 0.12% |
| 48 | Kalgoorlie–Boulder | Western Australia | 29,326 | 30,842 | −3.22% | 0.12% |
| 49 | Lismore | New South Wales | 28,576 | 28,285 | +1.54% | 0.11% |
| 50 | Nelson Bay | New South Wales | 28,276 | 25,074 | +11.87% | 0.11% |
| 51 | Burnie–Wynyard | Tasmania | 27,343 | 26,869 | +1.15% | 0.11% |
| 52 | Maryborough | Queensland | 27,286 | 26,214 | +4.07% | 0.11% |
| 53 | Victor Harbor–Goolwa | South Australia | 26,921 | 23,850 | +11.25% | 0.11% |
| 54 | Ballina | New South Wales | 26,625 | 23,509 | +12.22% | 0.11% |
| 55 | Taree | New South Wales | 26,394 | 25,421 | +3.78% | 0.11% |
| 56 | Alice Springs | Northern Territory | 26,390 | 25,186 | +5.35% | 0.11% |
| 57 | Morisset–Cooranbong | New South Wales | 25,662 | 21,774 | +16.23% | 0.10% |
| 58 | Armidale | New South Wales | 24,584 | 22,464 | +9.08% | 0.10% |
| 59 | Goulburn | New South Wales | 24,070 | 21,484 | +10.94% | 0.10% |
| 60 | Bacchus Marsh | Victoria | 22,964 | 14,931 | +48.29% | 0.09% |
| 61 | Gisborne–Macedon | Victoria | 22,141 | 18,013 | +22.91% | 0.09% |
| 62 | Gympie | Queensland | 21,868 | 19,510 | +10.71% | 0.09% |
| 63 | Whyalla | South Australia | 21,638 | 21,991 | −1.13% | 0.09% |
| 64 | Echuca–Moama | Victoria/New South Wales | 21,392 | 19,309 | +10.01% | 0.08% |
| 65 | Forster–Tuncurry | New South Wales | 21,221 | 19,500 | +6.51% | 0.08% |
| 66 | Griffith | New South Wales | 20,399 | 17,900 | +13.13% | 0.08% |
| 67 | St Georges Basin–Sanctuary Point | New South Wales | 19,555 | 12,611 | +52.65% | 0.08% |
| 68 | Wangaratta | Victoria | 19,411 | 17,686 | +9.23% | 0.08% |
| 69 | Yeppoon | Queensland | 19,267 | 16,372 | +16.07% | 0.08% |
| 70 | Murray Bridge | South Australia | 19,078 | 16,708 | +12.40% | 0.08% |
| 71 | Grafton | New South Wales | 19,046 | 18,359 | +3.92% | 0.08% |
| 72 | Mount Isa | Queensland | 18,310 | 20,569 | −9.63% | 0.07% |
| 73 | Camden Haven | New South Wales | 18,149 | 15,741 | +13.30% | 0.07% |
| 74 | Broken Hill | New South Wales | 17,479 | 18,517 | −4.23% | 0.07% |
| 75 | Karratha | Western Australia | 17,102 | 16,476 | +1.41% | 0.07% |
| 76 | Moe–Newborough | Victoria | 16,821 | 16,674 | +0.83% | 0.07% |
| 77 | Horsham | Victoria | 16,589 | 15,894 | +3.90% | 0.07% |
| 78 | Batemans Bay | New South Wales | 16,553 | 15,733 | +4.78% | 0.07% |
| 79 | Ulladulla | New South Wales | 16,495 | 14,149 | +14.59% | 0.06% |
| 80 | Port Lincoln | South Australia | 16,418 | 15,221 | +7.26% | 0.07% |
| 81 | Singleton | New South Wales | 16,277 | 16,135 | +1.31% | 0.07% |
| 82 | Bairnsdale | Victoria | 15,565 | 13,243 | +16.37% | 0.06% |
| 83 | Kempsey | New South Wales | 15,378 | 14,494 | +5.62% | 0.06% |
| 84 | Warwick | Queensland | 15,277 | 14,607 | +5.29% | 0.06% |
| 85 | Sale | Victoria | 15,135 | 14,258 | +5.35% | 0.06% |
| 86 | Yanchep | Western Australia | 14,612 | 4,247 | 244.05% | 0.06% |
| 87 | Ulverstone | Tasmania | 14,552 | 14,109 | +2.70% | 0.06% |
| 88 | Port Hedland | Western Australia | 14,476 | 13,772 | +3.98% | 0.06% |
| 89 | Broome | Western Australia | 14,371 | 12,766 | +13.15% | 0.06% |
| 90 | Emerald | Queensland | 14,290 | 13,219 | +6.81% | 0.06% |
| 91 | Port Pirie | South Australia | 14,162 | 14,043 | +1.03% | 0.06% |
| 92 | Port Augusta | South Australia | 13,561 | 13,658 | +1.03% | 0.06% |
| 93 | Lithgow | New South Wales | 12,907 | 12,249 | +5.91% | 0.05% |
| 94 | Colac | Victoria | 12,574 | 11,778 | +6.53% | 0.05% |
| 95 | Mudgee | New South Wales | 12,518 | 10,483 | +18.38% | 0.05% |
| 96 | Muswellbrook | New South Wales | 12,372 | 11,791 | +4.86% | 0.05% |
| 97 | Esperance | Western Australia | 12,130 | 11,432 | +6.24% | 0.05% |
| 98 | Parkes | New South Wales | 11,208 | 10,941 | +2.59% | 0.04% |
| 99 | Swan Hill | Victoria | 11,089 | 10,430 | +6.45% | 0.04% |
| 100 | Portland | Victoria | 10,928 | 10,715 | +1.73% | 0.04% |
| 101 | Kingaroy | Queensland | 10,306 | 9,808 | +6.02% | 0.04% |
50 largest urban centres by population
Urban centres are defined by the Australian Bureau of Statistics as being a population cluster of 1000 or more people. For statistical purposes, people living in urban centres are classified as urban. The figures below represent the populations of the contiguous built-up areas of each city; with State and territory capitals in bold. These figures are only updated every census, as the ABS does not render population projections for Urban Centres, and as such can only be as up-to-date as the most recent census year.
| Rank (2016) |
Urban Centre | Estimated resident population | GCCSA (if part of larger statistical area) |
Ranking in state or territory, 2016 | |||||||||||||
|---|---|---|---|---|---|---|---|---|---|---|---|---|---|---|---|---|---|
| 2016 census | 2011 census | 2006 census | ACT | NSW | NT | Qld | SA | Tas | WA | Vic | |||||||
| 1 | Sydney | 4,321,535 | [5] | 3,908,642 | [6] | 3,641,422 | [7] | Sydney | 1 | ||||||||
| 2 | Melbourne | 4,196,198 | [8] | 3,707,530 | [9] | 3,371,888 | [10] | Melbourne | 1 | ||||||||
| 3 | Brisbane | 2,054,614 | [11] | 1,874,427 | [12] | 1,676,389 | [13] | Brisbane | 1 | ||||||||
| 4 | Perth | 1,874,578 | [14] | 1,627,576 | [15] | 1,256,035 | [16] | Perth | 1 | ||||||||
| 5 | Adelaide | 1,165,632 | [17] | 1,103,979 | [18] | 1,040,719 | [19] | Adelaide | 1 | ||||||||
| 6 | Gold Coast–Tweed Heads | 600,335 | [20][21] | 533,660 | [22][23] | 454,436 | [24][25] | 2 | 2 | ||||||||
| 7 | Canberra–Queanbeyan | 431,668 | [26][27] | 391,474 | [28][29] | 356,120 | [30][31] | Canberra | 1 | 3 | |||||||
| 8 | Newcastle | 322,278 | [32] | 308,308 | [33] | 288,732 | [34] | Newcastle | 4 | ||||||||
| 9 | Central Coast | 307,742 | [35] | 297,713 | [36] | 282,726 | [37] | Sydney | 5 | ||||||||
| 10 | Wollongong | 261,896 | [38] | 245,942 | [39] | 234,482 | [40] | 6 | |||||||||
| 11 | Sunshine Coast | 243,377 | [41] | 209,263 | [42] | 184,662 | [43] | 3 | |||||||||
| 12 | Hobart | 178,009 | [44] | 170,975 | [45] | 128,557 | [46] | Hobart | 1 | ||||||||
| 13 | Townsville | 168,729 | [47] | 157,748 | [48] | 128,808 | [49] | Townsville | 4 | ||||||||
| 14 | Geelong | 157,104 | [50] | 143,291 | [51] | 137,220 | [52] | 2 | |||||||||
| 15 | Cairns | 144,730 | [53] | 133,893 | [54] | 98,349 | [55] | Cairns | 5 | ||||||||
| 16 | Darwin | 118,456 | [56] | 103,016 | [57] | 89,905 | [58][59] | Darwin | 1 | ||||||||
| 17 | Toowoomba | 100,032 | [60] | 96,597 | [61] | 95,265 | [62] | 6 | |||||||||
| 18 | Ballarat | 93,759 | [63] | 85,935 | [64] | 78,221 | [65] | 3 | |||||||||
| 19 | Bendigo | 92,379 | [66] | 82,794 | [67] | 76,051 | [68] | 4 | |||||||||
| 20 | Mandurah | 83,294 | [69][70] | 75,306 | [71][72] | 71,097 | [73][74] | Perth | 2 | ||||||||
| 21 | Albury–Wodonga | 83,104 | [75][76] | 77,232 | [71][77] | 73,497 | [78][79] | 7 | 5 | ||||||||
| 22 | Maitland | 78,015 | [80] | 67,132 | [81] | 61,431 | [82] | Newcastle | 8 | ||||||||
| 23 | Mackay | 75,710 | [83] | 74,219 | [84] | 66,874 | [85] | 7 | |||||||||
| 24 | Launceston | 75,329 | [86] | 74,085 | [87] | 71,395 | [88] | 2 | |||||||||
| 25 | Bunbury | 71,090 | [89] | 64,385 | [90] | 54,482 | [91] | 3 | |||||||||
| 26 | Rockhampton | 61,214 | [92] | 61,724 | [93] | 60,827 | [94] | 8 | |||||||||
| 27 | Melton | 54,456 | [95] | 45,624 | [96] | 35,490 | [97] | Melbourne | 6 | ||||||||
| 28 | Hervey Bay | 52,073 | [98] | 48,680 | [99] | 41,225 | [100] | 9 | |||||||||
| 29 | Bundaberg | 50,148 | [101] | 49,750 | [102] | 46,961 | [103] | 10 | |||||||||
| 30 | Wagga Wagga | 48,263 | [104] | 46,913 | [105] | 46,735 | [106] | 9 | |||||||||
| 31 | Coffs Harbour | 48,225 | [107] | 45,580 | [108] | 26,353 | [109] | 10 | |||||||||
| 32 | Shepparton–Mooroopna | 46,199 | [110] | 42,741 | [111] | 38,773 | [112] | 7 | |||||||||
| 33 | Port Macquarie | 44,814 | [113] | 41,491 | [114] | 39,219 | [115] | 11 | |||||||||
| 34 | Orange | 37,182 | [116] | 34,992 | [117] | 31,544 | [118] | 12 | |||||||||
| 35 | Mildura–Buronga | 35,598 | [119][120] | 33,432 | [121][122] | 30,823 | [123][124] | 13 | 8 | ||||||||
| 36 | Sunbury | 34,425 | [125] | 33,062 | [126] | 29,566 | [127] | Melbourne | 9 | ||||||||
| 37 | Dubbo | 34,339 | [128] | 32,327 | [129] | 30,574 | [130] | 14 | |||||||||
| 38 | Tamworth | 33,885 | [131] | 36,131 | [132] | 33,475 | [133] | 15 | |||||||||
| 39 | Bathurst | 33,587 | [134] | 31,294 | [135] | 28,992 | [136] | 16 | |||||||||
| 40 | Gladstone | 33,418 | [137] | 32,073 | [138] | 28,808 | [139] | 11 | |||||||||
| 41 | Geraldton | 31,982 | [140] | 31,349 | [141] | 27,420 | [142] | 4 | |||||||||
| 42 | Nowra–Bomaderry | 30,853 | [143] | 27,988 | [144] | 27,478 | [145] | 17 | |||||||||
| 43 | Warrnambool | 30,709 | [146] | 29,284 | [147] | 28,150 | [148] | 10 | |||||||||
| 44 | Kalgoorlie–Boulder | 29,875 | [149] | 30,840 | [150] | 28,242 | [151] | 5 | |||||||||
| 45 | Albany | 29,373 | [152] | 26,643 | [153] | 25,196 | [154] | 6 | |||||||||
| 46 | Lismore | 27,569 | [155] | 27,474 | [156] | 27,069 | [157] | 18 | |||||||||
| 47 | Gawler | 26,472 | [158] | 23,957 | [159] | 20,006 | [160] | Adelaide | 2 | ||||||||
| 48 | Mount Gambier | 26,148 | [161] | 25,199 | [162] | 23,494 | [163] | 3 | |||||||||
| 49 | Traralgon | 25,485 | [164] | 24,590 | [165] | 21,960 | [166] | 11 | |||||||||
| 50 | Busselton | 25,329 | [167] | 21,407 | [168] | 15,386 | [169] | 7 | |||||||||
50 largest local government areas by population
Local government areas (LGAs) are the main units of local government in Australia. They may be termed cities, shires, councils or other names, and all function similarly. Local government areas cover around 90 per cent of the nation. Significant sections of South Australia and New South Wales are unincorporated, that is, have no defined local government, along with the ACT and smaller sections of Northern Territory and Victoria. Brisbane, which covers multiple LGAs, is the only state capital city with a local government area covering a significant portion of its urban area. Other capital cities are serviced by LGAs which cover a much smaller proportion of their total urban areas.
The following table lists local government areas ranked by order based on the estimated population as sourced from the Australian Bureau of Statistics product Regional Population Growth, Australia, 2017-18 (catalog 3218.0).
| Rank (2019) |
Local government area | Estimated resident population[170] | Ranking in state or territory, 2019 | ||||||
|---|---|---|---|---|---|---|---|---|---|
| 2019 | 2018 | Qld | NSW | WA | Vic | SA | |||
| 1 | City of Brisbane | 1,253,982 | 1,230,938 | 1 | |||||
| 2 | City of Gold Coast | 620,518 | 606,528 | 2 | |||||
| 3 | Moreton Bay Region | 469,465 | 459,456 | 3 | |||||
| 4 | City of Canterbury-Bankstown | 377,917 | 373,486 | 1 | |||||
| 5 | City of Blacktown | 366,534 | 357,839 | 2 | |||||
| 6 | City of Casey | 353,872 | 340,443 | 1 | |||||
| 7 | Central Coast Council | 343,968 | 341,693 | 3 | |||||
| 8 | City of Logan | 334,358 | 326,494 | 4 | |||||
| 9 | Sunshine Coast Region | 328,428 | 319,837 | 5 | |||||
| 10 | Northern Beaches Council | 273,499 | 271,027 | 4 | |||||
| 11 | City of Wyndham | 270,487 | 255,367 | 2 | |||||
| 12 | City of Greater Geelong | 258,934 | 252,229 | 3 | |||||
| 13 | City of Parramatta Council | 257,197 | 251,065 | 5 | |||||
| 14 | City of Sydney | 246,343 | 240,102 | 6 | |||||
| 15 | Cumberland Council | 241,521 | 236,599 | 7 | |||||
| 16 | City of Hume | 233,471 | 224,423 | 4 | |||||
| 17 | Sutherland Shire | 230,611 | 228,980 | 8 | |||||
| 18 | City of Whittlesea | 230,238 | 223,347 | 5 | |||||
| 19 | City of Liverpool | 227,585 | 223,025 | 9 | |||||
| 20 | City of Ipswich | 222,307 | 213,568 | 6 | |||||
| 21 | City of Stirling | 221,040 | 220,135 | 1 | |||||
| 22 | City of Wollongong | 218,114 | 215,856 | 10 | |||||
| 23 | City of Penrith | 212,977 | 208,947 | 11 | |||||
| 24 | City of Fairfield | 211,695 | 210,417 | 12 | |||||
| 25 | City of Brimbank | 209,523 | 208,744 | 6 | |||||
| 26 | City of Wanneroo | 208,237 | 203,609 | 2 | |||||
| 27 | City of Lake Macquarie | 205,901 | 204,694 | 13 | |||||
| 28 | City of Monash | 202,847 | 200,212 | 7 | |||||
| 29 | Inner West Council | 200,811 | 197,836 | 14 | |||||
| 30 | City of Townsville | 195,032 | 194,019 | 7 | |||||
| 31 | City of Moreland | 185,767 | 181,780 | 8 | |||||
| 32 | City of Boroondara | 183,199 | 181,376 | 9 | |||||
| 33 | City of Melbourne | 178,955 | 170,317 | 10 | |||||
| 34 | City of Whitehorse | 178,739 | 176,273 | 11 | |||||
| 35 | Bayside Council | 178,396 | 174,218 | 15 | |||||
| 36 | The Hills Shire | 177,969 | 172,339 | 16 | |||||
| 37 | City of Onkaparinga | 172,938 | 171,496 | 1 | |||||
| 38 | City of Campbelltown (New South Wales) | 170,943 | 167,930 | 17 | |||||
| 39 | Toowoomba Region | 169,008 | 167,611 | 8 | |||||
| 40 | City of Greater Dandenong | 168,201 | 166,140 | 12 | |||||
| 41 | Shire of Mornington Peninsula | 167,636 | 165,823 | 13 | |||||
| 42 | Cairns Region | 166,862 | 165,462 | 9 | |||||
| 43 | City of Kingston | 165,782 | 163,452 | 14 | |||||
| 44 | City of Newcastle | 165,571 | 163,943 | 18 | |||||
| 45 | City of Melton | 164,895 | 156,718 | 15 | |||||
| 46 | City of Knox | 164,538 | 163,212 | 16 | |||||
| 47 | City of Darebin | 164,184 | 161,653 | 17 | |||||
| 48 | City of Joondalup | 159,806 | 159,997 | 3 | |||||
| 49 | Georges River Council | 159,471 | 158,283 | 19 | |||||
| 50 | Yarra Ranges Shire | 159,462 | 158,171 | 18 | |||||
Apart from the City of Brisbane, the populations of the central local government areas in other capitals are either modest or relatively small. In June 2019, Sydney had 246,343, Melbourne 178,955, Darwin 82,886, Hobart 54,649, Perth 28,832, and Adelaide 25,456.[170] Generally speaking, there are many suburban local government areas in most Australian capitals that are significantly larger in population than the central business district local government area.
See also
- Demographics of Australia
- List of towns and cities in Australia by year of settlement
- List of cities in Australia
- List of places in Queensland by population
- List of places in South Australia by population
- List of places in Victoria by population
- List of places in Western Australia by population
- List of cities in Oceania by population
- World's largest cities
Definitions
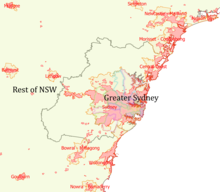
Illustrated are the various statistical areas defined by the Australian Bureau of Statistics for Sydney and its surrounds. The extent of the Greater Sydney greater capital city statistical area is designated by thick grey line and black text. The greater capital city statistical areas are the eight unique statistical divisions delineating the broadest possible concept of each state or territory capital city, constructed from one or more whole labour market areas (designated SA4 in the Australian Statistical Geography Standard). The rest of NSW area includes the entire remainder of the state, as each state or territory has only one GCCSA.
The significant urban areas are designated by solid orange lines with stippled fill and red text. Significant urban areas are statistical divisions designed to represent significant towns and cities or associated collections of smaller towns, with total populations of 10,000 people or more. They consist of single, or clusters of, urban centres/localities (see below), and are constructed from one or more SA2 units, which are collations of suburbs and localities designed for consistent statistical output between censuses.
The Urban Centres/Localities are designated by dashed red lines with pink fill. Urban centres/localities are statistical divisions delineating the contiguous built up, or urban areas of cities, towns and most small settlements. They are constructed from the smallest statistical output areas (SA1).
Also represented are 31 outlined coloured areas. These are the 31 local government areas that are commonly understood as comprising Sydney, albeit unofficially.
References
- Statistics, c=AU; o=Commonwealth of Australia; ou=Australian Bureau of (28 July 2017). "Main Features - Main Features". www.abs.gov.au.
- Statistics. "Regional Population". www.abs.gov.au. Australian Bureau of Statistics. Retrieved 31 October 2020.
- Statistics. "Population estimates by Significant Urban Area, 2009-2019". www.abs.gov.au. Australian Bureau of Statistics. Retrieved 31 October 2020.
- "3218.0 – Regional Population Growth, Australia, 2011". Australian Bureau of Statistics. Retrieved 15 April 2018.
- Australian Bureau of Statistics (27 June 2017). "Sydney". 2016 Census QuickStats. Retrieved 10 November 2017.

- Australian Bureau of Statistics (31 October 2012). "Sydney". 2011 Census QuickStats. Retrieved 8 December 2012.
- Australian Bureau of Statistics (25 October 2007). "Sydney". 2006 Census QuickStats. Retrieved 8 December 2012.
- Australian Bureau of Statistics (27 June 2017). "Melbourne". 2016 Census QuickStats. Retrieved 10 November 2017.
- Australian Bureau of Statistics (31 October 2012). "Melbourne". 2011 Census QuickStats. Retrieved 8 December 2012.
- Australian Bureau of Statistics (25 October 2007). "Melbourne". 2006 Census QuickStats. Retrieved 8 December 2012.
- Australian Bureau of Statistics (27 June 2017). "Brisbane". 2016 Census QuickStats. Retrieved 10 November 2017.
- Australian Bureau of Statistics (31 October 2012). "Brisbane". 2011 Census QuickStats. Retrieved 8 December 2012.
- Australian Bureau of Statistics (25 October 2007). "Brisbane". 2006 Census QuickStats. Retrieved 8 December 2012.
- Australian Bureau of Statistics (27 June 2017). "Perth (WA)". 2016 Census QuickStats. Retrieved 17 November 2017.
- Australian Bureau of Statistics (31 October 2012). "Perth (WA)". 2011 Census QuickStats. Retrieved 8 December 2012.
- Australian Bureau of Statistics (25 October 2007). "Perth (WA)". 2006 Census QuickStats. Retrieved 8 December 2012.
- Australian Bureau of Statistics (27 June 2017). "Adelaide". 2016 Census QuickStats. Retrieved 10 November 2017.
- Australian Bureau of Statistics (31 October 2012). "Adelaide". 2011 Census QuickStats. Retrieved 8 December 2012.
- Australian Bureau of Statistics (25 October 2007). "Adelaide". 2006 Census QuickStats. Retrieved 8 December 2012.
- Australian Bureau of Statistics (27 June 2017). "Gold Coast – Tweed Heads (Gold Coast Part)". 2016 Census QuickStats. Retrieved 10 November 2017.
- Australian Bureau of Statistics (27 June 2017). "Gold Coast – Tweed Heads (Tweed Heads Part)". 2016 Census QuickStats. Retrieved 10 November 2017.
- Australian Bureau of Statistics (31 October 2012). "Gold Coast – Tweed Heads (Gold Coast Part)". 2011 Census QuickStats. Retrieved 8 December 2012.
- Australian Bureau of Statistics (31 October 2012). "Gold Coast – Tweed Heads (Tweed Heads Part)". 2011 Census QuickStats. Retrieved 8 December 2012.
- Australian Bureau of Statistics (25 October 2007). "Gold Coast". 2006 Census QuickStats. Retrieved 8 December 2012.
- Australian Bureau of Statistics (25 October 2007). "Tweed Heads". 2006 Census QuickStats. Retrieved 8 December 2012.
- Australian Bureau of Statistics (27 June 2017). "Canberra – Queanbeyan (Canberra Part)". 2016 Census QuickStats. Retrieved 17 November 2017.
- Australian Bureau of Statistics (27 June 2017). "Canberra – Queanbeyan (Queanbeyan Part)". 2016 Census QuickStats. Retrieved 17 November 2012.
- Australian Bureau of Statistics (31 October 2012). "Canberra – Queanbeyan (Canberra Part)". 2011 Census QuickStats. Retrieved 8 December 2012.
- Australian Bureau of Statistics (31 October 2012). "Canberra – Queanbeyan (Queanbeyan Part)". 2011 Census QuickStats. Retrieved 8 December 2012.
- Australian Bureau of Statistics (25 October 2007). "Canberra". 2006 Census QuickStats. Retrieved 8 December 2012.
- Australian Bureau of Statistics (25 October 2007). "Queanbeyan". 2006 Census QuickStats. Retrieved 8 December 2012.
- Australian Bureau of Statistics (27 June 2017). "Newcastle". 2016 Census QuickStats. Retrieved 11 November 2017.
- Australian Bureau of Statistics (31 October 2012). "Newcastle". 2011 Census QuickStats. Retrieved 8 December 2012.
- Australian Bureau of Statistics (25 October 2007). "Newcastle". 2006 Census QuickStats. Retrieved 8 December 2012.
- Australian Bureau of Statistics (27 June 2017). "Central Coast". 2016 Census QuickStats. Retrieved 11 November 2017.
- Australian Bureau of Statistics (31 October 2012). "Central Coast". 2011 Census QuickStats. Retrieved 8 December 2012.
- Australian Bureau of Statistics (25 October 2007). "Central Coast". 2006 Census QuickStats. Retrieved 8 December 2012.
- Australian Bureau of Statistics (27 June 2017). "Wollongong". 2016 Census QuickStats. Retrieved 11 November 2017.
- Australian Bureau of Statistics (31 October 2012). "Wollongong". 2011 Census QuickStats. Retrieved 8 December 2012.
- Australian Bureau of Statistics (25 October 2007). "Wollongong". 2006 Census QuickStats. Retrieved 8 December 2012.
- Australian Bureau of Statistics (27 June 2017). "Sunshine Coast". 2016 Census QuickStats. Retrieved 11 November 2017.
- Australian Bureau of Statistics (31 October 2012). "Sunshine Coast". 2011 Census QuickStats. Retrieved 8 December 2012.
- Australian Bureau of Statistics (25 October 2007). "Sunshine Coast". 2006 Census QuickStats. Retrieved 8 December 2012.
- Australian Bureau of Statistics (27 June 2017). "Hobart". 2016 Census QuickStats. Retrieved 17 November 2017.
- Australian Bureau of Statistics (31 October 2012). "Hobart". 2011 Census QuickStats. Retrieved 8 December 2012.
- Australian Bureau of Statistics (25 October 2007). "Hobart". 2006 Census QuickStats. Retrieved 8 December 2012.
- Australian Bureau of Statistics (27 June 2017). "Townsville". 2016 Census QuickStats. Retrieved 17 November 2017.
- Australian Bureau of Statistics (31 October 2012). "Townsville". 2011 Census QuickStats. Retrieved 8 December 2012.
- Australian Bureau of Statistics (25 October 2007). "Townsville". 2006 Census QuickStats. Retrieved 8 December 2012.
- Australian Bureau of Statistics (27 June 2017). "Geelong". 2016 Census QuickStats. Retrieved 17 November 2017.
- Australian Bureau of Statistics (31 October 2012). "Geelong". 2011 Census QuickStats. Retrieved 8 December 2012.
- Australian Bureau of Statistics (25 October 2007). "Geelong". 2006 Census QuickStats. Retrieved 8 December 2012.
- Australian Bureau of Statistics (27 June 2017). "Cairns". 2016 Census QuickStats. Retrieved 17 November 2017.
- Australian Bureau of Statistics (31 October 2012). "Cairns". 2011 Census QuickStats. Retrieved 8 December 2012.
- Australian Bureau of Statistics (25 October 2007). "Cairns". 2006 Census QuickStats. Retrieved 8 December 2012.
- Australian Bureau of Statistics (27 June 2017). "Darwin". 2016 Census QuickStats. Retrieved 17 November 2017.
- Australian Bureau of Statistics (31 October 2012). "Darwin". 2011 Census QuickStats. Retrieved 4 January 2012.
- Australian Bureau of Statistics (25 October 2007). "Darwin". 2006 Census QuickStats. Retrieved 8 December 2012.
- Australian Bureau of Statistics (25 October 2007). "Palmerston". 2006 Census QuickStats. Retrieved 8 December 2012.
- Australian Bureau of Statistics (27 June 2017). "Toowoomba". 2016 Census QuickStats. Retrieved 17 November 2017.
- Australian Bureau of Statistics (31 October 2012). "Toowoomba". 2011 Census QuickStats. Retrieved 8 December 2012.
- Australian Bureau of Statistics (25 October 2007). "Toowoomba". 2006 Census QuickStats. Retrieved 8 December 2012.
- Australian Bureau of Statistics (27 June 2017). "Ballarat". 2016 Census QuickStats. Retrieved 17 November 2017.
- Australian Bureau of Statistics (31 October 2012). "Ballarat". 2011 Census QuickStats. Retrieved 8 December 2012.
- Australian Bureau of Statistics (25 October 2007). "Ballarat". 2006 Census QuickStats. Retrieved 8 December 2012.
- Australian Bureau of Statistics (27 June 2017). "Bendigo". 2016 Census QuickStats. Retrieved 17 November 2017.
- Australian Bureau of Statistics (31 October 2012). "Bendigo". 2011 Census QuickStats. Retrieved 8 December 2012.
- Australian Bureau of Statistics (25 October 2007). "Bendigo". 2006 Census QuickStats. Retrieved 8 December 2012.
- Australian Bureau of Statistics (27 June 2017). "Mandurah". 2016 Census QuickStats. Retrieved 17 November 2017.
- Australian Bureau of Statistics (27 June 2017). "Mandurah". 2016 Census QuickStats. Retrieved 17 November 2017.
- Australian Bureau of Statistics (31 October 2012). "Albury – Wodonga (Albury Part)". 2011 Census QuickStats. Retrieved 8 December 2012.
- Australian Bureau of Statistics (31 October 2012). "Mandurah". 2011 Census QuickStats. Retrieved 8 December 2012.
- Australian Bureau of Statistics (25 October 2007). "Mandurah". 2006 Census QuickStats. Retrieved 8 December 2012.
- Australian Bureau of Statistics (25 October 2007). "Mandurah". 2006 Census QuickStats. Retrieved 8 December 2012.
- Australian Bureau of Statistics (27 June 2017). "Albury – Wodonga (Albury Part)". 2016 Census QuickStats. Retrieved 17 November 2017.
- Australian Bureau of Statistics (27 June 2017). "Albury – Wodonga (Wodonga Part)". 2016 Census QuickStats. Retrieved 17 November 2017.
- Australian Bureau of Statistics (31 October 2012). "Albury – Wodonga (Wodonga Part)". 2011 Census QuickStats. Retrieved 8 December 2012.
- Australian Bureau of Statistics (25 October 2007). "Albury – Wodonga (Albury Part)". 2006 Census QuickStats. Retrieved 8 December 2012.
- Australian Bureau of Statistics (25 October 2007). "Albury – Wodonga (Wodonga Part)". 2006 Census QuickStats. Retrieved 8 December 2012.
- Australian Bureau of Statistics (27 June 2017). "Maitland (NSW)". 2016 Census QuickStats. Retrieved 17 November 2017.
- Australian Bureau of Statistics (31 October 2012). "Maitland (NSW)". 2011 Census QuickStats. Retrieved 8 December 2012.
- Australian Bureau of Statistics (25 October 2007). "Maitland (NSW)". 2006 Census QuickStats. Retrieved 8 December 2012.
- Australian Bureau of Statistics (27 June 2017). "Mackay". 2016 Census QuickStats. Retrieved 17 November 2017.
- Australian Bureau of Statistics (31 October 2012). "Mackay". 2011 Census QuickStats. Retrieved 1 January 2014.
- Australian Bureau of Statistics (25 October 2007). "Mackay". 2006 Census QuickStats. Retrieved 8 December 2012.
- Australian Bureau of Statistics (27 June 2017). "Launceston". 2016 Census QuickStats. Retrieved 17 November 2017.
- Australian Bureau of Statistics (31 October 2012). "Launceston". 2011 Census QuickStats. Retrieved 8 December 2012.
- Australian Bureau of Statistics (25 October 2007). "Launceston". 2006 Census QuickStats. Retrieved 8 December 2012.
- Australian Bureau of Statistics (27 June 2017). "Bunbury". 2016 Census QuickStats. Retrieved 17 November 2017.
- Australian Bureau of Statistics (31 October 2012). "Bunbury". 2011 Census QuickStats. Retrieved 8 December 2012.
- Australian Bureau of Statistics (25 October 2007). "Bunbury". 2006 Census QuickStats. Retrieved 8 December 2012.
- Australian Bureau of Statistics (27 June 2017). "Rockhampton". 2016 Census QuickStats. Retrieved 17 November 2017.
- Australian Bureau of Statistics (31 October 2012). "Rockhampton". 2011 Census QuickStats. Retrieved 8 December 2012.
- Australian Bureau of Statistics (25 October 2007). "Rockhampton". 2006 Census QuickStats. Retrieved 8 December 2012.
- Australian Bureau of Statistics (27 June 2017). "Melton". 2016 Census QuickStats. Retrieved 17 November 2017.
- Australian Bureau of Statistics (31 October 2012). "Melton". 2011 Census QuickStats. Retrieved 8 December 2012.
- Australian Bureau of Statistics (25 October 2007). "Melton". 2006 Census QuickStats. Retrieved 8 December 2012.
- Australian Bureau of Statistics (27 June 2017). "Hervey Bay". 2016 Census QuickStats. Retrieved 17 November 2017.
- Australian Bureau of Statistics (31 October 2012). "Hervey Bay". 2011 Census QuickStats. Retrieved 8 December 2012.
- Australian Bureau of Statistics (25 October 2007). "Hervey Bay". 2006 Census QuickStats. Retrieved 8 December 2012.
- Australian Bureau of Statistics (27 June 2017). "Bundaberg". 2016 Census QuickStats.
- Australian Bureau of Statistics (31 October 2012). "Bundaberg". 2011 Census QuickStats. Retrieved 8 December 2012.
- Australian Bureau of Statistics (25 October 2007). "Bundaberg". 2006 Census QuickStats. Retrieved 8 December 2012.
- Australian Bureau of Statistics (27 June 2017). "Wagga Wagga". 2016 Census QuickStats. Retrieved 17 November 2017.
- Australian Bureau of Statistics (31 October 2012). "Wagga Wagga". 2011 Census QuickStats. Retrieved 8 December 2012.
- Australian Bureau of Statistics (25 October 2007). "Wagga Wagga". 2006 Census QuickStats. Retrieved 8 December 2012.
- Australian Bureau of Statistics (27 June 2017). "Coffs Harbour". 2016 Census QuickStats. Retrieved 17 November 2017.
- Australian Bureau of Statistics (31 October 2012). "Coffs Harbour". 2011 Census QuickStats. Retrieved 8 December 2012.
- Australian Bureau of Statistics (25 October 2007). "Coffs Harbour". 2006 Census QuickStats. Retrieved 8 December 2012.
- Australian Bureau of Statistics (27 June 2017). "Shepparton – Mooroopna". 2016 Census QuickStats. Retrieved 17 November 2017.
- Australian Bureau of Statistics (31 October 2012). "Shepparton – Mooroopna". 2011 Census QuickStats. Retrieved 8 December 2012.
- Australian Bureau of Statistics (25 October 2007). "Shepparton – Mooroopna". 2006 Census QuickStats. Retrieved 8 December 2012.
- Australian Bureau of Statistics (27 June 2017). "Port Macquarie". 2016 Census QuickStats. Retrieved 17 November 2017.
- Australian Bureau of Statistics (31 October 2012). "Port Macquarie". 2011 Census QuickStats. Retrieved 8 December 2012.
- Australian Bureau of Statistics (25 October 2007). "Port Macquarie". 2006 Census QuickStats. Retrieved 8 December 2012.
- Australian Bureau of Statistics (27 June 2017). "Orange". 2016 Census QuickStats. Retrieved 17 November 2017.
- Australian Bureau of Statistics (31 October 2012). "Orange". 2011 Census QuickStats. Retrieved 8 December 2012.
- Australian Bureau of Statistics (25 October 2007). "Orange". 2006 Census QuickStats. Retrieved 8 December 2012.
- Australian Bureau of Statistics (27 June 2017). "Mildura – Buronga (Mildura Part)". 2016 Census QuickStats. Retrieved 17 November 2017.
- Australian Bureau of Statistics (27 June 2017). "Mildura – Buronga (Buronga Part)". 2016 Census QuickStats. Retrieved 17 November 2017.
- Australian Bureau of Statistics (31 October 2012). "Mildura – Buronga (Mildura Part)". 2011 Census QuickStats. Retrieved 8 December 2012.
- Australian Bureau of Statistics (31 October 2012). "Mildura – Buronga (Buronga Part)". 2011 Census QuickStats. Retrieved 8 December 2012.
- Australian Bureau of Statistics (25 October 2007). "Mildura". 2006 Census QuickStats. Retrieved 8 December 2012.
- Australian Bureau of Statistics (25 October 2007). "Buronga". 2006 Census QuickStats. Retrieved 1 January 2014.
- Australian Bureau of Statistics (27 June 2017). "Sunbury". 2016 Census QuickStats. Retrieved 17 November 2017.
- Australian Bureau of Statistics (31 October 2012). "Sunbury". 2011 Census QuickStats. Retrieved 8 December 2012.
- Australian Bureau of Statistics (25 October 2007). "Sunbury". 2006 Census QuickStats. Retrieved 8 December 2012.
- Australian Bureau of Statistics (27 June 2017). "Dubbo". 2016 Census QuickStats. Retrieved 17 November 2017.
- Australian Bureau of Statistics (31 October 2012). "Dubbo". 2011 Census QuickStats. Retrieved 8 December 2012.
- Australian Bureau of Statistics (25 October 2007). "Dubbo". 2006 Census QuickStats. Retrieved 8 December 2012.
- Australian Bureau of Statistics (27 June 2017). "Tamworth". 2016 Census QuickStats. Retrieved 17 November 2017.
- Australian Bureau of Statistics (31 October 2012). "Tamworth". 2011 Census QuickStats. Retrieved 8 December 2012.
- Australian Bureau of Statistics (25 October 2007). "Tamworth". 2006 Census QuickStats. Retrieved 8 December 2012.
- Australian Bureau of Statistics (27 June 2017). "Bathurst". 2016 Census QuickStats. Retrieved 17 November 2017.
- Australian Bureau of Statistics (31 October 2012). "Bathurst". 2011 Census QuickStats. Retrieved 8 December 2012.
- Australian Bureau of Statistics (25 October 2007). "Bathurst". 2006 Census QuickStats. Retrieved 8 December 2012.
- Australian Bureau of Statistics (27 June 2017). "Gladstone". 2016 Census QuickStats. Retrieved 17 November 2017.
- Australian Bureau of Statistics (31 October 2012). "Gladstone". 2011 Census QuickStats. Retrieved 8 December 2012.
- Australian Bureau of Statistics (25 October 2007). "Gladstone". 2006 Census QuickStats. Retrieved 8 December 2012.
- Australian Bureau of Statistics (27 June 2017). "Geraldton". 2016 Census QuickStats. Retrieved 17 November 2017.
- Australian Bureau of Statistics (31 October 2012). "Geraldton". 2011 Census QuickStats. Retrieved 8 December 2012.
- Australian Bureau of Statistics (25 October 2007). "Geraldton". 2006 Census QuickStats. Retrieved 8 December 2012.
- Australian Bureau of Statistics (27 June 2017). "Nowra – Bomaderry". 2016 Census QuickStats. Retrieved 17 November 2017.
- Australian Bureau of Statistics (31 October 2012). "Nowra – Bomaderry". 2011 Census QuickStats. Retrieved 8 December 2012.
- Australian Bureau of Statistics (25 October 2007). "Nowra – Bomaderry". 2006 Census QuickStats. Retrieved 8 December 2012.
- Australian Bureau of Statistics (27 June 2017). "Warrnambool". 2016 Census QuickStats. Retrieved 17 November 2017.
- Australian Bureau of Statistics (31 October 2012). "Warrnambool". 2011 Census QuickStats. Retrieved 8 December 2012.
- Australian Bureau of Statistics (25 October 2007). "Warrnambool". 2006 Census QuickStats. Retrieved 8 December 2012.
- Australian Bureau of Statistics (27 June 2017). "Kalgoorlie – Boulder". 2016 Census QuickStats. Retrieved 17 November 2017.
- Australian Bureau of Statistics (31 October 2012). "Kalgoorlie – Boulder". 2011 Census QuickStats. Retrieved 8 December 2012.
- Australian Bureau of Statistics (25 October 2007). "Kalgoorlie – Boulder". 2006 Census QuickStats. Retrieved 8 December 2012.
- Australian Bureau of Statistics (27 June 2017). "Albany". 2016 Census QuickStats. Retrieved 17 November 2017.
- Australian Bureau of Statistics (31 October 2012). "Albany". 2011 Census QuickStats. Retrieved 8 December 2012.
- Australian Bureau of Statistics (25 October 2007). "Albany". 2006 Census QuickStats. Retrieved 8 December 2012.
- Australian Bureau of Statistics (27 June 2017). "Lismore". 2016 Census QuickStats. Retrieved 17 November 2017.
- Australian Bureau of Statistics (31 October 2012). "Lismore". 2011 Census QuickStats. Retrieved 8 December 2012.
- Australian Bureau of Statistics (25 October 2007). "Mackay". 2006 Census QuickStats. Retrieved 8 December 2012.
- Australian Bureau of Statistics (27 June 2017). "Gawler". 2016 Census QuickStats. Retrieved 17 November 2017.
- Australian Bureau of Statistics (31 October 2012). "Gawler". 2011 Census QuickStats. Retrieved 17 November 2017.
- Australian Bureau of Statistics (25 October 2007). "Gawler". 2006 Census QuickStats. Retrieved 17 November 2017.
- Australian Bureau of Statistics (27 June 2017). "Mount Gambier". 2016 Census QuickStats. Retrieved 17 November 2017.
- Australian Bureau of Statistics (31 October 2012). "Mount Gambier". 2011 Census QuickStats. Retrieved 8 December 2012.
- Australian Bureau of Statistics (25 October 2007). "Mount Gambier". 2006 Census QuickStats. Retrieved 8 December 2012.
- Australian Bureau of Statistics (27 June 2017). "Traralgon". 2016 Census QuickStats. Retrieved 17 November 2017.
- Australian Bureau of Statistics (31 October 2012). "Traralgon". 2011 Census QuickStats. Retrieved 31 December 2013.
- Australian Bureau of Statistics (25 October 2007). "Traralgon". 2006 Census QuickStats. Retrieved 31 December 2013.
- Australian Bureau of Statistics (27 June 2017). "Busselton". 2016 Census QuickStats. Retrieved 17 November 2017.
- Australian Bureau of Statistics (31 October 2012). "Busselton". 2011 Census QuickStats. Retrieved 17 November 2017.
- Australian Bureau of Statistics (25 October 2007). "Griffith". 2006 Census QuickStats. Retrieved 17 November 2017.
- "Population estimates by Local Government Area, 2018 to 2019". Australian Bureau of Statistics. Australian Bureau of Statistics. Retrieved 1 November 2020.
External links
- "Table 1: Population growth and turnover in Local Government Areas (LGAs), 2006 to 2011". Australian Bureau of Statistics. Retrieved 10 August 2015. — Spreadsheet of population data for local government areas in the 2006 and 2011 Australian census