Oxford (electoral district)
Oxford is a federal electoral district in Ontario, Canada, that has been represented in the House of Commons of Canada since the 1935 election.
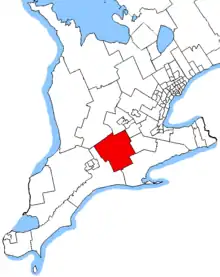 Oxford in relation to the southern Ontario ridings | |||
| Federal electoral district | |||
| Legislature | House of Commons | ||
| MP |
Conservative | ||
| District created | 1933 | ||
| First contested | 1935 | ||
| Last contested | 2019 | ||
| District webpage | profile, map | ||
| Demographics | |||
| Population (2011)[1] | 108,656 | ||
| Electors (2015) | 83,003 | ||
| Area (km²)[2] | 2,384 | ||
| Pop. density (per km²) | 45.6 | ||
| Census division(s) | Oxford County | ||
| Census subdivision(s) | Woodstock, Tillsonburg, Ingersoll, Norwich, Zorra, South-West Oxford, East Zorra – Tavistock, Blandford-Blenheim | ||
It consists of the County of Oxford and a small portion of the County of Brant.[3]
History
It was created in 1933 when the ridings of Oxford North and Oxford South were merged. It consisted initially of the county of Oxford, including the part of the village of Tavistock that lies in the county of Oxford.
In 1966, it was expanded to include the Town of Tillsonburg and the whole of the Village of Tavistock. In 1976, it was defined as consisting of the County of Oxford. In 1987, it was expanded to include the Township of Burford in the County of Brant. In 1996, it was defined as consisting of the county of Oxford.
This riding gained territory from Brant during the 2012 electoral redistribution.
Members of Parliament
| Parliament | Years | Member | Party | |
|---|---|---|---|---|
| Oxford Riding created from Oxford North and Oxford South |
||||
| 18th | 1935–1940 | Almon Rennie | Liberal | |
| 19th | 1940–1945 | |||
| 20th | 1945–1949 | Kenneth Daniel | Progressive Conservative | |
| 21st | 1949–1953 | Clark Murray | Liberal | |
| 22nd | 1953–1957 | Wally Nesbitt | Progressive Conservative | |
| 23rd | 1957–1958 | |||
| 24th | 1958–1962 | |||
| 25th | 1962–1963 | |||
| 26th | 1963–1965 | |||
| 27th | 1965–1968 | |||
| 28th | 1968–1972 | |||
| 29th | 1972–1974 | |||
| 30th | 1974–1979 | Bruce Halliday | ||
| 31st | 1979–1980 | |||
| 32nd | 1980–1984 | |||
| 33rd | 1984–1988 | |||
| 34th | 1988–1993 | |||
| 35th | 1993–1997 | John Baird Finlay | Liberal | |
| 36th | 1997–2000 | |||
| 37th | 2000–2004 | |||
| 38th | 2004–2006 | Dave MacKenzie | Conservative | |
| 39th | 2006–2008 | |||
| 40th | 2008–2011 | |||
| 41st | 2011–2015 | |||
| 42nd | 2015–2019 | |||
| 43rd | 2019–present | |||
Election results
| 2019 Canadian federal election | ||||||||
|---|---|---|---|---|---|---|---|---|
| Party | Candidate | Votes | % | ±% | Expenditures | |||
| Conservative | Dave MacKenzie | 29,310 | 48.2 | +2.5 | $49,710.46 | |||
| New Democratic | Matthew Chambers | 12,306 | 20.2 | +3.7 | none listed | |||
| Liberal | Brendan Knight | 11,745 | 19.3 | -12.9 | $3,866.13 | |||
| Green | Lisa Birtch-Carriere | 4,770 | 7.8 | +4.3 | none listed | |||
| People's | Wendy Martin | 1,774 | 2.9 | - | $6,624.90 | |||
| Christian Heritage | Melody Aldred | 986 | 1.6 | -0.5 | $3,632.07 | |||
| Total valid votes/Expense limit | 60,891 | 100.0 | ||||||
| Total rejected ballots | 528 | |||||||
| Turnout | 61,419 | 66.2 | ||||||
| Eligible voters | 92,758 | |||||||
| Conservative hold | Swing | -0.6 | ||||||
| Source: Elections Canada[4][5] | ||||||||
| 2015 Canadian federal election | ||||||||
|---|---|---|---|---|---|---|---|---|
| Party | Candidate | Votes | % | ±% | Expenditures | |||
| Conservative | Dave MacKenzie | 25,966 | 45.7 | -13.27 | $75,795.63 | |||
| Liberal | Don McKay | 18,299 | 32.2 | +22.66 | $36,173.57 | |||
| New Democratic | Zoe Kunschner | 9,406 | 16.5 | -8.95 | $25,490.22 | |||
| Green | Mike Farlow | 2,004 | 3.5 | -0.83 | $4,354.32 | |||
| Christian Heritage | Melody Ann Aldred | 1,175 | 2.1 | +0.49 | $8,421.76 | |||
| Total valid votes/Expense limit | 56,850 | 100.0 | $220,586.55 | |||||
| Total rejected ballots | 241 | – | – | |||||
| Turnout | 57,041 | 68.36 | +6.16 | |||||
| Eligible voters | 83,431 | |||||||
| Conservative hold | Swing | -17.96 | ||||||
| Source: Elections Canada[6][7] | ||||||||
| 2011 federal election redistributed results[8] | |||
|---|---|---|---|
| Party | Vote | % | |
| Conservative | 28,782 | 58.97 | |
| New Democratic | 12,419 | 25.45 | |
| Liberal | 4,706 | 9.64 | |
| Green | 2,111 | 4.33 | |
| Others | 786 | 1.61 | |
| 2011 Canadian federal election | ||||||||
|---|---|---|---|---|---|---|---|---|
| Party | Candidate | Votes | % | ±% | Expenditures | |||
| Conservative | Dave MacKenzie | 27,973 | 58.90 | +6.23 | $56,267 | |||
| New Democratic | Paul Arsenault | 12,164 | 25.61 | +7.59 | $14,065 | |||
| Liberal | Tim Lobzun | 4,521 | 9.52 | -9.86 | $13,495 | |||
| Green | Mike Farlow | 2,058 | 4.33 | -3.24 | $12,611 | |||
| Christian Heritage | John Markus | 776 | 1.63 | -0.70 | $1,478 | |||
| Total valid votes/Expense limit | 47,492 | 100.00 | $85,881.86 | |||||
| Total rejected ballots | 179 | 0.38 | -0.05 | |||||
| Turnout | 47,671 | 62.60 | +3.58 | |||||
| Eligible voters | 76,149 | – | – | |||||
| 2008 Canadian federal election | ||||||||
|---|---|---|---|---|---|---|---|---|
| Party | Candidate | Votes | % | ±% | Expenditures | |||
| Conservative | Dave MacKenzie | 23,330 | 52.67 | +6.13 | $57,473 | |||
| Liberal | Martha Dennis | 8,586 | 19.38 | -8.70 | $50,017 | |||
| New Democratic | Diane Abbott | 7,982 | 18.02 | +0.65 | $9,242 | |||
| Green | Cathy Mott | 3,355 | 7.57 | +4.43 | $2,819 | |||
| Christian Heritage | Shaun MacDonald | 1,036 | 2.33 | -0.55 | $14,229 | |||
| Total valid votes/Expense limit | 44,289 | 100.00 | $82,866 | |||||
| Total rejected ballots | 145 | 0.33 | - | |||||
| Turnout | 44,434 | 59.02 | ||||||
| Conservative hold | Swing | +7.4 | ||||||
| 2006 Canadian federal election | ||||||||
|---|---|---|---|---|---|---|---|---|
| Party | Candidate | Votes | % | ±% | ||||
| Conservative | Dave MacKenzie | 23,140 | 46.54 | +1.6 | ||||
| Liberal | Greig Mordue | 13,961 | 28.08 | -2.4 | ||||
| New Democratic | Zoe Kunschner | 8,639 | 17.37 | +2.9 | ||||
| Green | Ronnee Sykes | 1,566 | 3.14 | -1.2 | ||||
| Christian Heritage | John Markus | 1,434 | 2.88 | -0.4 | ||||
| Marijuana | James Bender | 771 | 1.55 | -0.1 | ||||
| Libertarian | Kaye Sargent | 204 | 0.41 | -0.1 | ||||
| Total valid votes | 49,715 | 100.00 | ||||||
| Total rejected ballots | 164 | 0.33 | ||||||
| Turnout | 49,879 | 67.14 | ||||||
| 2004 Canadian federal election | ||||||||
|---|---|---|---|---|---|---|---|---|
| Party | Candidate | Votes | % | ±% | ||||
| Conservative | Dave MacKenzie | 20,606 | 44.9 | -12.5 | ||||
| Liberal | Murray Coulter | 14,011 | 30.5 | -5.0 | ||||
| New Democratic | Zoe Kunschner | 6,673 | 14.5 | -5.3 | ||||
| Green | Irene Tietz | 1,951 | 4.3 | |||||
| Christian Heritage | Leslie Bartley | 1,534 | 3.3 | |||||
| Marijuana | James Bender | 794 | 1.7 | |||||
| Libertarian | Kaye Sargent | 226 | 0.5 | |||||
| Canadian Action | Alex Kreider | 108 | 0.2 | -0.3 | ||||
| Total valid votes | 45,903 | 100.0 | ||||||
Note: Conservative vote is compared to the total of the Canadian Alliance vote and Progressive Conservative vote in 2000 election.
| 2000 Canadian federal election | ||||||||
|---|---|---|---|---|---|---|---|---|
| Party | Candidate | Votes | % | ±% | ||||
| Liberal | John Baird Finlay | 15,181 | 35.6 | -0.4 | ||||
| Progressive Conservative | Dave MacKenzie | 13,050 | 30.6 | -1.9 | ||||
| Alliance | Patricia Smith | 11,455 | 26.8 | +5.8 | ||||
| New Democratic | Shawn Rouse | 2,254 | 5.3 | -2.2 | ||||
| Independent | John Thomas Markus | 536 | 1.3 | |||||
| Canadian Action | Alex Kreider | 227 | 0.5 | +0.1 | ||||
| Total valid votes | 42,703 | 100.0 | ||||||
Note: Canadian Alliance vote is compared to the Reform vote in 1997 election.
| 1997 Canadian federal election | ||||||||
|---|---|---|---|---|---|---|---|---|
| Party | Candidate | Votes | % | ±% | ||||
| Liberal | John Baird Finlay | 16,281 | 36.0 | -4.9 | ||||
| Progressive Conservative | Dave MacKenzie | 14,706 | 32.5 | +10.1 | ||||
| Reform | Bill Irvine | 9,533 | 21.1 | -5.7 | ||||
| New Democratic | Martin Donlevy | 3,406 | 7.5 | +2.5 | ||||
| Christian Heritage | John Zekveld | 956 | 2.1 | +0.1 | ||||
| Canadian Action | Alex Kreider | 192 | 0.4 | |||||
| Natural Law | Jim Morris | 181 | 0.4 | -0.1 | ||||
| Total valid votes | 45,255 | 100.0 | ||||||
| 1993 Canadian federal election | ||||||||
|---|---|---|---|---|---|---|---|---|
| Party | Candidate | Votes | % | ±% | ||||
| Liberal | John Baird Finlay | 18,381 | 40.9 | +3.9 | ||||
| Reform | John Mohr | 12,009 | 26.7 | |||||
| Progressive Conservative | George Klosler | 10,080 | 22.4 | -17.3 | ||||
| New Democratic | Martin Donlevy | 2,280 | 5.1 | -10.9 | ||||
| Christian Heritage | Hans Strikwerda | 892 | 2.0 | -4.6 | ||||
| Independent | George Moore | 458 | 1.0 | |||||
| National | Bryan John Rahn | 400 | 0.9 | |||||
| Libertarian | Kaye Sargent | 219 | 0.5 | +0.1 | ||||
| Natural Law | Peter Leggat | 209 | 0.5 | |||||
| Total valid votes | 44,928 | 100.0 | ||||||
| 1988 Canadian federal election | ||||||||
|---|---|---|---|---|---|---|---|---|
| Party | Candidate | Votes | % | ±% | ||||
| Progressive Conservative | Bruce Halliday | 19,367 | 39.8 | -17.3 | ||||
| Liberal | Alfred Apps | 18,035 | 37.0 | +8.3 | ||||
| New Democratic | Brian Donlevy | 7,771 | 16.0 | +2.4 | ||||
| Christian Heritage | Hans Strikwerda | 3,190 | 6.5 | |||||
| Libertarian | Kaye Sargent | 187 | 0.4 | -0.3 | ||||
| Commonwealth of Canada | Sharon Rounds | 166 | 0.3 | |||||
| Total valid votes | 48,716 | 100.0 | ||||||
| 1984 Canadian federal election | ||||||||
|---|---|---|---|---|---|---|---|---|
| Party | Candidate | Votes | % | ±% | ||||
| Progressive Conservative | Bruce Halliday | 25,642 | 57.1 | +11.2 | ||||
| Liberal | Alfred Apps | 12,884 | 28.7 | -8.1 | ||||
| New Democratic | Wayne Colbran | 6,077 | 13.5 | -2.8 | ||||
| Libertarian | Kaye Sargent | 322 | 0.7 | 0.0 | ||||
| Total valid votes | 44,925 | 100.0 | ||||||
| 1980 Canadian federal election | ||||||||
|---|---|---|---|---|---|---|---|---|
| Party | Candidate | Votes | % | ±% | ||||
| Progressive Conservative | Bruce Halliday | 19,382 | 45.9 | -9.3 | ||||
| Liberal | Ken Peers | 15,546 | 36.8 | +6.5 | ||||
| New Democratic | Marjorie Lanaway | 6,885 | 16.3 | +2.3 | ||||
| Libertarian | Nancy Hurd | 311 | 0.7 | +0.2 | ||||
| Marxist–Leninist | Larry Hannant | 100 | 0.2 | |||||
| Total valid votes | 42,224 | 100.0 | ||||||
| 1979 Canadian federal election | ||||||||
|---|---|---|---|---|---|---|---|---|
| Party | Candidate | Votes | % | ±% | ||||
| Progressive Conservative | Bruce Halliday | 23,592 | 55.2 | +8.8 | ||||
| Liberal | Ron Calhoun | 12,935 | 30.3 | -12.6 | ||||
| New Democratic | Marjorie Lanaway | 5,980 | 14.0 | +3.2 | ||||
| Libertarian | Nancy Hurd | 227 | 0.5 | |||||
| Total valid votes | 42,734 | 100.0 | ||||||
| 1974 Canadian federal election | ||||||||
|---|---|---|---|---|---|---|---|---|
| Party | Candidate | Votes | % | ±% | ||||
| Progressive Conservative | Bruce Halliday | 18,934 | 46.4 | -16.2 | ||||
| Liberal | Charlie Tatham | 17,506 | 42.9 | +12.0 | ||||
| New Democratic | Peter Klynstra | 4,398 | 10.8 | +4.1 | ||||
| Total valid votes | 40,838 | 100.0 | ||||||
| 1972 Canadian federal election | ||||||||
|---|---|---|---|---|---|---|---|---|
| Party | Candidate | Votes | % | ±% | ||||
| Progressive Conservative | Wally Nesbitt | 25,438 | 62.5 | +9.0 | ||||
| Liberal | Charlie Tatham | 12,540 | 30.8 | -5.9 | ||||
| New Democratic | Ron Wettlaufer | 2,703 | 6.6 | -3.0 | ||||
| Total valid votes | 40,681 | 100.0 | ||||||
| 1968 Canadian federal election | ||||||||
|---|---|---|---|---|---|---|---|---|
| Party | Candidate | Votes | % | ±% | ||||
| Progressive Conservative | Wally Nesbitt | 18,504 | 53.6 | -2.1 | ||||
| Liberal | Charlie Tatham | 12,697 | 36.8 | +4.6 | ||||
| New Democratic | John Hilborn | 3,335 | 9.7 | -2.5 | ||||
| Total valid votes | 34,536 | 100.0 | ||||||
| 1965 Canadian federal election | ||||||||
|---|---|---|---|---|---|---|---|---|
| Party | Candidate | Votes | % | ±% | ||||
| Progressive Conservative | Wally Nesbitt | 17,657 | 55.6 | -4.8 | ||||
| Liberal | Leslie MacDonald Ball | 10,202 | 32.2 | -0.1 | ||||
| New Democratic | Margaret Caffyn | 3,870 | 12.2 | +7.4 | ||||
| Total valid votes | 31,729 | 100.0 | ||||||
| 1963 Canadian federal election | ||||||||
|---|---|---|---|---|---|---|---|---|
| Party | Candidate | Votes | % | ±% | ||||
| Progressive Conservative | Wally Nesbitt | 19,402 | 60.4 | +2.6 | ||||
| Liberal | William Young | 10,359 | 32.3 | -1.6 | ||||
| New Democratic | Wilf Vale | 1,550 | 4.8 | -1.2 | ||||
| Social Credit | Margaret Elsom | 805 | 2.5 | +0.2 | ||||
| Total valid votes | 32,116 | 100.0 | ||||||
| 1962 Canadian federal election | ||||||||
|---|---|---|---|---|---|---|---|---|
| Party | Candidate | Votes | % | ±% | ||||
| Progressive Conservative | Wally Nesbitt | 18,352 | 57.8 | -17.3 | ||||
| Liberal | Robert Alan MacDougall | 10,731 | 33.8 | +9.0 | ||||
| New Democratic | Wilf Vale | 1,918 | 6.0 | |||||
| Social Credit | Charles Elsom | 735 | 2.3 | |||||
| Total valid votes | 31,736 | 100.0 | ||||||
| 1958 Canadian federal election | ||||||||
|---|---|---|---|---|---|---|---|---|
| Party | Candidate | Votes | % | ±% | ||||
| Progressive Conservative | Wally Nesbitt | 22,079 | 75.1 | +6.3 | ||||
| Liberal | Hector Alexander Clark | 7,305 | 24.9 | +74.8 | ||||
| Total valid votes | 29,384 | 100.0 | ||||||
| 1957 Canadian federal election | ||||||||
|---|---|---|---|---|---|---|---|---|
| Party | Candidate | Votes | % | ±% | ||||
| Progressive Conservative | Wally Nesbitt | 20,404 | 68.9 | +18.8 | ||||
| Liberal | Bruce McCall | 8,275 | 27.9 | |||||
| Social Credit | Charlie Elsom | 944 | 3.2 | |||||
| Total valid votes | 29,623 | 100.0 | ||||||
| 1953 Canadian federal election | ||||||||
|---|---|---|---|---|---|---|---|---|
| Party | Candidate | Votes | % | ±% | ||||
| Progressive Conservative | Wally Nesbitt | 12,693 | 50.1 | +4.8 | ||||
| Liberal | Alexander Clark Murray | 12,654 | 49.9 | +1.6 | ||||
| Total valid votes | 25,347 | 100.0 | ||||||
| 1949 Canadian federal election | ||||||||
|---|---|---|---|---|---|---|---|---|
| Party | Candidate | Votes | % | ±% | ||||
| Liberal | Alexander Clark Murray | 12,581 | 48.3 | +6.6 | ||||
| Progressive Conservative | Kenneth Daniel | 11,791 | 45.2 | -3.6 | ||||
| Co-operative Commonwealth | William Gordon Goodwin | 1,688 | 6.5 | |||||
| Total valid votes | 26,060 | 100.0 | ||||||
| 1945 Canadian federal election | ||||||||
|---|---|---|---|---|---|---|---|---|
| Party | Candidate | Votes | % | ±% | ||||
| Progressive Conservative | Kenneth Daniel | 11,916 | 48.9 | +5.8 | ||||
| Liberal | Almon Secord Rennie | 10,149 | 41.6 | -15.2 | ||||
| Co-operative Commonwealth | Ralph Burton | 2,310 | 9.5 | |||||
| Total valid votes | 24,375 | 100.0 | ||||||
Note: Progressive Conservative vote is compared to "National Government" vote in 1940 election.
| 1940 Canadian federal election | ||||||||
|---|---|---|---|---|---|---|---|---|
| Party | Candidate | Votes | % | ±% | ||||
| Liberal | Almon Secord Rennie | 10,975 | 56.9 | +9.1 | ||||
| National Government | Charles Thomas Milton | 8,325 | 43.1 | +7.0 | ||||
| Total valid votes | 19,300 | 100.0 | ||||||
Note: "National Government" vote is compared to Conservative vote in 1935 election.
| 1935 Canadian federal election | ||||||||
|---|---|---|---|---|---|---|---|---|
| Party | Candidate | Votes | % | |||||
| Liberal | Almon Secord Rennie | 11,438 | 47.8 | |||||
| Conservative | Donald Matheson Sutherland | 8,655 | 36.2 | |||||
| Reconstruction | Richard Harley Mayberry | 2,953 | 12.3 | |||||
| Co-operative Commonwealth | William Andrew MacLeod | 886 | 3.7 | |||||
| Total valid votes | 23,932 | 100.0 | ||||||
References
- "(Code 35067) Census Profile". 2011 census. Statistics Canada. 2012. Retrieved 2011-03-03.
- Beatty, Bob (Summer 2008). "Oxford MPs: Confederation till Now" (PDF). Oxford Update. Dave MacKenzie. p. 2. Retrieved 2009-07-22.
- Riding history from the Library of Parliament
- 2011 results from Elections Canada
- Campaign expense data from Elections Canada
Notes
- Statistics Canada: 2012
- Statistics Canada: 2012
- http://www.elections.ca/res/cir/maps2/mapprov.asp?map=35080&lang=e
- "List of confirmed candidates". Elections Canada. Retrieved October 4, 2019.
- "Election Night Results". Elections Canada. Retrieved November 1, 2019.
- Elections Canada – Confirmed candidates for Oxford, 30 September 2015
- "Elections Canada – Preliminary Election Expenses Limits for Candidates". Archived from the original on 2015-08-15. Retrieved 2020-04-28.
- Pundits' Guide to Canadian Elections