Pend Oreille County, Washington
Pend Oreille County (/ˌpɒndəˈreɪ/ POND-ə-RAY) is a county located in the northeast corner of the U.S. state of Washington, along the Canada–US border. As of the 2010 census, the population was 13,001.[1] The county seat and largest city is Newport.[2] The county was created out of Stevens County on March 1, 1911.[3] It is the most recently formed of the state's 39 counties. It is named after the Pend d'Oreilles tribe, who in turn were ostensibly named for large shell earrings that members wore. ("Pend d'oreille", while awkward in French, could be translated as "hangs from the ear".)
Pend Oreille County | |
|---|---|
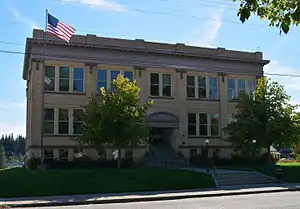 Pend Oreille County Courthouse (September 2014) | |
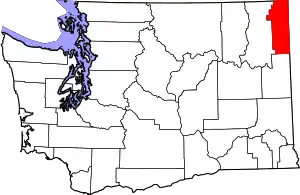 Location within the U.S. state of Washington | |
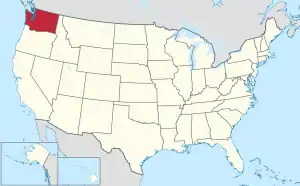 Washington's location within the U.S. | |
| Coordinates: 48°32′N 117°17′W | |
| Country | |
| State | |
| Founded | March 1, 1911 |
| Named for | Pend d'Oreilles people |
| Seat | Newport |
| Largest city | Newport |
| Area | |
| • Total | 1,425 sq mi (3,690 km2) |
| • Land | 1,400 sq mi (4,000 km2) |
| • Water | 25 sq mi (60 km2) 1.8%% |
| Population (2010) | |
| • Total | 13,001 |
| • Estimate (2019) | 13,724 |
| • Density | 9.3/sq mi (3.6/km2) |
| Time zone | UTC−8 (Pacific) |
| • Summer (DST) | UTC−7 (PDT) |
| Congressional district | 5th |
| Website | www |
Pend Oreille County is included in the Spokane-Spokane Valley, WA Metropolitan Statistical Area.
Geography
According to the US Census Bureau, the county has a total area of 1,425 square miles (3,690 km2), of which 1,400 square miles (3,600 km2) is land and 25 square miles (65 km2) (1.8%) is water.[4]
Highways
Adjacent counties
- Boundary County, Idaho – east
- Bonner County, Idaho – east
- Spokane County – south
- Stevens County – west
- Central Kootenay Regional District, British Columbia – north
National protected areas
Demographics
| Historical population | |||
|---|---|---|---|
| Census | Pop. | %± | |
| 1920 | 6,363 | — | |
| 1930 | 7,155 | 12.4% | |
| 1940 | 7,156 | 0.0% | |
| 1950 | 7,413 | 3.6% | |
| 1960 | 6,914 | −6.7% | |
| 1970 | 6,025 | −12.9% | |
| 1980 | 8,580 | 42.4% | |
| 1990 | 8,915 | 3.9% | |
| 2000 | 11,732 | 31.6% | |
| 2010 | 13,001 | 10.8% | |
| 2019 (est.) | 13,724 | [5] | 5.6% |
| US Decennial Census[6] 1790–1960[7] 1900–1990[8] 1990–2000[9] 2010–2019[1] | |||
2000 census
As of the 2000 United States Census,[10] there were 11,732 people, 4,639 households, and 3,261 families in the county. The population density was 8 people per square mile (3/km2). There were 6,608 housing units at an average density of 5 per square mile (2/km2). The racial makeup of the county was 93.53% White, 0.14% Black or African American, 2.88% Native American, 0.63% Asian, 0.20% Pacific Islander, 0.57% from other races, and 2.04% from two or more races. 2.05% of the population were Hispanic or Latino of any race. 21.1% were of German, 13.2% English, 10.2% United States or American, 9,2% Irish and 5.7% Norwegian ancestry.
There were 4,639 households, out of which 29.60% had children under the age of 18 living with them, 57.50% were married couples living together, 8.40% had a female householder with no husband present, and 29.70% were non-families. 25.00% of all households were made up of individuals, and 10.50% had someone living alone who was 65 years of age or older. The average household size was 2.51 and the average family size was 2.98.
The county population contained 26.30% under the age of 18, 5.50% from 18 to 24, 23.80% from 25 to 44, 29.50% from 45 to 64, and 14.90% who were 65 years of age or older. The median age was 42 years. For every 100 females there were 100.50 males. For every 100 females age 18 and over, there were 99.60 males.
The median income for a household in the county was $31,677, and the median income for a family was $36,977. Males had a median income of $36,951 versus $20,693 for females. The per capita income for the county was $15,731. About 13.60% of families and 18.10% of the population were below the poverty line, including 27.60% of those under age 18 and 6.40% of those age 65 or over.
2010 census
As of the 2010 United States Census, there were 13,001 people, 5,479 households, and 3,628 families residing in the county.[11] The population density was 9.3 inhabitants per square mile (3.6/km2). There were 7,936 housing units at an average density of 5.7 per square mile (2.2/km2).[12] The racial makeup of the county was 91.6% Caucasian, 3.8% American Indian, 0.6% Asian, 0.4% black or African American, 0.1% Pacific islander, 0.7% from other races, and 2.9% from two or more races. Those of Hispanic or Latino origin made up 3.0% of the population.[11] In terms of ancestry,[13]
Of the 5,479 households, 26.2% had children under the age of 18 living with them, 52.4% were married couples living together, 9.1% had a female householder with no husband present, 33.8% were non-families, and 28.2% of all households were made up of individuals. The average household size was 2.35 and the average family size was 2.84. The median age was 47.8 years.[11]
The median income for a household in the county was $38,896 and the median income for a family was $46,971. Males had a median income of $45,728 versus $26,128 for females. The per capita income for the county was $22,546. About 13.6% of families and 18.3% of the population were below the poverty line, including 25.2% of those under age 18 and 13.3% of those age 65 or over.[14]
Politics
| Year | Republican | Democratic | Third parties |
|---|---|---|---|
| 2020 | 67.0% 5,728 | 30.3% 2,593 | 2.7% 259 |
| 2016 | 62.3% 4,373 | 27.6% 1,934 | 10.1% 709 |
| 2012 | 58.6% 3,952 | 37.2% 2,508 | 4.3% 289 |
| 2008 | 56.3% 3,717 | 38.8% 2,562 | 4.9% 326 |
| 2004 | 59.6% 3,693 | 37.3% 2,310 | 3.2% 195 |
| 2000 | 56.6% 3,076 | 36.3% 1,973 | 7.2% 389 |
| 1996 | 40.3% 2,012 | 42.6% 2,126 | 17.2% 858 |
| 1992 | 32.4% 1,528 | 38.1% 1,798 | 29.5% 1,390 |
| 1988 | 47.5% 1,802 | 50.7% 1,925 | 1.8% 67 |
| 1984 | 58.3% 2,374 | 40.6% 1,655 | 1.1% 46 |
| 1980 | 55.7% 2,136 | 36.5% 1,399 | 7.8% 300 |
| 1976 | 47.8% 1,516 | 48.4% 1,533 | 3.8% 121 |
| 1972 | 59.6% 1,746 | 36.5% 1,071 | 3.9% 114 |
| 1968 | 41.2% 1,117 | 49.7% 1,350 | 9.1% 247 |
| 1964 | 33.2% 985 | 66.7% 1,978 | 0.1% 2 |
| 1960 | 44.2% 1,305 | 55.6% 1,641 | 0.2% 7 |
| 1956 | 49.1% 1,488 | 50.8% 1,540 | 0.1% 3 |
| 1952 | 52.9% 1,566 | 46.6% 1,380 | 0.5% 16 |
| 1948 | 39.3% 1,009 | 57.1% 1,465 | 3.6% 93 |
| 1944 | 42.9% 1,052 | 56.5% 1,385 | 0.6% 15 |
| 1940 | 40.9% 1,268 | 58.5% 1,812 | 0.6% 17 |
| 1936 | 28.3% 813 | 66.2% 1,903 | 5.5% 159 |
| 1932 | 31.0% 855 | 64.2% 1,772 | 4.9% 134 |
| 1928 | 59.6% 1,206 | 39.2% 793 | 1.2% 25 |
| 1924 | 51.1% 1,025 | 11.5% 231 | 37.5% 752 |
| 1920 | 54.3% 1,079 | 32.8% 651 | 12.9% 257 |
| 1916 | 43.2% 916 | 50.9% 1,080 | 5.9% 124 |
| 1912 | 14.6% 305 | 35.7% 747 | 49.8% 1,042[17] |
References
- "State & County QuickFacts". US Census Bureau. Archived from the original on June 7, 2011. Retrieved January 7, 2014.
- "Find a County". National Association of Counties. Retrieved June 7, 2011.
- "Milestones for Washington State History, Part 3: 1901 to 1950". HistoryLink.org. March 6, 2003.
- "2010 Census Gazetteer Files". US Census Bureau. August 22, 2012. Retrieved July 7, 2015.
- "Population and Housing Unit Estimates". Retrieved April 12, 2020.
- "US Decennial Census". US Census Bureau. Retrieved January 7, 2014.
- "Historical Census Browser". University of Virginia Library. Retrieved January 7, 2014.
- "Population of Counties by Decennial Census: 1900 to 1990". US Census Bureau. Retrieved January 7, 2014.
- "Census 2000 PHC-T-4. Ranking Tables for Counties: 1990 and 2000" (PDF). US Census Bureau. Retrieved January 7, 2014.
- "U.S. Census website". United States Census Bureau. Retrieved May 14, 2011.
- "Profile of General Population and Housing Characteristics: 2010 Demographic Profile Data". US Census Bureau. Archived from the original on February 13, 2020. Retrieved March 6, 2016.
- "Population, Housing Units, Area, and Density: 2010 – County". US Census Bureau. Archived from the original on February 13, 2020. Retrieved March 6, 2016.
- "Selected Social Characteristics in the United States – 2006–2010 American Community Survey 5-Year Estimates". US Census Bureau. Archived from the original on February 13, 2020. Retrieved March 6, 2016.
- "Selected Economic Characteristics – 2006–2010 American Community Survey 5-Year Estimates". US Census Bureau. Archived from the original on February 13, 2020. Retrieved March 6, 2016.
- Pend Oreille County WA Google Maps (accessed 21 October 2018)
- Leip, David. "Dave Leip's Atlas of U.S. Presidential Elections". uselectionatlas.org. Retrieved April 10, 2018.
- The leading "other" candidate, Progressive Theodore Roosevelt, received 716 votes, while Socialist candidate Eugene Debs received 288 votes, Prohibition candidate Eugene Chafin received 32 votes, and Socialist Labor candidate Arthur Reimer received 6 votes.
Places adjacent to Pend Oreille County, Washington | |
|---|---|
Municipalities and communities of Pend Oreille County, Washington, United States | ||
|---|---|---|
| City | Map of Washington highlighting Pend Oreille County | |
| Towns | ||
| Unincorporated communities | ||
| ||

| Authority control |
|---|