Cowlitz County, Washington
Cowlitz County is a county located in the U.S. state of Washington. As of the 2010 census, its population was 102,410.[1] The county seat is Kelso,[2] and its largest city is Longview. The county was formed in April 1854.[3] Its name derives from the anglicized version of the Cowlitz Indian term Cow-e-liske, meaning either 'river of shifting sands' or 'capturing the medicine spirit.'
Cowlitz County | |
|---|---|
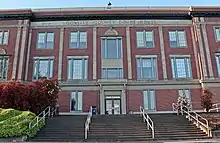 Cowlitz County Courthouse | |
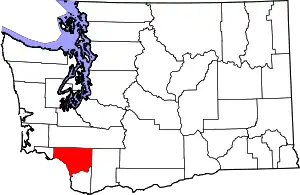 Location within the U.S. state of Washington | |
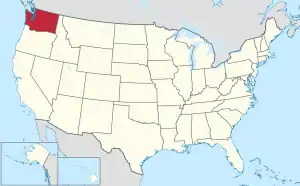 Washington's location within the U.S. | |
| Coordinates: 46°11′N 122°41′W | |
| Country | |
| State | |
| Founded | April 21, 1854 |
| Seat | Kelso |
| Largest city | Longview |
| Area | |
| • Total | 1,166 sq mi (3,020 km2) |
| • Land | 1,140 sq mi (3,000 km2) |
| • Water | 26 sq mi (70 km2) 2.2%% |
| Population (2010) | |
| • Total | 102,410 |
| • Estimate (2019) | 110,593 |
| • Density | 90/sq mi (30/km2) |
| Time zone | UTC−8 (Pacific) |
| • Summer (DST) | UTC−7 (PDT) |
| Congressional district | 3rd |
| Website | www |
Cowlitz comprises the Longview, WA Metropolitan Statistical Area, which is also included in the Portland-Vancouver-Salem, OR-WA Combined Statistical Area.[4]
History
Prior to the Europeans' arrival to the area, it was inhabited by numerous Native American tribes, with the Cowlitz tribe being the largest. They were drawn to the region by the abundance of salmon. The Cowlitz are considered to be the first regional inhabitants to engage in commerce as they traded extensively with other tribes in Western and Eastern Washington. The Cowlitz Indian population declined significantly from the 1829-1830 smallpox outbreak.
European explorers discovered and began navigating the Columbia River in 1792 as British Lieutenant W. R. Broughton sailed up the river to and past present day Cowlitz County. Then on November 5, 1805, Lewis and Clark camped at the mouth of the Kalama River. Over the following days, they would reach the present sites of Kelso and Longview.
By the 1820s, the Hudson's Bay Company had established a lucrative fur trade in the region. Furs were shipped down the Cowlitz River to the Columbia where they were loaded and shipped around the world. Trade declined significantly in the late 1830s as over-hunting reduced the annual yields, and wearing fur had become less fashionable.
During the next several decades, white settlement of the region was in full swing. Most of the settlers homesteaded near the tributaries that fed the Columbia River, forming settlements. The first was Monticello, near present-day Longview. In 1841 several families with the HBC directed Sinclair expedition from Red River Colony settled there.
On November 25, 1852 at Monticello, settlers from the Cowlitz and Puget Sound regions drafted a petition (the Monticello Convention) to the federal government, calling for a separate territory north of the Columbia River to be carved out of the existing Oregon Territory. The petition was successful; three months later the United States Congress formed the Columbia Territory, although it was soon renamed Washington Territory.
The newly separated territory was governed by two existing counties. In August 1845, the Oregon Territorial government had created Vancouver County. Its boundary covered the entire area of present-day Washington state. In December of that same year, the Oregon Territorial government sliced off the eastern portion to create Lewis County. In 1849 the reduced Vancouver County was renamed Clark County. So when the new Washington Territorial government began functioning, among its first actions was the creation of Cowlitz County, from the southwestern portion of Clark County. This proclamation was finalized on April 24, 1854, signed into law by Governor Isaac Stevens. Later in 1854, the western portion of the new county was partitioned off to form Wahkiakum County; otherwise the county's boundary has remained unchanged until the present.
Nearly every town that sprang up in the late 19th century began around a logging or lumber-milling operation. In the latter half of the 1920s, the Weyerhaeuser Company and Long-Bell Lumber Company established processing facilities. At the time, these two facilities were the first and second largest in the world. The county is still heavily dependent on the timber industry.[5]
Four towns have functioned as the Cowlitz County seat:[6]
- Monticello (1854–1865)
- Freeport (1865–1872)
- Kalama (1872–1922)
- Kelso (1922–Present)
Geography
Cowlitz County is in the southwestern part of Washington state. According to the U.S. Census Bureau, the county has a total area of 1,166 square miles (3,020 km2), of which 1,140 square miles (3,000 km2) is land and 26 square miles (67 km2) (2.2%) is water.[7]
Cowlitz County is part of the Puget Sound – Willamette Depression, a geologic formation extending southward from the Puget Sound to the Willamette Valley in Oregon. Nestled against the Cascade Mountains, many of the county's major rivers originate in this range, including the Columbia, Cowlitz, Coweeman, Kalama, Lewis and Toutle.[5]
Cowlitz County is one of the state's smaller counties (28 of 39).[8]
Geographic features
Major highways
Adjacent counties
- Lewis County - north
- Skamania County - east
- Clark County - south
- Wahkiakum County - west
National protected areas
County parks
- Catlin Cemetery
- Cougar Wayside
- Finn Hall Wayside
- Harry Gardner Park
- Hog Island Access
- Riverside Park
- SRS Viewpoint
- Woodbrook Park[9]
Demographics
| Historical population | |||
|---|---|---|---|
| Census | Pop. | %± | |
| 1860 | 406 | — | |
| 1870 | 730 | 79.8% | |
| 1880 | 2,062 | 182.5% | |
| 1890 | 5,917 | 187.0% | |
| 1900 | 7,877 | 33.1% | |
| 1910 | 12,561 | 59.5% | |
| 1920 | 11,791 | −6.1% | |
| 1930 | 31,906 | 170.6% | |
| 1940 | 40,155 | 25.9% | |
| 1950 | 53,369 | 32.9% | |
| 1960 | 57,801 | 8.3% | |
| 1970 | 68,616 | 18.7% | |
| 1980 | 79,548 | 15.9% | |
| 1990 | 82,119 | 3.2% | |
| 2000 | 92,948 | 13.2% | |
| 2010 | 102,410 | 10.2% | |
| 2019 (est.) | 110,593 | [10] | 8.0% |
| U.S. Decennial Census[11] 1790–1960[12] 1900–1990[13] 1990–2000[14] 2010–2019[1] | |||
2000 census
As of the census[15] of 2000, there were 92,948 people, 35,850 households, and 25,059 families living in the county. The population density was 82 people per square mile (32/km2). There were 38,624 housing units at an average density of 34 per square mile (13/km2). The racial makeup of the county was 91.80% White, 0.52% Black or African American, 1.52% Native American, 1.30% Asian, 0.13% Pacific Islander, 2.11% from other races, and 2.62% from two or more races. 4.55% of the population were Hispanic or Latino of any race. 18.6% were of German, 11.2% United States or American, 10.4% English, 8.6% Irish and 7.0% Norwegian ancestry. 94.6% spoke English, and 3.5% Spanish as their first language.
There were 35,850 households, out of which 32.80% had children under the age of 18 living with them, 54.60% were married couples living together, 10.70% had a female householder with no husband present, and 30.10% were non-families. 24.30% of all households were made up of individuals, and 9.70% had someone living alone who was 65 years of age or older. The average household size was 2.55 and the average family size was 3.01.
In the county, the population was spread out, with 26.80% under the age of 18, 8.30% from 18 to 24, 27.50% from 25 to 44, 24.10% from 45 to 64, and 13.30% who were 65 years of age or older. The median age was 37 years. For every 100 females there were 98.20 males. For every 100 females age 18 and over, there were 95.80 males.
The median income for a household in the county was $39,797, and the median income for a family was $46,532. Males had a median income of $40,378 versus $25,710 for females. The per capita income for the county was $18,583. About 10.30% of families and 14.00% of the population were below the poverty line, including 19.50% of those under age 18 and 6.60% of those age 65 or over.
2010 census
As of the 2010 United States Census, there were 102,410 people, 40,244 households, and 27,241 families living in the county.[16] The population density was 89.8 inhabitants per square mile (34.7/km2). There were 43,450 housing units at an average density of 38.1 per square mile (14.7/km2).[17] The racial makeup of the county was 88.9% white, 1.5% Asian, 1.5% American Indian, 0.6% black or African American, 0.2% Pacific islander, 3.5% from other races, and 3.7% from two or more races. Those of Hispanic or Latino origin made up 7.8% of the population.[16] In terms of ancestry, 24.4% were German, 15.0% were Irish, 12.3% were English, 6.2% were Norwegian, and 5.4% were American.[18]
Of the 40,244 households, 31.8% had children under the age of 18 living with them, 50.2% were married couples living together, 11.8% had a female householder with no husband present, 32.3% were non-families, and 25.8% of all households were made up of individuals. The average household size was 2.51 and the average family size was 2.99. The median age was 40.2 years.[16]
The median income for a household in the county was $45,877 and the median income for a family was $55,002. Males had a median income of $48,329 versus $32,438 for females. The per capita income for the county was $22,948. About 11.8% of families and 16.9% of the population were below the poverty line, including 23.3% of those under age 18 and 7.1% of those age 65 or over.[19]
Politics
The county had been reliably Democratic for over three decades, as even Walter Mondale won this county in Ronald Reagan's 49-state landslide in 1984. However, Donald Trump won a majority of the vote here in 2016, becoming the first Republican to win since Reagan in 1980. Other neighboring counties, like Pacific and Grays Harbor, also were Trump victories even though they had been reliably Democratic prior to 2016. In 2020, Donald Trump carried the county again with 57.4% of the vote, the strongest performance by any political candidate since Lyndon Johnson's 1964 landslide.
| Year | Republican | Democratic | Third parties |
|---|---|---|---|
| 2020 | 57.1% 34,424 | 39.7% 23,938 | 3.2% 1,918 |
| 2016 | 51.3% 24,185 | 38.0% 17,908 | 10.7% 5,049 |
| 2012 | 46.1% 20,746 | 50.5% 22,726 | 3.4% 1,540 |
| 2008 | 43.0% 19,554 | 54.1% 24,597 | 3.0% 1,361 |
| 2004 | 47.5% 20,217 | 50.8% 21,589 | 1.7% 724 |
| 2000 | 45.7% 16,873 | 49.3% 18,233 | 5.0% 1,856 |
| 1996 | 33.5% 11,221 | 53.9% 18,054 | 12.7% 4,240 |
| 1992 | 29.0% 10,000 | 43.6% 15,052 | 27.5% 9,477 |
| 1988 | 42.2% 12,009 | 56.5% 16,090 | 1.3% 366 |
| 1984 | 48.0% 14,858 | 49.6% 15,361 | 2.4% 749 |
| 1980 | 45.9% 13,154 | 43.9% 12,560 | 10.2% 2,925 |
| 1976 | 44.1% 12,531 | 52.7% 14,958 | 3.2% 917 |
| 1972 | 51.2% 14,431 | 45.0% 12,682 | 3.8% 1,069 |
| 1968 | 42.1% 10,842 | 51.9% 13,363 | 6.0% 1,545 |
| 1964 | 27.4% 6,708 | 71.9% 17,605 | 0.8% 188 |
| 1960 | 49.8% 12,103 | 49.6% 12,054 | 0.6% 153 |
| 1956 | 48.8% 11,912 | 51.0% 12,448 | 0.2% 50 |
| 1952 | 52.1% 12,366 | 47.3% 11,242 | 0.6% 138 |
| 1948 | 37.6% 7,098 | 58.6% 11,075 | 3.9% 729 |
| 1944 | 36.7% 6,157 | 62.4% 10,485 | 0.9% 157 |
| 1940 | 34.3% 6,078 | 64.5% 11,420 | 1.2% 216 |
| 1936 | 25.3% 3,617 | 71.0% 10,147 | 3.7% 528 |
| 1932 | 33.9% 3,767 | 49.0% 5,443 | 17.1% 1,903 |
| 1928 | 68.8% 5,882 | 30.2% 2,581 | 1.1% 91 |
| 1924 | 55.7% 3,274 | 15.8% 927 | 28.6% 1,681 |
| 1920 | 61.5% 2,267 | 21.7% 801 | 16.8% 619 |
| 1916 | 55.1% 2,113 | 33.4% 1,282 | 11.5% 439 |
| 1912 | 34.7% 1,348 | 23.6% 919 | 41.7% 1,622[21] |
| 1908 | 65.7% 1,573 | 25.8% 617 | 8.6% 206 |
| 1904 | 77.3% 1,589 | 15.4% 317 | 7.3% 149 |
| 1900 | 63.3% 1,171 | 33.5% 619 | 3.2% 59 |
| 1896 | 49.8% 989 | 49.0% 974 | 1.3% 25 |
| 1892 | 41.7% 738 | 32.0% 566 | 26.3% 466 |
Communities
Cities
- Castle Rock
- Kalama
- Kelso (County seat)
- Longview
- Woodland (Partly in Clark County)
Census-designated places
Unincorporated communities
- Ariel
- Bunker Hill
- Caples
- Caples Landing
- Carrolls
- Coal Creek
- Cougar
- Davis Terrace
- Eufaula
- Eufaula Heights
- Evergreen Terrace
- Harrington Place
- Headquarters
- Kid Valley
- Oak Point
- Olequa
- Ostrander
- Pigeon Springs
- Pleasant Hill
- Rocky Point
- Rose Valley
- Saint Helens
- Sandy Bend
- Sightly
- Silver Lake
- Stella
- Toutle
- Vision Acres
- West Longview
- Woodland Park
- Yale
See also
- National Register of Historic Places listings in Cowlitz County, Washington
- Impact of the 2019–20 coronavirus pandemic on the meat industry in the United States
References
- "State & County QuickFacts". United States Census Bureau. Archived from the original on July 9, 2011. Retrieved January 7, 2014.
- "Find a County". National Association of Counties. Archived from the original on May 31, 2011. Retrieved June 7, 2011.
- "Milestones for Washington State History — Part 2: 1851 to 1900". HistoryLink.org. March 6, 2003.
- "Revised Delineations of Metropolitan Statistical Areas, Micropolitan Statistical Areas, and Combined Statistical Areas, and Guidance on Uses of the Delineations of These Areas" (PDF). Office of Management and Budget. February 28, 2013. Archived from the original (PDF) on March 19, 2013. Retrieved July 5, 2015.
- "Cowlitz and Wahkiakum County Profile" (PDF). Employment Security Department. October 1998. Archived from the original (CSV) on July 3, 2010. Retrieved September 14, 2009.
- "Cowlitz County" (CSV). Retrieved September 14, 2009.
- "2010 Census Gazetteer Files". United States Census Bureau. August 22, 2012. Retrieved July 4, 2015.
- "Region 4" (PDF). Washington State Hazard Mitigation Plan. April 2004. Archived from the original (CSV) on July 19, 2011. Retrieved September 14, 2009.
- "Cowlitz County Parks and Recreation Division". co.cowlitz.wa.us/. September 10, 2009. Archived from the original on June 14, 2009.
- "Population and Housing Unit Estimates". Retrieved April 11, 2020.
- "U.S. Decennial Census". United States Census Bureau. Retrieved January 7, 2014.
- "Historical Census Browser". University of Virginia Library. Retrieved January 7, 2014.
- "Population of Counties by Decennial Census: 1900 to 1990". United States Census Bureau. Retrieved January 7, 2014.
- "Census 2000 PHC-T-4. Ranking Tables for Counties: 1990 and 2000" (PDF). United States Census Bureau. Retrieved January 7, 2014.
- "U.S. Census website". United States Census Bureau. Retrieved May 14, 2011.
- "Profile of General Population and Housing Characteristics: 2010 Demographic Profile Data". United States Census Bureau. Archived from the original on February 13, 2020. Retrieved March 1, 2016.
- "Population, Housing Units, Area, and Density: 2010 - County". United States Census Bureau. Archived from the original on February 13, 2020. Retrieved March 1, 2016.
- "Selected Social Characteristics in the United States – 2006-2010 American Community Survey 5-Year Estimates". United States Census Bureau. Archived from the original on February 13, 2020. Retrieved March 1, 2016.
- "Selected Economic Characteristics – 2006-2010 American Community Survey 5-Year Estimates". United States Census Bureau. Archived from the original on February 13, 2020. Retrieved March 1, 2016.
- Leip, David. "Dave Leip's Atlas of U.S. Presidential Elections". uselectionatlas.org. Retrieved April 6, 2018.
- The leading "other" candidate, Progressive Theodore Roosevelt, received 1,006 votes, while Socialist candidate Eugene Debs received 527 votes, Prohibition candidate Eugene Chafin received 79 votes, and Socialist Labor candidate Arthur Reimer received 10 votes.
Places adjacent to Cowlitz County, Washington | ||||||||||
|---|---|---|---|---|---|---|---|---|---|---|
| ||||||||||
Municipalities and communities of Cowlitz County, Washington, United States | ||
|---|---|---|
| Cities | Map of Washington highlighting Cowlitz County | |
| CDPs | ||
| Unincorporated communities |
| |
| Footnotes | ‡This populated place also has portions in an adjacent county or counties | |
| ||

| Authority control |
|---|