San Juan County, Washington
San Juan County is a county located in the Salish Sea in the far northwestern corner of the U.S. state of Washington. As of the 2010 census, its population was 15,769.[1] The county seat and only incorporated city is Friday Harbor,[2] located on San Juan Island. The county was formed on October 31, 1873, from Whatcom County[3] and is named for the San Juan Islands, which are in turn named for Juan Vicente de Güemes, 2nd Count of Revillagigedo,[4] the Viceroy of New Spain.
San Juan County | |
|---|---|
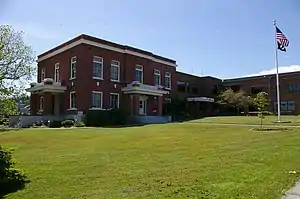 San Juan County Courthouse | |
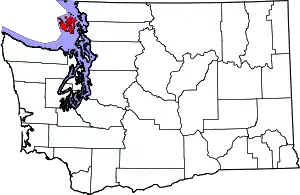 Location within the U.S. state of Washington | |
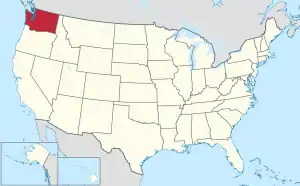 Washington's location within the U.S. | |
| Coordinates: 48°34′N 122°58′W | |
| Country | |
| State | |
| Founded | October 31, 1873 |
| Named for | San Juan Islands |
| Seat | Friday Harbor |
| Largest town | Friday Harbor |
| Area | |
| • Total | 621 sq mi (1,610 km2) |
| • Land | 174 sq mi (450 km2) |
| • Water | 447 sq mi (1,160 km2) 72%% |
| Population (2010) | |
| • Total | 15,769 |
| • Estimate (2019) | 17,582 |
| • Density | 96/sq mi (37/km2) |
| Time zone | UTC−8 (Pacific) |
| • Summer (DST) | UTC−7 (PDT) |
| Congressional district | 2nd |
| Website | www |
Although the islands themselves have no state highways, the ferry routes serving the islands are designated as part of the state highway system.
History
The San Juan Islands were the subject of a territorial dispute between Great Britain and the United States from 1846 to 1872, leading to the Pig War in 1859.
Geography
According to the U.S. Census Bureau, the county has a total area of 621 square miles (1,610 km2), of which 174 square miles (450 km2) is land and 447 square miles (1,160 km2) (72%) is water.[5] It is the smallest county in Washington by land area and fourth-smallest by total area.
San Juan County is a cluster of more than 400 islands and rocks with elevations above mean high tide. 134 of these islands and rocks are named. The county has a rugged, rocky shoreline and several mountains. The highest point in the county is Mount Constitution on Orcas Island at 2,407 feet (734 m) above sea level.
Geographic features
Major islands
There are approximately 743 islands and rocks in the San Juan Island chain. Most of the county's population lives on the largest four islands, which are the only county islands served by the Washington State Ferries. The four largest islands are:
- Orcas Island (149.43 km2/57.7 sq mi)
- San Juan Island (143.62 km2/55.5 sq mi)
- Lopez Island (76.57 km2/29.6 sq mi)
- Shaw Island (19.64 km2/7.6 sq mi)
Adjacent counties
- Whatcom County – northeast
- Skagit County – east
- Island County – southeast
- Jefferson County – south
- Clallam County – south/southwest
- Capital Regional District, British Columbia – west
Demographics
| Historical population | |||
|---|---|---|---|
| Census | Pop. | %± | |
| 1870 | 554 | — | |
| 1880 | 948 | 71.1% | |
| 1890 | 2,072 | 118.6% | |
| 1900 | 2,928 | 41.3% | |
| 1910 | 3,603 | 23.1% | |
| 1920 | 3,605 | 0.1% | |
| 1930 | 3,097 | −14.1% | |
| 1940 | 3,157 | 1.9% | |
| 1950 | 3,245 | 2.8% | |
| 1960 | 2,872 | −11.5% | |
| 1970 | 3,856 | 34.3% | |
| 1980 | 7,838 | 103.3% | |
| 1990 | 10,035 | 28.0% | |
| 2000 | 14,077 | 40.3% | |
| 2010 | 15,769 | 12.0% | |
| 2019 (est.) | 17,582 | [6] | 11.5% |
| U.S. Decennial Census[7] 1790–1960[8] 1900–1990[9] 1990–2000[10] 2010–2019[1] | |||
2000 census
As of the census[11] of 2000 there were 14,077 people living in the county in 6,466 households and 4,015 families, resulting in a population density of 80 people per square mile (31/km2). The census reported 9,752 housing units at an average density of 56 per square mile (22/km2). The residents of the county reported their race as 95.0% White, 0.3% Black or African American, 0.8% Native American, 0.9% Asian, 0.1% Pacific Islander, 0.9% from other races, and 2.0% from two or more races. 2.4% of the population identified themselves as Hispanic or Latino of any race. In response to the census question concerning ancestry, 16.7% reported English ancestry; 15.0%, German; 11.6%, Irish; 5.7%, United States or American; 5.4%, French; and 5.0%, Norwegian.
Of the 6,466 households, 22.90% had children under the age of 18; 51.80% were married couples living together; 6.90% had a female householder with no husband present; 37.90% were not families; 30.60% were individuals; and 10.70% were individuals 65 years of age or older, living alone. The average household size was 2.16 persons and the average family size was 2.65.
19.1% of the county's population was under the age of 18; 4.5% ranged in age from 18 to 24; 21.7%, 25–44; 35.7%, 45–64; and 19.0%, 65 or older. The median age was 47 years. For every 100 females, there were 95.10 males. For every 100 females age 18 and over, there were 93.00 males.
The median income for a household in the county was $43,491, and the median income for a family was $51,835. Males had a median income of $36,250 versus $26,516 for females. The per capita income for the county was $30,603. About 6.0% of families and 9.2% of the population were below the poverty line, including 12.4% of those under age 18 and 3.1% of those age 65 or over.
San Juan county has the highest per capita income in the state of Washington. Deer Harbor, located in the county, has a per capita income exceeding $100,000. Waldron Island, with a population of 104 in the 2000 census, is considered one of the most impoverished areas in Washington, with about 56% of the people living in poverty.
In a survey by the University of Wisconsin Population Health Institute and the Robert Wood Johnson Foundation, San Juan County was ranked the healthiest in the state of Washington.[12]
2010 census
As of the 2010 United States Census, there were 15,769 people, 7,613 households, and 4,438 families residing in the county.[13] The population density was 90.7 inhabitants per square mile (35.0/km2). There were 13,313 housing units at an average density of 76.5 per square mile (29.5/km2).[14] The racial makeup of the county was 92.6% white, 1.1% Asian, 0.7% American Indian, 0.3% black or African American, 0.1% Pacific islander, 2.6% from other races, and 2.5% from two or more races. Those of Hispanic or Latino origin made up 5.4% of the population.[13] The largest ancestry groups were:[15]
- 19.6% German
- 19.3% English
- 14.1% Irish
- 5.6% Norwegian
- 5.6% Scottish
- 5.0% French
- 4.4% Swedish
- 4.2% Mexican
- 3.6% Italian
- 3.1% Scotch-Irish
- 2.9% Dutch
- 2.8% American
- 2.1% Welsh
- 1.8% Polish
- 1.7% Russian
- 1.6% Danish
- 1.4% British
- 1.1% Swiss
- 1.0% Canadian
Of the 7,613 households, 19.3% had children under the age of 18 living with them, 48.3% were married couples living together, 6.6% had a female householder with no husband present, 41.7% were non-families, and 34.0% of all households were made up of individuals. The average household size was 2.05 and the average family size was 2.56. The median age was 52.7 years.[13]
The median income for a household in the county was $50,726 and the median income for a family was $61,096. Males had a median income of $44,190 versus $32,911 for females. The per capita income for the county was $35,487. About 7.6% of families and 10.1% of the population were below the poverty line, including 13.3% of those under age 18 and 5.2% of those age 65 or over.[16]
Politics
This county is usually even more liberal than the famously liberal King County, but does not have the reputation King County does because its population is so much smaller, and therefore its effect on elections much weaker. The only area of the county won by George W. Bush in 2004 was the Decatur Island/Blakely Island precinct, with just over 50 votes. Waldron Island's precinct voted 96.5% for John Kerry. In 2006, Maria Cantwell, the Democrat running for re-election to the U.S. Senate, won all precincts.[17]
| Year | Republican | Democratic | Third parties |
|---|---|---|---|
| 2020 | 23.2% 3,057 | 73.7% 9,725 | 3.1% 415 |
| 2016 | 24.1% 2,688 | 64.4% 7,172 | 11.4% 1,274 |
| 2012 | 29.1% 3,111 | 66.6% 7,125 | 4.3% 456 |
| 2008 | 27.9% 2,958 | 69.7% 7,374 | 2.4% 254 |
| 2004 | 32.6% 3,290 | 65.2% 6,589 | 2.2% 225 |
| 2000 | 35.7% 3,005 | 52.5% 4,426 | 11.8% 993 |
| 1996 | 34.3% 2,523 | 49.8% 3,663 | 15.9% 1,168 |
| 1992 | 26.7% 1,901 | 47.1% 3,353 | 26.2% 1,863 |
| 1988 | 45.8% 2,660 | 51.7% 3,008 | 2.5% 146 |
| 1984 | 52.5% 2,900 | 45.5% 2,514 | 2.0% 112 |
| 1980 | 47.0% 2,363 | 33.1% 1,666 | 19.9% 1,002 |
| 1976 | 53.7% 1,998 | 39.4% 1,467 | 6.9% 257 |
| 1972 | 63.9% 1,786 | 32.4% 906 | 3.7% 103 |
| 1968 | 59.3% 1,164 | 34.9% 685 | 5.8% 114 |
| 1964 | 47.9% 839 | 51.8% 906 | 0.3% 5 |
| 1960 | 63.9% 1,112 | 35.9% 624 | 0.2% 4 |
| 1956 | 65.3% 1,105 | 34.5% 584 | 0.2% 4 |
| 1952 | 64.2% 1,133 | 35.1% 619 | 0.8% 14 |
| 1948 | 55.9% 881 | 40.4% 636 | 3.7% 58 |
| 1944 | 51.9% 703 | 47.6% 644 | 0.5% 7 |
| 1940 | 48.2% 808 | 51.3% 860 | 0.4% 7 |
| 1936 | 43.3% 690 | 48.6% 775 | 8.2% 130 |
| 1932 | 40.4% 607 | 52.4% 786 | 7.2% 108 |
| 1928 | 66.7% 814 | 32.8% 400 | 0.5% 6 |
| 1924 | 66.7% 744 | 7.7% 86 | 25.6% 286 |
| 1920 | 66.6% 833 | 15.7% 196 | 17.7% 221 |
| 1916 | 42.4% 591 | 48.0% 669 | 9.7% 135 |
| 1912 | 27.5% 341 | 25.1% 311 | 47.4% 587 |
| 1908 | 66.0% 581 | 20.2% 178 | 13.9% 122 |
| 1904 | 72.0% 554 | 14.7% 113 | 13.4% 103 |
| 1900 | 61.5% 428 | 35.2% 245 | 3.3% 23 |
| 1896 | 58.3% 411 | 41.3% 291 | 0.4% 3 |
| 1892 | 54.9% 348 | 35.7% 226 | 9.5% 60 |
Communities
Town
- Friday Harbor (county seat)
Unincorporated communities
- Argyle
- Beach Haven
- Blakely Island
- Crane Island
- Decatur
- Decatur Island
- Deer Harbor
- Doe Bay
- Eastsound
- Lopez Island
- Olga
- Orcas Village
- Orcas Island
- Port Stanley
- Richardson
- Roche Harbor
- Rockland
- Shaw Island
- Thatcher
- Waldron
- West Beach
See also
References
- "State & County QuickFacts". United States Census Bureau. Archived from the original on July 18, 2011. Retrieved January 7, 2014.
- "Find a County". National Association of Counties. Retrieved June 7, 2011.
- "Milestones for Washington State History — Part 2: 1851 to 1900". HistoryLink.org. March 6, 2003.
- Hayes, Derek (1999). Historical Atlas of the Pacific Northwest: Maps of Exploration and Discovery ; British Columbia, Washington, Oregaon, Alaska, Yukon. Sasquatch Books. pp. 72–73. ISBN 978-1-57061-215-2. Retrieved April 21, 2013.
- "2010 Census Gazetteer Files". United States Census Bureau. August 22, 2012. Retrieved July 16, 2015.
- "Population and Housing Unit Estimates". Retrieved April 12, 2020.
- "U.S. Decennial Census". United States Census Bureau. Retrieved January 7, 2014.
- "Historical Census Browser". University of Virginia Library. Retrieved January 7, 2014.
- "Population of Counties by Decennial Census: 1900 to 1990". United States Census Bureau. Retrieved January 7, 2014.
- "Census 2000 PHC-T-4. Ranking Tables for Counties: 1990 and 2000" (PDF). United States Census Bureau. Retrieved January 7, 2014.
- "U.S. Census website". United States Census Bureau. Retrieved May 14, 2011.
- The News Tribune, February 17, 2010 – Tacoma, WA.,
- "DP-1 Profile of General Population and Housing Characteristics: 2010 Demographic Profile Data". United States Census Bureau. Archived from the original on February 13, 2020. Retrieved March 6, 2016.
- "Population, Housing Units, Area, and Density: 2010 – County". United States Census Bureau. Archived from the original on February 13, 2020. Retrieved March 6, 2016.
- "DP02 SELECTED SOCIAL CHARACTERISTICS IN THE UNITED STATES – 2006–2010 American Community Survey 5-Year Estimates". United States Census Bureau. Archived from the original on February 13, 2020. Retrieved March 6, 2016.
- "DP03 SELECTED ECONOMIC CHARACTERISTICS – 2006–2010 American Community Survey 5-Year Estimates". United States Census Bureau. Archived from the original on February 13, 2020. Retrieved March 6, 2016.
- Leip, David (2005). "2006 Senatorial General Election Results – San Juan County, WA".
- Leip, David. "Dave Leip's Atlas of U.S. Presidential Elections". uselectionatlas.org. Retrieved April 10, 2018.
External links
Places adjacent to San Juan County, Washington | ||||||||||
|---|---|---|---|---|---|---|---|---|---|---|
| ||||||||||
Municipalities and communities of San Juan County, Washington, United States | ||
|---|---|---|
| Populated islands | Map of Washington highlighting San Juan County | |
| Town | ||
| Other communities | ||
| ||

| Authority control |
|---|