Stevens County, Washington
Stevens County is a county located in the U.S. state of Washington along the Canada–US border. At the 2010 census, its population was 43,531.[1] As of July 2019, the population was estimated to be 45,723. The county seat and largest city is Colville.[2] The county was created in 1863[3] and named after Isaac Stevens, the first governor of Washington Territory.
Stevens County | |
|---|---|
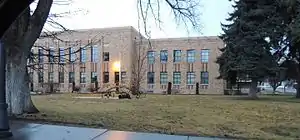 Stevens County Courthouse in Colville | |
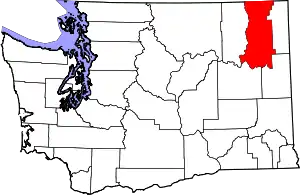 Location within the U.S. state of Washington | |
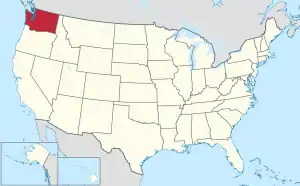 Washington's location within the U.S. | |
| Coordinates: 48°24′N 117°51′W | |
| Country | |
| State | |
| Founded | January 20, 1863 |
| Named for | Isaac Stevens |
| Seat | Colville |
| Largest city | Colville |
| Area | |
| • Total | 2,541 sq mi (6,580 km2) |
| • Land | 2,478 sq mi (6,420 km2) |
| • Water | 63 sq mi (160 km2) 2.5%% |
| Population (2010) | |
| • Total | 43,531 |
| • Estimate (2019) | 45,723 |
| • Density | 18/sq mi (7/km2) |
| Time zone | UTC−8 (Pacific) |
| • Summer (DST) | UTC−7 (PDT) |
| Congressional district | 5th |
| Website | www |
Stevens County is included in the Spokane-Spokane Valley, WA Metropolitan Statistical Area.
Geography
According to the U.S. Census Bureau, the county has a total area of 2,541 square miles (6,580 km2), of which 2,478 square miles (6,420 km2) is land and 63 square miles (160 km2) (2.5%) is water.[4]
Geographic features
Adjacent counties
- Pend Oreille County – east
- Spokane County – southeast
- Lincoln County – southwest
- Ferry County – west
- Kootenay Boundary Regional District, British Columbia – northeast
- Regional District of Central Kootenay, British Columbia – north
National protected areas
Demographics
| Historical population | |||
|---|---|---|---|
| Census | Pop. | %± | |
| 1860 | 996 | — | |
| 1870 | 734 | −26.3% | |
| 1880 | 1,245 | 69.6% | |
| 1890 | 4,341 | 248.7% | |
| 1900 | 10,543 | 142.9% | |
| 1910 | 25,297 | 139.9% | |
| 1920 | 21,605 | −14.6% | |
| 1930 | 18,550 | −14.1% | |
| 1940 | 19,275 | 3.9% | |
| 1950 | 18,580 | −3.6% | |
| 1960 | 17,884 | −3.7% | |
| 1970 | 17,405 | −2.7% | |
| 1980 | 28,979 | 66.5% | |
| 1990 | 30,948 | 6.8% | |
| 2000 | 40,066 | 29.5% | |
| 2010 | 43,531 | 8.6% | |
| 2019 (est.) | 45,723 | [5] | 5.0% |
| U.S. Decennial Census[6] 1790–1960[7] 1900–1990[8] 1990–2000[9] 2010–2019[1] | |||
2000 census
At the 2000 census there were 40,066 people, 15,017 households, and 11,022 families in the county. The population density was 16 people per square mile (6/km2). There were 17,599 housing units at an average density of 7 per square mile (3/km2). The racial makeup of the county was 90.05% White, 0.28% Black or African American, 5.66% Native American, 0.48% Asian, 0.16% Pacific Islander, 0.68% from other races, and 2.70% from two or more races. 1.84%.[10] were Hispanic or Latino of any race. 20.6% were of German, 18.9% United States or American, 10.0% English, 7.9% Irish and 5.0% Norwegian ancestry.
Of the 15,017 households 34.40% had children under the age of 18 living with them, 60.40% were married couples living together, 8.70% had a female householder with no husband present, and 26.60% were non-families. 22.00% of households were one person and 8.80% were one person aged 65 or older. The average household size was 2.64 and the average family size was 3.08.
The age distribution was 28.70% under the age of 18, 6.40% from 18 to 24, 24.90% from 25 to 44, 27.10% from 45 to 64, and 12.90% 65 or older. The median age was 39 years. For every 100 females there were 99.10 males. For every 100 females age 18 and over, there were 96.60 males.
The median household income was $34,673 and the median family income was $40,250. Males had a median income of $35,256 versus $23,679 for females. The per capita income for the county was $15,895. About 11.50% of families and 15.90% of the population were below the poverty line, including 19.80% of those under age 18 and 11.90% of those age 65 or over.
2010 census
At the 2010 census,[11] the population density was 17.6 inhabitants per square mile (6.8/km2). There were 21,156 housing units at an average density of 8.5 per square mile (3.3/km2).[12] The racial makeup of the county was 88.9% White, 0.6% Black or African American, 1.5% Native American, 1.5% Asian, 0.2% Pacific Islander, 3.5% from other races, 3.7% two or more races. Those of Hispanic or Latino origin made up 2.7% of the population.[11] In terms of ancestry, 24.6% were German, 14.2% were Irish, 13.7% were English, 6.4% were Norwegian, and 6.1% were American.[13]
Of the households, 29.6% had children under the age of 18 living with them, 56.3% were married couples living together, 9.0% had a female householder with no husband present, 29.9% were non-families, and 24.6% of households were made up of individuals. The average household size was 2.50 and the average family size was 2.95. The median age was 45.0 years.[11]
The median household income was $42,845 and the median family income was $51,544. Males had a median income of $46,721 versus $33,651 for females. The per capita income for the county was $21,773. About 11.0% of families and 15.1% of the population were below the poverty line, including 21.1% of those under age 18 and 9.3% of those age 65 or over.[14]
Politics
| Year | Republican | Democratic | Third parties |
|---|---|---|---|
| 2020 | 69.7% 19,808 | 27.6% 7,839 | 2.8% 783 |
| 2016 | 64.8% 15,161 | 24.7% 5,767 | 10.5% 2,467 |
| 2012 | 60.9% 13,691 | 34.5% 7,762 | 4.7% 1,047 |
| 2008 | 58.1% 13,132 | 37.6% 8,499 | 4.3% 960 |
| 2004 | 64.0% 13,015 | 33.5% 6,822 | 2.5% 503 |
| 2000 | 62.8% 11,299 | 30.9% 5,560 | 6.3% 1,140 |
| 1996 | 47.0% 7,524 | 34.9% 5,591 | 18.1% 2,907 |
| 1992 | 38.6% 5,706 | 33.5% 4,960 | 27.9% 4,121 |
| 1988 | 55.0% 6,576 | 42.4% 5,068 | 2.7% 318 |
| 1984 | 64.3% 8,211 | 33.7% 4,304 | 2.0% 256 |
| 1980 | 61.5% 7,094 | 31.1% 3,584 | 7.4% 852 |
| 1976 | 51.8% 4,719 | 42.0% 3,824 | 6.2% 566 |
| 1972 | 61.3% 4,839 | 30.3% 2,390 | 8.5% 670 |
| 1968 | 46.8% 3,435 | 40.1% 2,948 | 13.1% 962 |
| 1964 | 43.6% 3,302 | 56.3% 4,266 | 0.1% 10 |
| 1960 | 51.2% 4,076 | 48.5% 3,861 | 0.2% 18 |
| 1956 | 54.1% 4,499 | 45.8% 3,808 | 0.2% 15 |
| 1952 | 56.5% 4,458 | 42.6% 3,355 | 0.9% 72 |
| 1948 | 40.1% 2,977 | 56.6% 4,205 | 3.4% 252 |
| 1944 | 44.0% 3,151 | 55.1% 3,951 | 0.9% 63 |
| 1940 | 39.5% 3,238 | 59.8% 4,904 | 0.8% 66 |
| 1936 | 28.6% 1,981 | 65.4% 4,536 | 6.0% 418 |
| 1932 | 32.1% 2,247 | 60.9% 4,262 | 6.9% 485 |
| 1928 | 63.1% 3,813 | 35.5% 2,147 | 1.5% 88 |
| 1924 | 48.9% 2,909 | 11.5% 685 | 39.5% 2,350 |
| 1920 | 55.7% 3,282 | 24.6% 1,452 | 19.7% 1,160 |
| 1916 | 40.3% 2,684 | 47.8% 3,184 | 11.8% 788 |
| 1912 | 13.5% 810 | 33.0% 1,979 | 53.5% 3,212[16] |
| 1908 | 52.1% 2,546 | 32.0% 1,564 | 15.9% 774 |
| 1904 | 63.3% 2,369 | 23.3% 872 | 13.4% 501 |
| 1900 | 40.0% 1,121 | 57.5% 1,612 | 2.6% 73 |
| 1896 | 18.1% 433 | 80.4% 1,926 | 1.5% 36 |
| 1892 | 37.3% 622 | 30.1% 501 | 32.6% 544 |
References
- "State & County QuickFacts". United States Census Bureau. Retrieved January 7, 2014.
- "Find a County". National Association of Counties. Archived from the original on May 31, 2011. Retrieved June 7, 2011.
- "Milestones for Washington State History — Part 2: 1851 to 1900". HistoryLink.org. March 6, 2003.
- "2010 Census Gazetteer Files". United States Census Bureau. August 22, 2012. Retrieved July 16, 2015.
- "Population and Housing Unit Estimates". Retrieved April 11, 2020.
- "U.S. Decennial Census". United States Census Bureau. Retrieved January 7, 2014.
- "Historical Census Browser". University of Virginia Library. Retrieved January 7, 2014.
- "Population of Counties by Decennial Census: 1900 to 1990". United States Census Bureau. Retrieved January 7, 2014.
- "Census 2000 PHC-T-4. Ranking Tables for Counties: 1990 and 2000" (PDF). United States Census Bureau. Retrieved January 7, 2014.
- "U.S. Census website". United States Census Bureau. Retrieved May 14, 2011.
- "DP-1 Profile of General Population and Housing Characteristics: 2010 Demographic Profile Data". United States Census Bureau. Archived from the original on February 13, 2020. Retrieved March 6, 2016.
- "Population, Housing Units, Area, and Density: 2010 – County". United States Census Bureau. Archived from the original on February 13, 2020. Retrieved March 6, 2016.
- "DP02 SELECTED SOCIAL CHARACTERISTICS IN THE UNITED STATES – 2006–2010 American Community Survey 5-Year Estimates". United States Census Bureau. Archived from the original on February 13, 2020. Retrieved March 6, 2016.
- "DP03 SELECTED ECONOMIC CHARACTERISTICS – 2006–2010 American Community Survey 5-Year Estimates". United States Census Bureau. Archived from the original on February 13, 2020. Retrieved March 6, 2016.
- Leip, David. "Dave Leip's Atlas of U.S. Presidential Elections". uselectionatlas.org. Retrieved April 10, 2018.
- The leading "other" candidate, Progressive Theodore Roosevelt, received 1,971 votes, while Socialist candidate Eugene Debs received 988 votes, Prohibition candidate Eugene Chafin received 227 votes, and Socialist Labor candidate Arthur Reimer received 26 votes.
Further reading
- An illustrated history of Stevens, Ferry, Okanogan and Chelan counties, State of Washington. Western Historical Pub. Co. 1904.Available online through the Washington State Library's Classics in Washington History collection
External links
- Stevens County, Washington Government Page
- The Stevens County Wiki Project: A community wiki project, dedicated to creating an online wiki guide to Stevens County, Washington. Powered by Media Wiki.
- Stevens County Rural Library District: hosts of the Stevens County Wiki Project, the Stevens County Library District (SCRLD) has various regional links available from their website.
- Stevens County Heritage Historical photos and documents from the Libraries of Stevens County.
- uppercolumbia.net: a regional portal site for Stevens County and beyond. Includes business links and events calendar.
- The Heritage Network: History and Genealogy Resources for the Upper Columbia Region.
- An 1884 hailstorm in Stevens County on Wikisource
- Crossroads on the Columbia Preserve America Project Interpretive Section
- Crossroads on the Columbia Preserve America Project collection, exhibits, and images from museum and private collections covering Stevens County
Places adjacent to Stevens County, Washington | |
|---|---|
Municipalities and communities of Stevens County, Washington, United States | ||
|---|---|---|
| Cities | Map of Washington highlighting Stevens County | |
| Towns | ||
| CDPs | ||
| Other unincorporated communities | ||
| Ghost towns | ||
| ||

| Authority control |
|---|