Yakima County, Washington
Yakima County is a county in the U.S. state of Washington. As of the 2010 census, its population was 243,231.[1] The county seat and largest city is Yakima.[2] The county was formed out of Ferguson County in January 1865 and is named for the Yakama tribe of Native Americans.
Yakima County | |
|---|---|
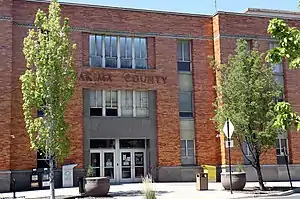 Yakima County Courthouse | |
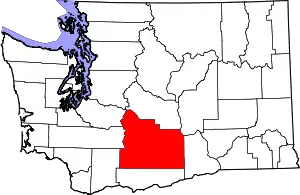 Location within the U.S. state of Washington | |
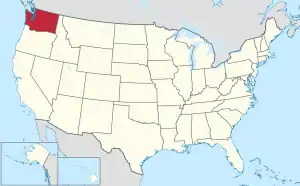 Washington's location within the U.S. | |
| Coordinates: 46°28′N 120°44′W | |
| Country | |
| State | |
| Founded | January 21, 1865 |
| Named for | Yakama Nation |
| Seat | Yakima |
| Largest city | Yakima |
| Area | |
| • Total | 4,311 sq mi (11,170 km2) |
| • Land | 4,295 sq mi (11,120 km2) |
| • Water | 16 sq mi (40 km2) 0.4%% |
| Population (2010) | |
| • Total | 243,231 |
| • Estimate (2019) | 250,873 |
| • Density | 58/sq mi (22/km2) |
| Time zone | UTC−8 (Pacific) |
| • Summer (DST) | UTC−7 (PDT) |
| Congressional district | 4th |
| Website | www |
Yakima County comprises the Yakima, WA Metropolitan Statistical Area.
History
The area that now comprises Yakima County was part of the Oregon Country at the start of the nineteenth century, inhabited both by fur prospectors from Canada, and Americans seeking land for agricultural and mineral-extraction opportunities. Unable to resolve which country should control this vast area, the Treaty of 1818 provided for joint control. By 1843, the Provisional Government of Oregon had been established, although at first there were questions as to its authority and extent. During its existence, that provisional government formed the area north of the Columbia River first into the Washington Territory, and then (December 19, 1845) into two vast counties: Clark and Lewis.
The Washington Territory was formed as a separate governing entity in 1853. In 1854, that legislature carved several counties out of the two original large counties, including Skamania County. Later in 1854 the new Skamania County was reduced in size by carving out Walla Walla County. This arrangement lasted until January 23, 1863, when Ferguson County was carved out of Walla Walla County.[3] However, the Ferguson County government and boundary was dissolved on January 18, 1865, and its area was assigned to Yakima County three days later.
Since its creation, the Yakima County boundary has been altered two times. In 1883 a portion of its area was carved off in the creation of Kittitas County, and in 1905 a further reduction added to the creation of Benton County.
The Yakama Indian Reservation was created in 1855. However, several tribes felt the agreement creating this reserved area had been completed without sufficient native input, and skirmishes and local war (the Yakima War, which lasted until 1858) meant that the reservation was not fully operational for two decades. The Reservation is the 15th largest reservation in America, covering 1,573 mi2 (4,074 km2),[4] and comprising 36% of the county's total area. Its population was 31,799 in 2000, and its largest city is Toppenish.
Geography

According to the U.S. Census Bureau, the county has a total area of 4,311 square miles (11,170 km2), of which 4,295 square miles (11,120 km2) is land and 16 square miles (41 km2) (0.4%) is water.[5] Yakima County is the second-largest county in Washington by land area and third-largest by total area. Yakima County is reputed to be one of the most difficult places on earth to predict weather, because of its surrounding mountains. The county's area is larger than the states of Delaware and Rhode Island combined.[6] The highest point in the county is Mount Adams, which is the second tallest peak in Washington and the third tallest in the Cascade Range.
Geographic features

- Mount Adams, 12,281 feet (3,743 m)
- Gilbert Peak, 8,184 feet (2,494 m)
- Mount Aix, 7,766 feet (2,367 m)
- Tieton Peak, 7,724 feet (2,354 m)
- Cascade Mountains
- Rattlesnake Hills
- Horse Heaven Hills
National protected areas
Major roads
Adjacent counties
- Pierce County - northwest
- Lewis County - west
- Skamania County - southwest
- Kittitas County - north
- Klickitat County - south
- Grant County - northeast
- Benton County - east
Demographics
| Historical population | |||
|---|---|---|---|
| Census | Pop. | %± | |
| 1870 | 432 | — | |
| 1880 | 2,811 | 550.7% | |
| 1890 | 4,429 | 57.6% | |
| 1900 | 13,462 | 204.0% | |
| 1910 | 41,709 | 209.8% | |
| 1920 | 63,710 | 52.7% | |
| 1930 | 77,402 | 21.5% | |
| 1940 | 99,019 | 27.9% | |
| 1950 | 135,723 | 37.1% | |
| 1960 | 145,112 | 6.9% | |
| 1970 | 144,971 | −0.1% | |
| 1980 | 172,508 | 19.0% | |
| 1990 | 188,823 | 9.5% | |
| 2000 | 222,581 | 17.9% | |
| 2010 | 243,231 | 9.3% | |
| 2019 (est.) | 250,873 | [7] | 3.1% |
| U.S. Decennial Census[8] 1790–1960[9] 1900–1990[10] 1990–2000[11] 2010–2019[1] | |||
2000 census
As of the census[12] of 2000, there were 222,581 people, 73,993 households, and 54,606 families living in the county. The population density was 52 people per square mile (20/km2). There were 79,174 housing units at an average density of 18 per square mile (7/km2). The racial makeup of the county was 65.60% White, 0.97% Black or African American, 4.48% Native American, 0.95% Asian, 0.09% Pacific Islander, 24.43% from other races, and 3.48% from two or more races. 35.90% of the population were Hispanic or Latino of any race. 13.2% were of German, 6.4% United States or American, 5.9% English and 5.4% Irish ancestry.
There were 73,993 households, out of which 39.7% had children under the age of 18 living with them, 55.8% were married couples living together, 12.5% had a female householder with no husband present, and 26.2% were non-families. 21.5% of all households were made up of individuals, and 9.6% had someone living alone who was 65 years of age or older. The average household size was 2.96 and the average family size was 3.44.
In the county, the population was spread out, with 31.8% under the age of 18, 9.8% from 18 to 24, 27.5% from 25 to 44, 19.7% from 45 to 64, and 11.2% who were 65 years of age or older. The median age was 31 years. For every 100 females there were 99.6 males. For every 100 females age 18 and over, there were 97.1 males.
The median income for a household in the county was $34,828, and the median income for a family was $39,746. Males had a median income of $31,620 versus $24,541 for females. The per capita income for the county was $15,606. About 14.8% of families and 19.7% of the population were below the poverty line, including 27.2% of those under age 18 and 11.3% of those age 65 or over.
2010 census
As of the 2010 United States Census, there were 243,231 people, 80,592 households, and 58,790 families living in the county.[13] The population density was 56.6 inhabitants per square mile (21.9/km2). There were 85,474 housing units at an average density of 19.9 per square mile (7.7/km2).[14] The racial makeup of the county was 63.7% white, 4.3% American Indian, 1.1% Asian, 1.0% black or African American, 0.1% Pacific islander, 26.1% from other races, and 3.7% from two or more races. Those of Hispanic or Latino origin made up 45.0% of the population.[13] In terms of ancestry, 15.8% were German, 8.0% were English, 7.3% were Irish, and 3.6% were American.[15]
Of the 80,592 households, 42.1% had children under the age of 18 living with them, 51.4% were married couples living together, 14.7% had a female householder with no husband present, 27.1% were non-families, and 21.6% of all households were made up of individuals. The average household size was 2.97 and the average family size was 3.46. The median age was 32.2 years.[13]
The median income for a household in the county was $42,877 and the median income for a family was $48,004. Males had a median income of $37,029 versus $29,824 for females. The per capita income for the county was $19,325. About 16.8% of families and 21.8% of the population were below the poverty line, including 31.9% of those under age 18 and 11.9% of those age 65 or over.[16]
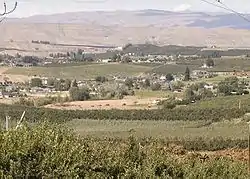
Wine regions
Washington ranks second in the United States in the production of wine, behind only California.[17] The Yakima Valley AVA was established in 1983 in the state's oldest agricultural region. It is Washington's third largest officially designated American Viticultural Area (AVA), and is responsible for more than 40% of the state's wine production.
Located within the larger Columbia Valley AVA, the Yakima Valley AVA is sub-divided into the three smaller wine regions, each with distinctive growing conditions. They are Red Mountain AVA, Snipes Mountain AVA, and Rattlesnake Hills AVA.[18] Of the viticultural region's 665,000 acres (269,000 ha), nearly 11,120 acres (4,500 ha) were planted in 2008.[17]
Communities
Cities
Census-designated places
Unincorporated communities
- Artesian
- Ashue
- Belma
- Birchfield
- Blackrock
- Brownstown
- Byron
- Cliffdell
- East Selah
- Emerald
- Empire
- Farron
- Flint
- Fort Simcoe
- Fruitvale
- Givens Corner
- Goose Prairie
- Gromore
- Harwood
- Holtzinger
- Jonathan
- Liberty
- Lichty
- Midvale
- Nass
- Nile
- Pinecliff
- Plainview
- Pomona
- Rimrock
- Sawyer
- Spitzenberg
- Venner
- Waneta
- Weikel
- Wenas
- Wiley City
- Yethonat
Politics
Yakima County is strongly Republican in statewide elections. On only four occasions has it backed a Democrat for President – it has voted for the same candidate as the state of South Dakota in every election since they first voted for President – and the last Democratic gubernatorial candidate it backed was Albert D. Rosellini in 1956.[19]
Only Adams County and Columbia County, which last backed a Democrat for governor in 1936 when Clarence D. Martin swept every county in the state, have consistently backed Republicans for governor for longer.[19] Although Yakima County did narrowly support Maria Cantwell in 2012, the previous statewide candidate to carry Yakima County for the Democrats was popular Senator "Scoop" Jackson in 1982.[20]
In 2020, Biden came within 10 percent of winning the county.
| Year | Republican | Democratic | Third parties |
|---|---|---|---|
| 2020 | 52.6% 50,555 | 44.9% 43,179 | 2.5% 2,459 |
| 2016 | 52.3% 41,735 | 39.2% 31,291 | 8.4% 6,715 |
| 2012 | 54.5% 42,239 | 42.9% 33,217 | 2.6% 2,050 |
| 2008 | 54.1% 41,946 | 43.6% 33,792 | 2.3% 1,796 |
| 2004 | 59.6% 43,352 | 39.1% 28,474 | 1.3% 964 |
| 2000 | 58.6% 39,494 | 37.9% 25,546 | 3.5% 2,342 |
| 1996 | 46.6% 27,668 | 43.3% 25,676 | 10.1% 6,016 |
| 1992 | 44.6% 25,841 | 36.3% 21,026 | 19.2% 11,102 |
| 1988 | 55.7% 30,026 | 43.1% 23,221 | 1.2% 663 |
| 1984 | 61.5% 40,678 | 37.4% 24,724 | 1.2% 780 |
| 1980 | 55.2% 33,815 | 35.7% 21,873 | 9.1% 5,565 |
| 1976 | 53.1% 29,478 | 43.7% 24,223 | 3.2% 1,791 |
| 1972 | 58.9% 32,240 | 36.1% 19,729 | 5.0% 2,736 |
| 1968 | 53.7% 27,488 | 38.1% 19,499 | 8.2% 4,211 |
| 1964 | 43.2% 22,786 | 56.1% 29,604 | 0.6% 340 |
| 1960 | 58.7% 31,683 | 40.7% 21,958 | 0.7% 354 |
| 1956 | 60.2% 31,984 | 39.5% 20,991 | 0.3% 149 |
| 1952 | 64.1% 32,317 | 35.0% 17,647 | 1.0% 483 |
| 1948 | 51.0% 21,396 | 47.1% 19,760 | 1.9% 801 |
| 1944 | 56.8% 20,864 | 42.6% 15,643 | 0.7% 249 |
| 1940 | 52.6% 20,398 | 46.7% 18,092 | 0.7% 270 |
| 1936 | 39.7% 12,555 | 54.3% 17,200 | 6.0% 1,902 |
| 1932 | 41.5% 11,151 | 51.7% 13,880 | 6.8% 1,815 |
| 1928 | 73.1% 16,694 | 26.3% 6,008 | 0.6% 146 |
| 1924 | 63.7% 12,124 | 11.3% 2,157 | 25.0% 4,747 |
| 1920 | 59.4% 11,571 | 20.9% 4,062 | 19.8% 3,851 |
| 1916 | 49.1% 7,188 | 41.9% 6,136 | 9.0% 1,316 |
| 1912 | 25.2% 3,304 | 24.5% 3,209 | 50.3% 6,592 |
| 1908 | 63.9% 3,998 | 26.4% 1,650 | 9.8% 613 |
| 1904 | 70.4% 3,484 | 18.8% 929 | 10.9% 539 |
| 1900 | 55.9% 1,507 | 39.5% 1,066 | 4.6% 123 |
| 1896 | 42.6% 948 | 56.9% 1,266 | 0.6% 13 |
| 1892 | 41.5% 625 | 33.1% 498 | 25.5% 384 |
Footnotes
- "State & County QuickFacts". United States Census Bureau. Retrieved January 8, 2014.
- "Find a County". National Association of Counties. Retrieved June 7, 2011.
- "Milestones for Washington State History — Part 2: 1851 to 1900". HistoryLink.org. March 6, 2003.
- HistoryLink.org: Yakima County – Thumbnail History
- "2010 Census Gazetteer Files". United States Census Bureau. August 22, 2012. Retrieved July 16, 2015.
- List of U.S. states and territories by area
- "Population and Housing Unit Estimates". Retrieved April 11, 2020.
- "U.S. Decennial Census". United States Census Bureau. Retrieved January 8, 2014.
- "Historical Census Browser". University of Virginia Library. Retrieved January 8, 2014.
- "Population of Counties by Decennial Census: 1900 to 1990". United States Census Bureau. Retrieved January 8, 2014.
- "Census 2000 PHC-T-4. Ranking Tables for Counties: 1990 and 2000" (PDF). United States Census Bureau. Retrieved January 8, 2014.
- "U.S. Census website". United States Census Bureau. Retrieved May 14, 2011.
- "Profile of General Population and Housing Characteristics: 2010 Demographic Profile Data". United States Census Bureau. Archived from the original on February 13, 2020. Retrieved March 6, 2016.
- "Population, Housing Units, Area, and Density: 2010 - County". United States Census Bureau. Archived from the original on February 13, 2020. Retrieved March 6, 2016.
- "Selected Social Characteristics in the United States – 2006-2010 American Community Survey 5-Year Estimates". United States Census Bureau. Archived from the original on February 13, 2020. Retrieved March 6, 2016.
- "Selected Economic Characteristics – 2006-2010 American Community Survey 5-Year Estimates". United States Census Bureau. Archived from the original on February 13, 2020. Retrieved March 6, 2016.
- A. Domine (ed) Wine pp. 798-800 Ullmann Publishing 2008 ISBN 978-3-8331-4611-4
- J. Robinson (ed) "The Oxford Companion to Wine" Third Ed. pp. 761-762 Oxford University Press 2006 ISBN 0-19-860990-6
- David Leip. "Gubernatorial General Election Map Comparison - Washington". Dave Leip's U.S. Election Atlas.
- David Leip. "Senatorial General Election Map Comparison – Washington". Dave Leip's U.S. Election Atlas.
- Leip, David. "Dave Leip's Atlas of U.S. Presidential Elections". uselectionatlas.org. Retrieved April 10, 2018.
Further reading
External links
| Wikimedia Commons has media related to Yakima County. |
Places adjacent to Yakima County, Washington | ||||||||||
|---|---|---|---|---|---|---|---|---|---|---|
| ||||||||||
Municipalities and communities of Yakima County, Washington, United States | ||
|---|---|---|
| Cities | Map of Washington highlighting Yakima County | |
| Towns | ||
| CDPs | ||
| Other unincorporated communities | ||
| Indian reservation | ||
| Footnotes | ‡This populated place also has portions in an adjacent county or counties | |
| ||

| Authority control |
|---|