Pacific County, Washington
Pacific County is a county in the U.S. state of Washington. As of the 2010 census, the population was 20,920.[1] Its county seat is South Bend,[2] and its largest city is Raymond. The county was formed by the government of Oregon Territory in February 1851[3] and is named for the Pacific Ocean.
Pacific County | |
|---|---|
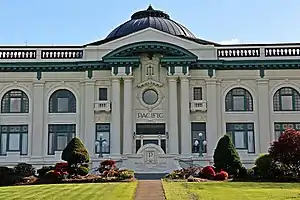 Pacific County Courthouse, South Bend | |
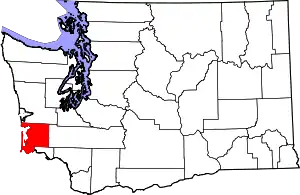 Location within the U.S. state of Washington | |
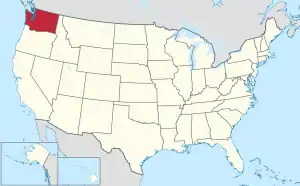 Washington's location within the U.S. | |
| Coordinates: 46°34′N 123°47′W | |
| Country | |
| State | |
| Founded | February 4, 1851 |
| Named for | Pacific Ocean |
| Seat | South Bend |
| Largest city | Raymond |
| Area | |
| • Total | 1,223 sq mi (3,170 km2) |
| • Land | 933 sq mi (2,420 km2) |
| • Water | 291 sq mi (750 km2) 24%% |
| Population (2010) | |
| • Total | 20,920 |
| • Estimate (2019) | 22,471 |
| • Density | 22/sq mi (8/km2) |
| Time zone | UTC−8 (Pacific) |
| • Summer (DST) | UTC−7 (PDT) |
| Congressional district | 3rd |
| Website | www |
Pacific County is centered on Willapa Bay, a region that provides twenty-five percent of the United States oyster harvest,[4] although forestry, fishing, and tourism are also significant elements of the county's economy.
History
The area that is now Pacific County was part of Oregon Territory in the first part of the nineteenth century. On December 19, 1845, the Provisional Government of Oregon created two counties (Vancouver and Clark) in its northern portion (which is now the state of Washington). In 1849, the name of Vancouver County was changed to Lewis County, and on February 4, 1851, a portion of Lewis County was partitioned off to become Pacific County. The county's boundaries have not changed since its creation. The unincorporated community of Oysterville, established in 1852, was the first county seat. The county seat was moved to South Bend in 1893.
Geography
According to the U.S. Census Bureau, the county has an area of 1,223 square miles (3,170 km2), of which 933 square miles (2,420 km2) is land and 291 square miles (750 km2) (24%) is water.[5]
Geographic features
Major highways
Adjacent counties
- Grays Harbor County – north
- Lewis County – east
- Wahkiakum County – southeast
- Clatsop County, Oregon – south
National protected areas
Demographics
| Historical population | |||
|---|---|---|---|
| Census | Pop. | %± | |
| 1860 | 420 | — | |
| 1870 | 738 | 75.7% | |
| 1880 | 1,645 | 122.9% | |
| 1890 | 4,358 | 164.9% | |
| 1900 | 5,983 | 37.3% | |
| 1910 | 12,532 | 109.5% | |
| 1920 | 14,891 | 18.8% | |
| 1930 | 14,970 | 0.5% | |
| 1940 | 15,928 | 6.4% | |
| 1950 | 16,558 | 4.0% | |
| 1960 | 14,674 | −11.4% | |
| 1970 | 15,796 | 7.6% | |
| 1980 | 17,237 | 9.1% | |
| 1990 | 18,882 | 9.5% | |
| 2000 | 20,984 | 11.1% | |
| 2010 | 20,920 | −0.3% | |
| 2019 (est.) | 22,471 | [6] | 7.4% |
| U.S. Decennial Census[7] 1790–1960[8] 1900–1990[9] 1990–2000[10] 2010–2019[1] | |||
2000 census
As of the census[11] of 2000, there were 20,984 people, 9,096 households, and 5,885 families living in the county. The population density was 22 people per square mile (9/km2). There were 13,991 housing units at an average density of 15 per square mile (6/km2). The racial makeup of the county was 90.54% White, 0.20% Black or African American, 2.44% Native American, 2.08% Asian, 0.09% Pacific Islander, 1.83% from other races, and 2.82% from two or more races. 5.01% of the population were Hispanic or Latino of any race. 18.0% were of German, 10.8% English, 8.8% Irish and 8.6% United States or American ancestry.
There were 9,096 households, out of which 23.10% had children under the age of 18 living with them, 53.10% were married couples living together, 7.90% had a female householder with no husband present, and 35.30% were non-families. 29.50% of all households were made up of individuals, and 14.30% had someone living alone who was 65 years of age or older. The average household size was 2.27 and the average family size was 2.77.
In the county, the population was spread out, with 21.40% under the age of 18, 6.00% from 18 to 24, 21.20% from 25 to 44, 28.90% from 45 to 64, and 22.60% who were 65 years of age or older. The median age was 46 years. For every 100 females there were 98.30 males. For every 100 females age 18 and over, there were 95.80 males.
The median income for a household in the county was $31,209, and the median income for a family was $39,302. Males had a median income of $33,892 versus $22,982 for females. The per capita income for the county was $17,322. About 9.10% of families and 14.40% of the population were below the poverty line, including 19.70% of those under age 18 and 8.10% of those age 65 or over.
2010 census
As of the 2010 United States Census, there were 20,920 people, 9,499 households, and 5,707 families living in the county.[12] The population density was 22.4 inhabitants per square mile (8.6/km2). There were 15,547 housing units at an average density of 16.7 per square mile (6.4/km2).[13] The racial makeup of the county was 87.4% white, 2.3% American Indian, 2.0% Asian, 0.4% black or African American, 0.1% Pacific islander, 4.4% from other races, and 3.4% from two or more races. Those of Hispanic or Latino origin made up 8.0% of the population.[12] In terms of ancestry, 23.4% were German, 13.8% were English, 11.9% were Irish, 7.6% were American, 6.2% were Norwegian, and 5.8% were Swedish.[14]
Of the 9,499 households, 20.7% had children under the age of 18 living with them, 47.6% were married couples living together, 8.1% had a female householder with no husband present, 39.9% were non-families, and 33.0% of all households were made up of individuals. The average household size was 2.17 and the average family size was 2.72. The median age was 50.8 years.[12]
The median income for a household in the county was $39,642 and the median income for a family was $51,450. Males had a median income of $44,775 versus $34,538 for females. The per capita income for the county was $23,326. About 12.4% of families and 16.8% of the population were below the poverty line, including 20.4% of those under age 18 and 9.9% of those age 65 or over.[15]
Politics
Pacific County, along with neighboring Grays Harbor County, has been one of the most consistently Democratic counties in the nation. In 2016, however, the county, like Grays Harbor County, broke its long streak of backing the Democratic candidate for president, voting for Republican Donald Trump over Democrat Hillary Clinton.
| Year | Republican | Democratic | Third parties |
|---|---|---|---|
| 2020 | 49.4% 6,953 | 48.3% 6,794 | 2.3% 317 |
| 2016 | 48.9% 5,360 | 42.1% 4,620 | 9.0% 992 |
| 2012 | 42.3% 4,499 | 53.7% 5,711 | 4.0% 426 |
| 2008 | 41.2% 4,555 | 55.1% 6,094 | 3.7% 406 |
| 2004 | 44.4% 4,634 | 53.4% 5,570 | 2.2% 227 |
| 2000 | 42.5% 4,042 | 51.4% 4,895 | 6.1% 582 |
| 1996 | 28.5% 2,598 | 55.9% 5,095 | 15.6% 1,418 |
| 1992 | 24.2% 2,243 | 49.6% 4,587 | 26.2% 2,422 |
| 1988 | 37.5% 3,073 | 61.2% 5,017 | 1.3% 110 |
| 1984 | 42.9% 3,613 | 55.6% 4,679 | 1.5% 129 |
| 1980 | 39.1% 3,132 | 46.5% 3,727 | 14.4% 1,153 |
| 1976 | 37.8% 2,781 | 58.2% 4,278 | 4.0% 291 |
| 1972 | 46.7% 3,349 | 50.0% 3,585 | 3.2% 232 |
| 1968 | 37.7% 2,491 | 56.6% 3,740 | 5.7% 374 |
| 1964 | 26.1% 1,789 | 73.7% 5,056 | 0.2% 15 |
| 1960 | 45.5% 3,224 | 54.1% 3,837 | 0.4% 29 |
| 1956 | 49.8% 3,799 | 50.1% 3,824 | 0.2% 12 |
| 1952 | 50.2% 3,846 | 49.3% 3,778 | 0.5% 39 |
| 1948 | 39.0% 2,749 | 55.3% 3,902 | 5.7% 401 |
| 1944 | 39.2% 2,419 | 60.6% 3,745 | 0.2% 12 |
| 1940 | 37.8% 2,704 | 61.5% 4,393 | 0.7% 48 |
| 1936 | 26.9% 1,732 | 68.2% 4,395 | 5.0% 320 |
| 1932 | 31.1% 1,737 | 55.5% 3,099 | 13.5% 752 |
| 1928 | 67.4% 3,247 | 31.6% 1,523 | 1.0% 47 |
| 1924 | 64.6% 2,672 | 12.1% 501 | 23.3% 965 |
| 1920 | 65.6% 2,607 | 22.0% 874 | 12.5% 495 |
| 1916 | 59.5% 2,688 | 34.0% 1,537 | 6.5% 293 |
| 1912 | 33.8% 1,375 | 23.9% 971 | 42.4% 1,726[17] |
| 1908 | 69.3% 1,492 | 22.4% 483 | 8.3% 178 |
| 1904 | 77.0% 1,354 | 14.7% 258 | 8.4% 147 |
| 1900 | 66.7% 887 | 29.6% 393 | 3.7% 49 |
| 1896 | 61.2% 925 | 37.2% 562 | 1.6% 24 |
| 1892 | 52.6% 759 | 38.7% 559 | 8.7% 125 |
Communities
Cities
- Ilwaco
- Long Beach
- Raymond
- South Bend (county seat)
Census-designated places
Unincorporated communities
- Dexter by the Sea
- Firdale
- Frances
- Holcomb
- Menlo
- Megler
- Nemah
- North Cove
- Oceanside
- Old Willapa
- Oysterville
- Seaview
- Surfside
See also
References
- "State & County QuickFacts". United States Census Bureau. Archived from the original on June 23, 2011. Retrieved January 7, 2014.
- "Find a County". National Association of Counties. Retrieved June 7, 2011.
- "Milestones for Washington State History — Part 2: 1851 to 1900". HistoryLink.org. March 6, 2003.
- Chinook Observer, The Willapa Bay Oyster Industry: Shellfish is still No. 1
- "2010 Census Gazetteer Files". United States Census Bureau. August 22, 2012. Retrieved July 7, 2015.
- "Population and Housing Unit Estimates". Retrieved April 12, 2020.
- "U.S. Decennial Census". United States Census Bureau. Retrieved January 7, 2014.
- "Historical Census Browser". University of Virginia Library. Retrieved January 7, 2014.
- "Population of Counties by Decennial Census: 1900 to 1990". United States Census Bureau. Retrieved January 7, 2014.
- "Census 2000 PHC-T-4. Ranking Tables for Counties: 1990 and 2000" (PDF). United States Census Bureau. Retrieved January 7, 2014.
- "U.S. Census website". United States Census Bureau. Retrieved May 14, 2011.
- "Profile of General Population and Housing Characteristics: 2010 Demographic Profile Data". United States Census Bureau. Archived from the original on February 13, 2020. Retrieved March 6, 2016.
- "Population, Housing Units, Area, and Density: 2010 – County". United States Census Bureau. Archived from the original on February 13, 2020. Retrieved March 6, 2016.
- "Selected Social Characteristics in the United States – 2006–2010 American Community Survey 5-Year Estimates". United States Census Bureau. Archived from the original on February 13, 2020. Retrieved March 6, 2016.
- "Selected Economic Characteristics – 2006–2010 American Community Survey 5-Year Estimates". United States Census Bureau. Archived from the original on February 13, 2020. Retrieved March 6, 2016.
- Leip, David. "Dave Leip's Atlas of U.S. Presidential Elections". uselectionatlas.org. Retrieved April 10, 2018.
- The leading "other" candidate, Progressive Theodore Roosevelt, received 1,251 votes, while Socialist candidate Eugene Debs received 382 votes, Prohibition candidate Eugene Chafin received 82 votes, and Socialist Labor candidate Arthur Reimer received 11 votes.
External links
![]() Media related to Pacific County, Washington at Wikimedia Commons
Media related to Pacific County, Washington at Wikimedia Commons
Places adjacent to Pacific County, Washington | ||||||||||
|---|---|---|---|---|---|---|---|---|---|---|
| ||||||||||
Municipalities and communities of Pacific County, Washington, United States | ||
|---|---|---|
| Cities | Map of Washington highlighting Pacific County | |
| CDPs | ||
| Other unincorporated communities | ||
| Ghost towns | ||
| Indian reservation | ||
| ||
| Authority control |
|---|