Grays Harbor County, Washington
Grays Harbor County is a county in the U.S. state of Washington. As of the 2010 census, the population was 72,797.[1] The county seat is Montesano, and its largest city is Aberdeen.[2] Grays Harbor County is included in the Aberdeen Micropolitan Statistical Area.
Grays Harbor County | |
|---|---|
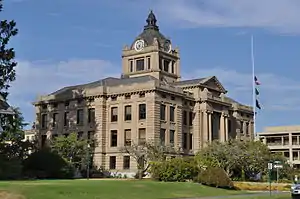 Grays Harbor County Courthouse | |
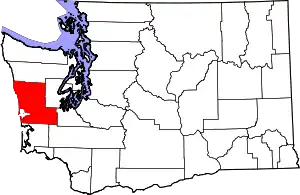 Location within the U.S. state of Washington | |
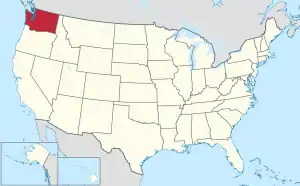 Washington's location within the U.S. | |
| Coordinates: 47°09′N 123°50′W | |
| Country | |
| State | |
| Founded | April 14, 1854 |
| Named for | Grays Harbor |
| Seat | Montesano |
| Largest city | Aberdeen |
| Area | |
| • Total | 2,224 sq mi (5,760 km2) |
| • Land | 1,902 sq mi (4,930 km2) |
| • Water | 322 sq mi (830 km2) 14%% |
| Population (2020) | |
| • Total | 72,553 |
| • Estimate (2020) | 75,061 |
| • Density | 38.3/sq mi (14.8/km2) |
| Time zone | UTC−8 (Pacific) |
| • Summer (DST) | UTC−7 (PDT) |
| Congressional district | 6th |
| Website | www |
History
The county is presently named after a large estuarine bay near its southwestern corner. On May 7, 1792, Boston fur trader Robert Gray crossed the bar into a bay which he called Bullfinch Harbor, but which later cartographers would label Chehalis Bay, and then Grays Harbor.[3]
The area that now comprises Grays Harbor County was part of Oregon Territory in the first part of the nineteenth century. On December 19, 1845, the Provisional Government of Oregon created two counties (Vancouver and Clark) in its northern portion (which is now the state of Washington). In 1849, the name of Vancouver County was changed to Lewis County, and on April 14, 1854, a portion of Lewis County was partitioned off to become Chehalis County.[4] This county's boundaries have not changed since its creation, but on June 9, 1915,[5] its name was changed to Grays Harbor County to eliminate confusion with the town of Chehalis in Lewis County.[6]
Geography
According to the U.S. Census Bureau, the county has a total area of 2,224 square miles (5,760 km2), of which 1,902 square miles (4,930 km2) is land and 322 square miles (830 km2) (14%) is water.[7]
Geographic features
|
|
State parks
Major highways
Adjacent counties
- Jefferson County – north
- Mason County – northeast
- Thurston County – east/southeast
- Lewis County – south/southeast
- Pacific County – south
Demographics
| Historical population | |||
|---|---|---|---|
| Census | Pop. | %± | |
| 1860 | 285 | — | |
| 1870 | 401 | 40.7% | |
| 1880 | 921 | 129.7% | |
| 1890 | 9,249 | 904.2% | |
| 1900 | 15,124 | 63.5% | |
| 1910 | 35,590 | 135.3% | |
| 1920 | 44,745 | 25.7% | |
| 1930 | 59,982 | 34.1% | |
| 1940 | 53,166 | −11.4% | |
| 1950 | 53,644 | 0.9% | |
| 1960 | 54,465 | 1.5% | |
| 1970 | 59,553 | 9.3% | |
| 1980 | 66,314 | 11.4% | |
| 1990 | 64,175 | −3.2% | |
| 2000 | 67,194 | 4.7% | |
| 2010 | 72,797 | 8.3% | |
| 2019 (est.) | 75,061 | [8] | 3.1% |
| U.S. Decennial Census[9] 1790–1960[10] 1900–1990[11] 1990–2000[12] 2010–2019[1] | |||
2000 census
As of the census[13] of 2000, there were 67,194 people, 26,808 households, and 17,907 families living in the county. The population density was 35 people per square mile (14/km2). There were 32,489 housing units at an average density of 17 per square mile (7/km2). The racial makeup of the county was 88.30% White, 0.34% Black or African American, 4.66% Native American, 1.22% Asian, 0.11% Pacific Islander, 2.27% from other races, and 3.10% from two or more races. 4.85% of the population were Hispanic or Latino of any race. 16.3% were of German, 11.9% United States or American, 9.9% English, 9.2% Irish, and 6.1% Norwegian ancestry. 94.1% spoke English and 3.9% Spanish as their first language.
There were 26,808 households, out of which 30.50% had children under the age of 18 living with them, 50.70% were married couples living together, 11.10% had a female householder with no husband present, and 33.20% were non-families. 26.70% of all households were made up of individuals, and 11.60% had someone living alone who was 65 years of age or older. The average household size was 2.48 and the average family size was 2.98.
In the county, the population was spread out, with 25.70% under the age of 18, 7.90% from 18 to 24, 26.00% from 25 to 44, 25.00% from 45 to 64, and 15.40% who were 65 years of age or older. The median age was 39 years. For every 100 females there were 98.80 males. For every 100 females age 18 and over, there were 96.20 males.
The median income for a household in the county was $34,160, and the median income for a family was $39,709. Males had a median income of $35,947 versus $24,262 for females. The per capita income for the county was $16,799. 16.10% of the population and 11.90% of families were below the poverty line, including 21.60% of those under the age of 18 and 40% of those 65 and older.
2010 census
As of the 2010 Census, there were 72,797 people, 28,579 households, and 18,493 families living in the county.[14] The population density was 38.3 inhabitants per square mile (14.8/km2). There were 35,166 housing units at an average density of 18.5 per square mile (7.1/km2).[15] The racial makeup of the county was 84.9% white, 4.6% American Indian, 1.4% Asian, 1.1% black or African American, 0.3% Pacific islander, 3.9% from other races, and 3.9% from two or more races. Those of Hispanic or Latino origin made up 8.6% of the population.[14] In terms of ancestry, 21.0% were German, 13.5% were Irish, 11.7% were English, 6.8% were Norwegian, and 4.2% were American.[16]
Of the 28,579 households, 28.8% had children under the age of 18 living with them, 46.8% were married couples living together, 11.9% had a female householder with no husband present, 35.3% were non-families, and 27.6% of all households were made up of individuals. The average household size was 2.45 and the average family size was 2.94. The median age was 41.9 years.[14]
The median income for a household in the county was $41,899 and the median income for a family was $49,745. Males had a median income of $42,998 versus $34,183 for females. The per capita income for the county was $21,656. About 11.7% of families and 16.1% of the population were below the poverty line, including 23.1% of those under age 18 and 7.9% of those age 65 or over.[17]
Politics
Grays Harbor County used to be one of the most consistently Democratic in the nation. Until 2016, the last Republican presidential candidate to carry the county was Herbert Hoover in 1928[18] and the last Republican gubernatorial candidate to carry the county (until 2016) was Daniel J. Evans in 1964.[19] However, Donald Trump carried the county in the 2016 presidential election.
In the United States House of Representatives Grays Harbor is part of Washington's 6th congressional district, which has a Cook Partisan Voting Index of D+5 and is represented by Derek Kilmer. In the Washington State Legislature it lies in the 19th and 24th districts. In the Washington State Senate it is represented by Dean Takko, and Kevin Van De Wege. In the Washington House of Representatives it is represented by Brian Blake, Mike Chapman, Steve Tharinger, and Jim Walsh. All these politicians represent the Democratic Party, except Jim Walsh who is a member of the Republican Party.[20]
| Year | Republican | Democratic | Third parties |
|---|---|---|---|
| 2020 | 51.7% 19,877 | 45.1% 17,354 | 3.2% 1,210 |
| 2016 | 48.0% 14,067 | 41.0% 12,020 | 11.0% 3,214 |
| 2012 | 41.2% 11,914 | 55.1% 15,960 | 3.7% 1,073 |
| 2008 | 41.5% 12,104 | 56.0% 16,354 | 2.5% 726 |
| 2004 | 46.1% 12,871 | 52.2% 14,583 | 1.8% 499 |
| 2000 | 43.2% 11,225 | 51.2% 13,304 | 5.6% 1,443 |
| 1996 | 29.1% 7,635 | 53.7% 14,082 | 17.3% 4,533 |
| 1992 | 25.4% 6,904 | 46.3% 12,599 | 28.4% 7,735 |
| 1988 | 37.9% 8,860 | 60.3% 14,097 | 1.9% 434 |
| 1984 | 44.0% 11,286 | 54.7% 14,050 | 1.3% 335 |
| 1980 | 40.2% 10,226 | 44.4% 11,290 | 15.4% 3,928 |
| 1976 | 39.6% 9,464 | 56.4% 13,478 | 4.0% 951 |
| 1972 | 45.7% 10,839 | 49.6% 11,786 | 4.7% 1,120 |
| 1968 | 34.0% 7,720 | 59.4% 13,480 | 6.6% 1,484 |
| 1964 | 24.9% 5,744 | 74.5% 17,145 | 0.6% 138 |
| 1960 | 41.9% 10,067 | 57.4% 13,773 | 0.7% 166 |
| 1956 | 47.3% 11,599 | 52.5% 12,858 | 0.2% 57 |
| 1952 | 49.3% 12,168 | 49.9% 12,317 | 0.8% 198 |
| 1948 | 36.0% 8,357 | 58.8% 13,660 | 5.2% 1,198 |
| 1944 | 36.0% 7,834 | 63.4% 13,803 | 0.6% 130 |
| 1940 | 35.6% 8,369 | 63.3% 14,861 | 1.1% 257 |
| 1936 | 23.4% 5,053 | 73.3% 15,851 | 3.3% 718 |
| 1932 | 27.9% 5,141 | 55.9% 10,310 | 16.2% 2,985 |
| 1928 | 66.3% 10,798 | 32.3% 5,258 | 1.4% 230 |
| 1924 | 60.2% 8,273 | 9.0% 1,239 | 30.8% 4,239 |
| 1920 | 50.9% 5,920 | 29.1% 3,378 | 20.0% 2,324 |
| 1916 | 44.3% 5,024 | 44.0% 4,992 | 11.6% 1,320 |
| 1912 | 34.7% 3,055 | 22.2% 1,953 | 43.2% 3,806[22] |
| 1908 | 60.4% 3,128 | 24.1% 1,248 | 15.6% 807 |
| 1904 | 68.1% 2,589 | 16.4% 624 | 15.5% 587 |
| 1900 | 58.8% 1,850 | 34.3% 1,081 | 6.9% 217 |
| 1896 | 48.0% 1,267 | 51.1% 1,350 | 0.9% 24 |
| 1892 | 42.0% 990 | 33.9% 798 | 24.1% 568 |
Economy
The principal economic activities are
- Wood and Paper Products
- Seafood Processing
- Food Processing
- Manufacturing
Communities
Cities
- Aberdeen
- Cosmopolis
- Elma
- Hoquiam
- McCleary
- Montesano (county seat)
- Oakville
- Ocean Shores
- Westport
Census-designated places
Notable people
- Robert Arthur, actor
- Elton Bennett, artist
- Gail Brown, actress
- Trisha Brown, choreographer
- Mark Bruener, NFL player
- Daniel Bryan, professional wrestler
- Robert Eugene Bush, Medal of Honor recipient
- Kurt Cobain, musician
- Colin Cowherd, ESPN Radio host (The Herd with Colin Cowherd)
- Dale Crover, musician
- Reuben H. Fleet, aviation pioneer
- Clarence Chesterfield Howerton, circus performer
- Jerry Lambert, actor
- Robert Motherwell, artist
- Peter Norton, software developer (Norton Utilities)
- Krist Novoselic, musician
- Buzz Osborne, musician
- Douglas Osheroff, Nobel-winning physicist
- Patrick Simmons, musician
- Kurdt Vanderhoof, musician
See also
Further reading
- Grays Harbor Development Club (1912). Grays Harbor Country Washington. Oregon-Washington Railroad & Navigation Co. p. 32. From the book "thirty years ago ... Destructive Development began ... greed for wealth ... denuded acres ... logged-off land ... found to be fertile ... capable of the highest state of cultivation ... fishing profit ... splendid landlocked body of water ... fir ... perfect lumber ... lumber and shingle mills ... Clams, crabs and shrimp ... abundant ... an agreeable climate ... dairy industry ... unbounded ... few soils are superior to those here ... unlimited opportunity ... berry orchards ... poultry leading place ...
- Weinstein, Robert A. (1978). Grays Harbor, 1885-1913. Viking. p. 190.
References
- "State & County QuickFacts". United States Census Bureau. Retrieved January 7, 2014.
- "Find a County". National Association of Counties. Archived from the original on May 31, 2011. Retrieved June 7, 2011.
- "Grays Harbor County – Thumbnail History". Historylink.org. Retrieved February 14, 2015.
- "Statutes of the Territory of Washington, 1854, p. 472 An Act to Create the County of Chehalis" (PDF).
- "Statutes of Washington, 1915, Explanatory" (PDF).
- "Statutes of Washington, 1915, chapter 77, SB 297" (PDF).
- "2010 Census Gazetteer Files". United States Census Bureau. August 22, 2012. Retrieved July 5, 2015.
- "Population and Housing Unit Estimates". Retrieved April 11, 2020.
- "U.S. Decennial Census". United States Census Bureau. Retrieved January 7, 2014.
- "Historical Census Browser". University of Virginia Library. Retrieved January 7, 2014.
- "Population of Counties by Decennial Census: 1900 to 1990". United States Census Bureau. Retrieved January 7, 2014.
- "Census 2000 PHC-T-4. Ranking Tables for Counties: 1990 and 2000" (PDF). United States Census Bureau. Retrieved January 7, 2014.
- "U.S. Census website". United States Census Bureau. Retrieved May 14, 2011.
- "Profile of General Population and Housing Characteristics: 2010 Demographic Profile Data". United States Census Bureau. Archived from the original on February 13, 2020. Retrieved March 6, 2016.
- "Population, Housing Units, Area, and Density: 2010 – County". United States Census Bureau. Archived from the original on February 13, 2020. Retrieved March 6, 2016.
- "Selected Social Characteristics in the United States – 2006–2010 American Community Survey 5-Year Estimates". United States Census Bureau. Archived from the original on February 13, 2020. Retrieved March 6, 2016.
- "Selected Economic Characteristics – 2006–2010 American Community Survey 5-Year Estimates". United States Census Bureau. Archived from the original on February 13, 2020. Retrieved March 6, 2016.
- "Presidential election of 1928 – Map by counties".
- "David Leip's Election Atlas". uselectionatlas.org. Retrieved March 17, 2018.
- (PDF) http://leg.wa.gov/LIC/Documents/Maps/Statewide%20Legislative%20District%20Map.pdf. Missing or empty
|title=(help) - Leip, David. "Dave Leip's Atlas of U.S. Presidential Elections". uselectionatlas.org. Retrieved March 17, 2018.
- The leading "other" candidate, Progressive Theodore Roosevelt, received 1,847 votes, while Socialist candidate Eugene Debs received 1,683 votes, Prohibition candidate Eugene Chafin received 228 votes, and Socialist Labor candidate Arthur Reimer received 48 votes.
External links
- Official website
- Harborpedia
- Maritime Heritage Network, an online directory of maritime history resources in the Pacific Northwest, including the Grays Harbor cities of Aberdeen and Hoquiam.
Places adjacent to Grays Harbor County, Washington | ||||||||||
|---|---|---|---|---|---|---|---|---|---|---|
| ||||||||||
Municipalities and communities of Grays Harbor County, Washington, United States | ||
|---|---|---|
| Cities | Map of Washington highlighting Grays Harbor County | |
| CDPs | ||
| Other unincorporated communities | ||
| Indian reservations | ||
| Footnotes | ‡This populated place also has portions in an adjacent county or counties | |
| ||
| Authority control |
|---|