Clallam County, Washington
Clallam County is a county in the U.S. state of Washington. As of the 2010 census, the population was 71,404.[1] The county seat and largest city is Port Angeles; the county as a whole comprises the Port Angeles, WA Micropolitan Statistical Area.[2] The name is a Klallam word for "the strong people". The county was formed on April 26, 1854.[3] Located on the Olympic Peninsula, it is south from the Strait of Juan de Fuca, which forms the Canada–US border, as British Columbia's Vancouver Island is across the strait.
Clallam County | |
|---|---|
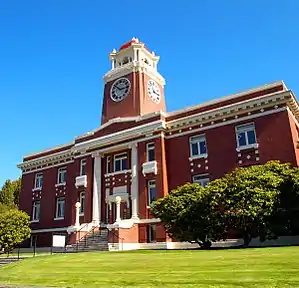 Clallam County Courthouse | |
 Seal | |
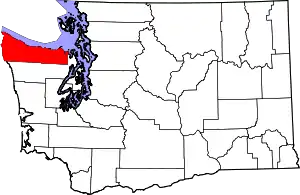 Location within the U.S. state of Washington | |
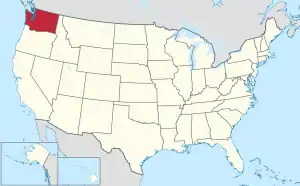 Washington's location within the U.S. | |
| Coordinates: 48°06′45″N 123°26′27″W | |
| Country | |
| State | |
| Founded | April 26, 1854 |
| Seat | Port Angeles |
| Largest city | Port Angeles |
| Area | |
| • Total | 2,671 sq mi (6,920 km2) |
| • Land | 1,738 sq mi (4,500 km2) |
| • Water | 932 sq mi (2,410 km2) 35%% |
| Population (2010) | |
| • Total | 71,404 |
| • Estimate (2019) | 77,331 |
| • Density | 42/sq mi (16/km2) |
| Time zone | UTC−8 (Pacific) |
| • Summer (DST) | UTC−7 (PDT) |
| Congressional district | 6th |
| Website | www |

The county is a significant bellwether region, holding the longest currently ongoing record for predicting presidential election winners in the entire country.[4] It has voted the winning candidate in every presidential election since 1980, and in every election for a century except for 1968 and 1976.[5]
Geography
According to the U.S. Census Bureau, the county has a total area of 2,671 square miles (6,920 km2), of which 1,738 square miles (4,500 km2) is land and 932 square miles (2,410 km2) (35%) is water.[6]
Located in Clallam County is Cape Alava, the westernmost point in both Washington and the contiguous United States, with a longitude of 124 degrees, 43 minutes and 59 seconds West (−124.733). Near Cape Alava is Ozette, the westernmost town in the contiguous United States.
Geographic features
Adjacent counties
- Cowichan Valley Regional District, British Columbia – northwest
- Capital Regional District, British Columbia – north
- Jefferson County – south, east
National protected areas
Demographics
| Historical population | |||
|---|---|---|---|
| Census | Pop. | %± | |
| 1860 | 149 | — | |
| 1870 | 408 | 173.8% | |
| 1880 | 638 | 56.4% | |
| 1890 | 2,771 | 334.3% | |
| 1900 | 5,603 | 102.2% | |
| 1910 | 6,755 | 20.6% | |
| 1920 | 11,368 | 68.3% | |
| 1930 | 20,449 | 79.9% | |
| 1940 | 21,848 | 6.8% | |
| 1950 | 26,396 | 20.8% | |
| 1960 | 30,022 | 13.7% | |
| 1970 | 34,770 | 15.8% | |
| 1980 | 51,648 | 48.5% | |
| 1990 | 56,464 | 9.3% | |
| 2000 | 64,525 | 14.3% | |
| 2010 | 71,404 | 10.7% | |
| 2019 (est.) | 77,331 | [7] | 8.3% |
| U.S. Decennial Census[8] 1790–1960[9] 1900–1990[10] 1990–2000[11] 2010–2019[1] | |||
2000 census
As of the census[12] of 2000, there were 64,525 people, 27,164 households, and 18,064 families living in the county. The population density was 37 people per square mile (14/km2). There were 30,683 housing units at an average density of 18 per square mile (7/km2). The racial makeup of the county was 89.12% White, 0.84% Black or African American, 5.12% Native American, 1.13% Asian, 0.16% Pacific Islander, 1.18% from other races, and 2.44% from two or more races. 3.41% of the population were Hispanic or Latino of any race. 17.2% were of German, 13.1% English, 9.3% Irish, 8.3% United States or American and 6.0% Norwegian ancestry. 95% spoke English and 3.2% Spanish as their first language.
There were 27,164 households, out of which 25.70% had children under the age of 18 living with them, 53.90% were married couples living together, 9.00% had a female householder with no husband present, and 33.50% were non-families. 28.10% of all households were made up of individuals, and 13.40% had someone living alone who was 65 years of age or older. The average household size was 2.31 and the average family size was 2.78.
In the county, the population was spread out, with 22.00% under the age of 18, 7.10% from 18 to 24, 22.80% from 25 to 44, 26.90% from 45 to 64, and 21.30% who were 65 years of age or older. The median age was 44 years. For every 100 females there were 98.70 males. For every 100 females age 18 and over, there were 96.60 males.
The median income for a household in the county was $36,449, and the median income for a family was $44,381. Males had a median income of $35,452 versus $24,628 for females. The per capita income for the county was $19,517. About 8.90% of families and 12.50% of the population were below the poverty line, including 17.10% of those under age 18 and 6.80% of those age 65 or over.
2010 census
As of the 2010 United States Census, there were 71,404 people, 31,329 households, and 19,713 families living in the county.[13] The population density was 41.1 inhabitants per square mile (15.9/km2). There were 35,582 housing units at an average density of 20.5 per square mile (7.9/km2).[14] The racial makeup of the county was 87.0% white, 5.1% American Indian, 1.4% Asian, 0.8% black or African American, 0.1% Pacific islander, 1.8% from other races, and 3.8% from two or more races. Those of Hispanic or Latino origin made up 5.1% of the population.[13] In terms of ancestry, 21.4% were German, 16.4% were English, 12.6% were Irish, 6.5% were Norwegian, and 5.2% were American.[15]
Of the 31,329 households, 22.7% had children under the age of 18 living with them, 49.4% were married couples living together, 9.2% had a female householder with no husband present, 37.1% were non-families, and 30.4% of all households were made up of individuals. The average household size was 2.22 and the average family size was 2.70. The median age was 49.0 years.[13]
The median income for a household in the county was $44,398 and the median income for a family was $54,837. Males had a median income of $44,609 versus $32,125 for females. The per capita income for the county was $24,449. About 9.5% of families and 14.3% of the population were below the poverty line, including 21.4% of those under age 18 and 6.0% of those age 65 or over.[16]
Politics
Modern Clallam County is generally regarded as a competitive area politically. In the 2020 presidential election, Democrat Joe Biden won with 50.2% of the vote versus 46.9% of the vote for Republican Donald Trump. In the 2016 presidential election, Republican Donald Trump won with 46.7% of the vote, compared to 44.0% of the vote for Democrat Hillary Clinton. In the 2012 presidential election, Democrat Barack Obama narrowly won with 48.4% of the vote, compared to 48.0% of the vote for Republican Mitt Romney. In the 2008 presidential election, Barack Obama won the county with 50.6% of the vote, compared to 47.3% for candidate Republican John McCain.
Clallam County is a bellwether, voting for the nationwide winning candidate in all but two elections since 1920, and every presidential election from 1980 onward.[17] Democratic candidates are generally most successful in the county seat and largest city, Port Angeles, which casts a significant number of votes. The city of Sequim and its general vicinity (excepting newer developments such as Bell Hill which tend to be Republican) is generally considered a battleground area. The Forks area is generally Republican, with the exception of American Indian areas. The Makah tribe areas around Neah Bay are some of the most Democratic areas in the state. Otherwise, with the exception of a few locations (such as Blyn and Jamestown near Sequim), unincorporated Clallam County has a strong Republican lean.
Clallam County is the only county in the United States that has voted for the presidential winner in every election since 1980,[4] and currently has the longest streak as a bellwether county in the United States after Valencia County, New Mexico and Vigo County, Indiana broke their streaks in 2020.
| Year | Republican | Democratic | Third parties |
|---|---|---|---|
| 2020 | 46.8% 23,062 | 50.2% 24,721 | 3.0% 1,481 |
| 2016 | 46.4% 18,794 | 43.6% 17,677 | 10.0% 4,062 |
| 2012 | 48.0% 18,437 | 48.4% 18,580 | 3.6% 1,368 |
| 2008 | 47.3% 18,199 | 50.6% 19,470 | 2.2% 851 |
| 2004 | 51.3% 18,871 | 46.4% 17,049 | 2.3% 846 |
| 2000 | 50.4% 16,251 | 42.8% 13,779 | 6.8% 2,202 |
| 1996 | 42.1% 12,432 | 42.6% 12,585 | 15.3% 4,499 |
| 1992 | 34.1% 9,765 | 37.7% 10,820 | 28.2% 8,088 |
| 1988 | 49.1% 11,200 | 48.8% 11,123 | 2.1% 471 |
| 1984 | 57.3% 13,605 | 40.9% 9,701 | 1.8% 429 |
| 1980 | 51.7% 11,515 | 36.0% 8,029 | 12.3% 2,752 |
| 1976 | 49.7% 9,132 | 45.0% 8,268 | 5.4% 986 |
| 1972 | 58.3% 9,372 | 34.9% 5,620 | 6.8% 1,097 |
| 1968 | 41.6% 5,921 | 49.4% 7,030 | 9.0% 1,283 |
| 1964 | 31.0% 4,175 | 68.9% 9,265 | 0.1% 15 |
| 1960 | 47.6% 6,227 | 52.0% 6,801 | 0.4% 52 |
| 1956 | 54.8% 6,852 | 45.1% 5,632 | 0.1% 16 |
| 1952 | 54.0% 6,442 | 45.2% 5,390 | 0.9% 106 |
| 1948 | 41.4% 4,178 | 53.6% 5,412 | 5.0% 507 |
| 1944 | 39.2% 3,551 | 60.1% 5,441 | 0.7% 59 |
| 1940 | 36.9% 3,555 | 62.0% 5,966 | 1.1% 110 |
| 1936 | 28.6% 2,404 | 66.4% 5,586 | 5.1% 428 |
| 1932 | 24.8% 1,870 | 52.5% 3,954 | 22.7% 1,713 |
| 1928 | 65.5% 3,319 | 33.7% 1,705 | 0.8% 41 |
| 1924 | 52.1% 2,129 | 6.9% 283 | 41.0% 1,677 |
| 1920 | 53.8% 1,775 | 14.8% 489 | 31.4% 1,038 |
| 1916 | 45.2% 1,475 | 41.1% 1,339 | 13.7% 447 |
| 1912 | 28.7% 727 | 18.3% 464 | 53.0% 1,345[18] |
| 1908 | 59.6% 938 | 27.2% 428 | 13.2% 208 |
| 1904 | 68.2% 903 | 20.6% 273 | 11.3% 149 |
| 1900 | 60.5% 723 | 34.0% 407 | 5.5% 66 |
| 1896 | 43.4% 559 | 55.7% 717 | 0.9% 11 |
| 1892 | 38.2% 518 | 33.0% 448 | 28.8% 390 |
Transportation

Major highways
Airports
The following public use airports are located in the county:[19]
- William R. Fairchild International Airport (CLM) – Port Angeles
- Forks Airport (S18) – Forks
- Quillayute Airport (UIL) – Quillayute / Forks
- Sekiu Airport (11S) – Sekiu
- Sequim Valley Airport (W28) – Sequim
Communities
Cities
- Forks
- Port Angeles (County seat)
- Sequim
Census-designated places
Unincorporated communities
Popular culture
The popular Twilight Saga novels and film series are set in Clallam County. The main storyline is set in Forks; however, the characters also visit neighboring Port Angeles.
The rural-comedy film series Ma and Pa Kettle (1949–1957) is set in a fictionalized Cape Flattery.
See also
References
- "State & County QuickFacts". United States Census Bureau. Archived from the original on January 14, 2016. Retrieved January 7, 2014.
- "Find a County". National Association of Counties. Archived from the original on May 31, 2011. Retrieved June 7, 2011.
- "Milestones for Washington State History — Part 2: 1851 to 1900". HistoryLink.org. March 6, 2003.
- "Clallam County continues its streak of picking every presidential winner since 1980". king5.com. Retrieved 2020-11-08.
- "What does Clallam County know? Voters just chose a winner for the tenth straight election". kitsapsun.com. Retrieved 2020-11-08.
- "2010 Census Gazetteer Files". United States Census Bureau. August 22, 2012. Retrieved July 4, 2015.
- "Population and Housing Unit Estimates". Retrieved April 11, 2020.
- "U.S. Decennial Census". United States Census Bureau. Retrieved January 7, 2014.
- "Historical Census Browser". University of Virginia Library. Retrieved January 7, 2014.
- "Population of Counties by Decennial Census: 1900 to 1990". United States Census Bureau. Retrieved January 7, 2014.
- "Census 2000 PHC-T-4. Ranking Tables for Counties: 1990 and 2000" (PDF). United States Census Bureau. Retrieved January 7, 2014.
- "U.S. Census website". United States Census Bureau. Retrieved May 14, 2011.
- "DP-1 Profile of General Population and Housing Characteristics: 2010 Demographic Profile Data". United States Census Bureau. Archived from the original on February 13, 2020. Retrieved March 1, 2016.
- "Population, Housing Units, Area, and Density: 2010 – County". United States Census Bureau. Archived from the original on 2020-02-13. Retrieved March 1, 2016.
- "DP02 SELECTED SOCIAL CHARACTERISTICS IN THE UNITED STATES – 2006–2010 American Community Survey 5-Year Estimates". United States Census Bureau. Archived from the original on February 13, 2020. Retrieved March 1, 2016.
- "DP03 SELECTED ECONOMIC CHARACTERISTICS – 2006–2010 American Community Survey 5-Year Estimates". United States Census Bureau. Archived from the original on February 13, 2020. Retrieved March 1, 2016.
- Leip, David. "Dave Leip's Atlas of U.S. Presidential Elections". uselectionatlas.org. Retrieved April 5, 2018.
- The leading "other" candidate, Progressive Theodore Roosevelt, received 686 votes, while Socialist candidate Eugene Debs received 610 votes, Prohibition candidate Eugene Chafin received 36 votes, and Socialist Labor candidate Arthur Reimer received 13 votes.
- "Clallam County Public and Private Airports". www.tollfreeairline.com. Retrieved August 12, 2018.
External links
- Official website
 Geographic data related to Clallam County, Washington at OpenStreetMap
- North Olympic Library System
- Clallam County – Thumbnail History
- University of Washington Libraries Digital Collections – The Pacific Northwest Olympic Peninsula Community Museum A web-based museum showcasing aspects of the rich history and culture of Washington State's Olympic Peninsula communities. Features cultural exhibits, curriculum packets and a searchable archive of over 12,000 items that includes historical photographs, audio recordings, videos, maps, diaries, reports and other documents.
Places adjacent to Clallam County, Washington | ||||||||||
|---|---|---|---|---|---|---|---|---|---|---|
| ||||||||||
Municipalities and communities of Clallam County, Washington, United States | ||
|---|---|---|
| Cities | Map of Washington highlighting Clallam County | |
| CDPs | ||
| Unincorporated communities | ||
| Indian reservations | ||
| Ghost towns | ||
| ||

| Authority control |
|---|