Whatcom County, Washington
Whatcom County /ˈwɒtkəm/ is located in the U.S. state of Washington. As of the 2010 census, the population was 201,140.[1] It is bordered by Metro Vancouver Regional District and Fraser Valley Regional District in Canada on the north, Okanogan County on the east, Skagit County on the south, and the Salish Sea on the west. The county seat and largest city is Bellingham.[2]
Whatcom County | |
|---|---|
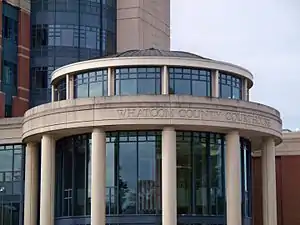 Whatcom County Courthouse in Bellingham | |
 Seal | |
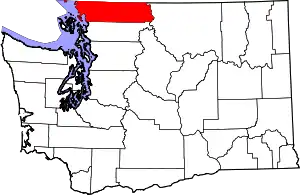 Location within the U.S. state of Washington | |
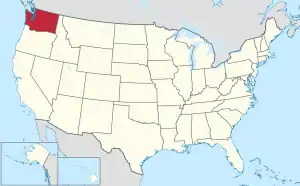 Washington's location within the U.S. | |
| Coordinates: 48°50′N 121°54′W | |
| Country | |
| State | |
| Founded | March 9, 1854 |
| Named for | Chief Whatcom |
| Seat | Bellingham |
| Largest city | Bellingham |
| Area | |
| • Total | 2,503 sq mi (6,480 km2) |
| • Land | 2,107 sq mi (5,460 km2) |
| • Water | 397 sq mi (1,030 km2) 16%% |
| Population (2010) | |
| • Total | 201,140 |
| • Estimate (2019) | 229,247 |
| • Density | 103/sq mi (40/km2) |
| Time zone | UTC−8 (Pacific) |
| • Summer (DST) | UTC−7 (PDT) |
| Congressional districts | 1st, 2nd |
| Website | www |
The county was created from Island County by the Washington Territorial Legislature in March 1854. It originally included the territory of present-day San Juan and Skagit Counties, which were later organized after additional settlement.[3] Its name derives from the Lummi word Xwotʼqom, meaning "noisy water."[4][5]
Whatcom County comprises the Bellingham, WA Metropolitan Statistical Area.
History
The Whatcom County area has known human habitation for at least twelve millennia. At least three aboriginal tribes have been identified in the area: Lummi (San Juan Islands, between Point Whitehorn and Chuckanut Bay), Nooksack (between Lynden and Maple Falls) and Semiahmoo (the northern portion, near Blaine).[6]
This area was part of the Oregon Country at the start of the nineteenth century, inhabited both by fur prospectors from Canada and Americans seeking land for agricultural and mineral-extraction opportunities. Unable to resolve which country should control this vast area, the Treaty of 1818 provided for joint control. In 1827 the Hudson's Bay Company established Fort Langley near present Lynden.[6]
By 1843, the Provisional Government of Oregon had been established, although at first there were questions as to its authority and extent.[7] During its existence, that provisional government formed the area north of the Columbia River first into the Washington Territory, and then (December 19, 1845) into two vast counties: Clark and Lewis. In 1852, a portion of Lewis County was partitioned off to form Thurston County, and in 1853 a portion of the new county was partitioned off to form Island County.
The Washington Territory was formed as a separate governing entity in 1853.[8] In 1854, that legislature carved several counties out of the existing counties, including Whatcom County on March 9, 1854, with area taken from Island County. The original county boundary was reduced in 1873 by the formation of San Juan County, and again in 1883 by the formation of Skagit County.
A Nooksack chief is the namesake of Whatcom County, taken from the word in the Nooksack language for "noisy water."[6]
In 1855 the settlers erected a blockhouse west of Whatcom Creek, to protect against forays from the aboriginal inhabitants who were attempting to defend their homelands. That year the Treaty of Point Elliott was signed, which assigned the Lummi and Semiahmoo peoples a greatly-restricted reserved area.[6]
The short-lived Fraser Canyon Gold Rush (1857–58) caused a short-term increase in the county's population, which briefly swelled to over 10,000 before the bubble burst.[6]
In 1857 the federal government began the field work necessary to establish the national border between the United States and Canada, which had been agreed on as the forty-ninth parallel in this area, and which would also mark the north line of Whatcom County. As the work moved east, several of the workers chose to remain in the area as settlers.[6]
Border crossings
Whatcom County's northern border is the Canada–US border with the Canadian province of British Columbia. Adjoining the county on the north (from west to east) are the Metro Vancouver suburbs of Delta, Surrey, Langley, the central Fraser Valley city of Abbotsford and the rural Fraser Valley Regional District.
The border crossing points are (from west to east):[9]
- the Point Roberts Tyee Dr to Tsawwassen (a neighborhood in Delta, BC).
- the Peace Arch Border Crossing, where Interstate 5 meets British Columbia Highway 99;
- the Pacific Highway Border Crossing connecting State Route 543 with British Columbia Highway 15, between Blaine and Surrey.
- the Lynden–Aldergrove Border Crossing where (SR 539 connects to British Columbia Highway 13;
- the Sumas-Huntingdon Border Crossing at Sumas (SR 9 connecting to Abbotsford, BC).
- An additional unmanned legal crossing connects British Columbia's Skagit Valley Provincial Park to North Cascades National Park in Washington State.[10]
Several shopping malls and other services in Bellingham and elsewhere in the county are geared to cross-border shopping and recreation.
Geography
According to the U.S. Census Bureau, the county has a total area of 2,503 square miles (6,480 km2), of which 2,107 square miles (5,460 km2) is land and 397 square miles (1,030 km2) (16%) is covered by water.[11]
The county includes Lake Whatcom, which empties into Bellingham Bay by way of Whatcom Creek. Physiographically, Whatcom County is an extension of the Fraser Valley or "Lower Mainland" area of British Columbia, essentially the lowland delta plain of the Fraser River. At some periods in the past, one of the Fraser River's lower arms entered Bellingham Bay near Bellingham via what is now the mouth of the Nooksack River.
A small part of the county, Point Roberts, about 5 square miles (13 km2), is an extension of the Tsawwassen Peninsula, which is bisected by the Canada–US border along the 49th parallel. The highest point in the county is the peak of the active volcano Mount Baker at 10,778 feet (3,285 m) above sea level. The lowest points are at sea level along the Pacific Ocean.
Geographic features
- Bellingham Bay
- Birch Bay
- Cascade Mountains
- Chuckanut Mountains
- Mount Baker, highest point in Whatcom County
- American Border Peak
- Sumas Mountain
- Mount Shuksan
- Chilliwack River/Chilliwack Lake
- Eliza Island
- Lake Whatcom
- Lummi Island
- Lummi Bay
- Nooksack River
- North Lookout Mountain, known locally as Galbraith Mountain
- Portage Island
- Semiahmoo Bay
- Skagit River/Ross Lake
- Sumas River
National protected areas
State protected areas
- Birch Bay State Park
- Lake Terrell Wildlife Refuge
- Larrabee State Park
- Lookout Mountain (DNR)
- Lummi Island (part) (DNR)
- Stewart Mountain (DNR)
- Lake Whatcom Watershed
Major highways
- Interstate 5 connecting with Seattle, Portland, Sacramento, Los Angeles, San Diego and points south.
- SR 20 connecting US 101 and Sidney, British Columbia with Newport, Washington via the North Cascades Highway. Farthest north highway thru the Cascade Mountains in USA. Note that this highway does not connect to most of Whatcom County – Instead, a person would have to travel south to Sedro-Woolley in Skagit County to connect to Highway 20.
- Alaska Marine Highway connecting Alaska highways to the Interstate Highway System.
Adjacent counties
- Okanogan County – east
- Skagit County – south
- San Juan County – southwest
- Metro Vancouver – north
- Fraser Valley Regional District, British Columbia – north
- Cowichan Valley Regional District, British Columbia – west
- Capital Regional District, British Columbia – west
Demographics
| Historical population | |||
|---|---|---|---|
| Census | Pop. | %± | |
| 1860 | 352 | — | |
| 1870 | 534 | 51.7% | |
| 1880 | 3,137 | 487.5% | |
| 1890 | 18,591 | 492.6% | |
| 1900 | 24,116 | 29.7% | |
| 1910 | 49,511 | 105.3% | |
| 1920 | 50,600 | 2.2% | |
| 1930 | 59,128 | 16.9% | |
| 1940 | 60,355 | 2.1% | |
| 1950 | 66,733 | 10.6% | |
| 1960 | 70,317 | 5.4% | |
| 1970 | 81,950 | 16.5% | |
| 1980 | 106,701 | 30.2% | |
| 1990 | 127,780 | 19.8% | |
| 2000 | 166,814 | 30.5% | |
| 2010 | 201,140 | 20.6% | |
| 2019 (est.) | 229,247 | [12] | 14.0% |
| U.S. Decennial Census[13] 1790–1960[14] 1900–1990[15] 1990–2000[16] 2010–2019[1] | |||
2000 census
As of the census[17] of 2000, 166,814 people, 64,446 households, and 41,116 families resided in the county. The population density was 79 people per square mile (30/km2). The 73,893 housing units averaged 35 per square mile (13/km2). The racial makeup of the county was 88.41% White, 0.69% Black or African American, 2.82% Native American, 2.78% Asian, 0.14% Pacific Islander, 2.49% from other races, and 2.66% from two or more races. About 5.21% of the population was Hispanic or Latino of any race. Of people of European ancestry, 15.5% identified as German, 9.2% as English, 8.2% as Dutch, 7.9% as Irish, 7.0% as Norwegian, and 6.6% as United States or American ancestry.
Of the 64,446 households, 30.40% had children under the age of 18 living with them, 51.20% were married couples living together, 8.80% had a female householder with no husband present, and 36.20% were not families. About 25.60% of all households were made up of individuals, and 8.40% had someone living alone who was 65 years of age or older. The average household size was 2.51 and the average family size was 3.03.
In the county, the population was distributed as 24.10% under the age of 18, 14.20% from 18 to 24, 27.50% from 25 to 44, 22.50% from 45 to 64, and 11.60% who were 65 years of age or older. The median age was 34 years. For every 100 females, there were 97.10 males. For every 100 females age 18 and over, there were 95.00 males.
The median income for a household in the county was $40,005, and for a family was $49,325. Males had a median income of $37,589 versus $26,193 for females. The per capita income for the county was $20,025. About 7.80% of families and 14.20% of the population were below the poverty line, including 14.20% of those under age 18 and 8.30% of those age 65 or over.
2010 census
As of the 2010 United States Census, 201,140 people, 80,370 households, and 48,862 families resided in the county.[18] The population density was 95.5 inhabitants per square mile (36.9/km2). The 90,665 housing units averaged 43.0 per square mile (16.6/km2).[19] The racial makeup of the county was 85.4% White, 3.5% Asian, 2.8% American Indian, 1.0% Black or African American, 0.2% Pacific Islander, 3.3% from other races, and 3.8% from two or more races. Those of Hispanic or Latino origin made up 7.8% of the population.[17] In terms of ancestry, 20.8% were German, 12.8% were Irish, 12.6% were English, 8.0% were Dutch, 6.9% were Norwegian, and 4.4% were American.[20]
Of the 80,370 households, 28.0% had children under the age of 18 living with them, 48.0% were married couples living together, 8.8% had a female householder with no husband present, 39.2% were not families, and 27.8% of all households were made up of individuals. The average household size was 2.43, and the average family size was 2.97. The median age was 36.6 years.[17]
The median income for a household in the county was $49,031 and for a family was $64,586. Males had a median income of $47,109 versus $34,690 for females. The per capita income for the county was $25,407. About 7.8% of families and 15.0% of the population were below the poverty line, including 14.9% of those under age 18 and 7.1% of those age 65 or over.[21]
Government
The Whatcom County government is a municipal corporation operating under a county charter approved in 1978; it acts as a county constitution. Whatcom County is one of four Washington counties to use the home rule charter provision of state law.[22] Local government is split between the county, incorporated cities and towns, and special-purpose districts. These local governments are established and operate according to state law, and operate independently from the county government.
County government
The charter establishes the structure of Whatcom County government. The Whatcom County Council holds legislative powers granted to counties. The council consists of seven members elected for a term of four years. Council members are elected at the general election in November of odd-numbered years. Three council members are elected one year before a presidential election; four council members are elected one year after a presidential election. Two members are elected from each of three districts; the seventh member is elected at-large, which favors candidates who can command a majority of voters. The county council also serves as the county board of health.[23]
The executive branch consists of six elected officials, a county executive, and five department heads. The county executive is similar to a mayor or governor. The assessor, auditor, prosecuting attorney, sheriff, and treasurer are elected independently from the county executive and council. These six officials serve four-year terms.[24][25] The county council establishes various departments by ordinance. The county council or county executive appoint department heads. These departments include administrative services, health, medical examiner, planning and development services, parks and recreation, and public works.[26]
The judicial branch consists of a district court and superior court. The district court is a court of limited jurisdiction which handles civil and criminal cases. Criminal cases are limited to adults charged with misdemeanor and/or gross misdemeanor offenses. State law specifies what cases are in the district court's jurisdiction. The district court operates a small claims court to resolve civil cases involving monetary damages not exceeding $5,000. No attorneys are permitted to appear in small claims court. Cases are heard using less formal procedures.[27] The district court has two judges, a court commissioner, and a support staff.
The superior court is a court of general jurisdiction.[24][27] Superior court hears civil cases exceeding $75,000 or requesting non-monetary remedies.[28] Superior court hears all juvenile criminal cases and all adult felony cases. Superior court also hears appeals from district court and municipal courts.[28] Superior court staff include three judges, three full-time court commissioners, two part-time court commissioners, and support staff. District and superior court judges are elected by the county voters for a term of four years. Court commissioners are appointed by elected judges; commissioners have powers and responsibilities equal to elected judges.
Politics
| Year | Republican | Democratic | Third parties |
|---|---|---|---|
| 2020 | 36.4% 50,489 | 60.4% 83,660 | 3.2% 4,471 |
| 2016 | 35.8% 40,599 | 53.2% 60,340 | 10.9% 12,400 |
| 2012 | 41.1% 42,703 | 55.0% 57,089 | 3.9% 3,996 |
| 2008 | 39.8% 40,205 | 57.7% 58,236 | 2.4% 2,465 |
| 2004 | 44.6% 40,296 | 53.4% 48,268 | 2.0% 1,830 |
| 2000 | 46.5% 34,287 | 46.1% 34,033 | 7.4% 5,437 |
| 1996 | 42.1% 27,153 | 45.1% 29,074 | 12.8% 8,283 |
| 1992 | 37.4% 23,801 | 41.8% 26,619 | 20.8% 13,259 |
| 1988 | 47.6% 23,820 | 51.1% 25,571 | 1.4% 703 |
| 1984 | 53.7% 27,228 | 44.7% 22,670 | 1.6% 788 |
| 1980 | 46.4% 21,371 | 40.0% 18,430 | 13.6% 6,256 |
| 1976 | 48.0% 20,007 | 47.4% 19,739 | 4.6% 1,933 |
| 1972 | 58.2% 22,585 | 38.7% 15,027 | 3.1% 1,189 |
| 1968 | 47.1% 14,695 | 44.9% 14,003 | 8.0% 2,501 |
| 1964 | 34.7% 10,900 | 64.6% 20,297 | 0.7% 225 |
| 1960 | 52.8% 16,651 | 45.4% 14,298 | 1.8% 577 |
| 1956 | 54.1% 17,414 | 45.2% 14,533 | 0.8% 244 |
| 1952 | 57.1% 17,590 | 41.8% 12,877 | 1.2% 361 |
| 1948 | 46.8% 12,850 | 46.4% 12,736 | 6.8% 1,865 |
| 1944 | 45.9% 12,890 | 52.6% 14,787 | 1.5% 421 |
| 1940 | 46.3% 13,351 | 51.6% 14,877 | 2.1% 606 |
| 1936 | 35.1% 9,035 | 59.9% 15,428 | 5.0% 1,293 |
| 1932 | 41.1% 9,254 | 50.4% 11,355 | 8.5% 1,902 |
| 1928 | 76.9% 14,621 | 21.6% 4,100 | 1.6% 300 |
| 1924 | 57.2% 9,214 | 5.8% 927 | 37.1% 5,969 |
| 1920 | 57.5% 9,157 | 14.4% 2,288 | 28.1% 4,475 |
| 1916 | 48.2% 7,632 | 35.5% 5,629 | 16.3% 2,581 |
| 1912 | 27.9% 4,187 | 18.5% 2,773 | 53.6% 8,045 |
| 1908 | 57.5% 4,955 | 27.8% 2,398 | 14.7% 1,268 |
| 1904 | 70.4% 5,410 | 15.3% 1,174 | 14.3% 1,100 |
| 1900 | 56.6% 2,952 | 32.6% 1,700 | 10.8% 562 |
| 1896 | 46.2% 1,971 | 52.2% 2,227 | 1.7% 72 |
| 1892 | 41.5% 1,709 | 28.2% 1,161 | 30.3% 1,248 |
Cities and towns
Incorporated cities and towns provide municipal services. Each city or town has an elected council and mayor.
Special purpose districts
Special-purpose districts include cemetery, fire, hospital, library, school, and water and sewer districts. Each special district is governed by officials elected by voters within that jurisdiction.
Fire districts
Eleven fire districts, two city fire departments, and a regional fire authority provide fire prevention, fire fighting, and emergency medical services. Each fire district is governed by an elected board of commissioners. Most districts have three commissioners. Fire districts receive most of their revenue from property taxes. All of the fire districts and the regional fire authority have volunteer or paid-call firefighters and emergency medical technicians (EMTs), as does the City of Lynden Fire Department.
The City of Bellingham is an all-career department. Some of the districts also have full-time firefighter/EMTs. All fire districts use 9-1-1 for emergency calls. Whatcom County has one 9-1-1 call center located in Bellingham. Fire/EMS calls are processed and dispatched at a second public safety answering point called Prospect, located at a fire station in Bellingham. Additional dispatching locations provide backup capacity to answer emergency calls.
Whatcom County Fire Districts are:[30]
- Fire District 1 serves Deming, Everson, Nooksack, and Nugents Corner.
- Fire District 2 was amalgamated into South Whatcom Regional Fire Authority.
- Fire District 3 was merged to form Fire District 21.
- Fire District 4 contracts for service with Fire District 21.
- Fire District 5 serves Point Roberts.
- Fire District 6 was amalgamated into South Whatcom Regional Fire Authority.
- Fire District 7 serves areas near Ferndale and Cherry Point.
- Fire District 8 serves Bellingham International Airport, the Lummi Nation, and Marietta.
- Fire District 9 was amalgamated into South Whatcom Regional Fire Authority.
- Fire District 10 was amalgamated into South Whatcom Regional Fire Authority.
- Fire District 11 serves Lummi Island
- Fire District 13 was merged to form Fire District 21.
- Fire District 14 serves areas around SR 542 between Deming and Maple Falls, SR 547, and Sumas.
- Fire District 16 serves communities along SR 9 south of SR 542.
- Fire District 17 serves Sandy Point.
- Fire District 18 serves southern Lake Whatcom and Glenhaven Lakes.
- Fire District 19 serves Glacier.
- Fire District 21, North Whatcom Fire and Rescue serves northwest Whatcom County including Birch Bay, Blaine, Laurel, and Lynden°, Hayne, Delta, and Greenwood
- The South Whatcom Regional Fire Authority serves Geneva, Sudden Valley, Chuckanut Drive, Lake Samish, and Yew Street Road.
° Outside Lynden city limits only. The Lynden Fire Department serves Lynden.
Economy
Coal mines, a sawmill, and a military fort were established on Bellingham Bay in the 1850s. Logging was the principal economic activity at first, and agriculture developed as land was cleared by logging activity. Canneries, both of fish and crops, shipped the county's products far and wide.
Pacific American Fisheries organized in 1899 in Fairhaven, and became the world's largest canning operation, employing over 1,000 Chinese and 4,500 "white persons". Smaller canneries at Semiahmoo also produced 2,000 cases of canned salmon daily. The Fairhaven Shipyard constructed fleets of fishing ships, and also produced freighters during World War I.[6]
Whatcom County is the top producer of raspberries in the state.[31]
Cross border activity is a significant driver of the economy.
Education
Primary and secondary education
Whatcom County residents are served by public and private schools, providing preschool, primary (K-5), and secondary (6–12) education. Public schools are operated by eight school districts. Each school district is an independent local government managed by an elected school board. Seven districts serve the western portion of Whatcom County.[32] One district serves the southeast corner of Whatcom County. The remaining portion of the county is national forest or national park land, which has no permanent residents.
These districts are:
- Bellingham School District serves Bellingham, Chuckanut, Lake Samish, and Sudden Valley.
- Blaine School District serves Blaine, Birch Bay, and Point Roberts.
- Concrete School District serves the county's southeast corner, including Newhalem and Diablo.
- Ferndale School District serves Ferndale, Custer, Lummi Island, and the Lummi Nation.
- Lynden School District serves Lynden and surrounding areas.
- Meridian School District serves rural communities between Bellingham and Lynden.
- Mount Baker School District serves communities along the Mount Baker Highway and Nooksack River.
- Nooksack Valley School District serves Everson, Nooksack, and Sumas.
Numerous private schools operate in Whatcom County, including Assumption Catholic School, St. Paul's Academy, Lynden Christian Schools, Bellingham Christian Schools, and the Waldorf School.
Higher education
Whatcom County hosts five institutions of higher education. Western Washington University (Western) is the third-largest public university in Washington. Western offers bachelor's and master's degrees through seven colleges and enrolls more than 15,000 students. Whatcom Community College is a public community college offering academic certificate programs and associate degrees. Two universities and two colleges are located in Bellingham. One college is located on the Lummi Nation (Lummi Reservation) west of Bellingham. Bellingham Technical College is a public technical and vocational college located in Bellingham. Trinity Western University (TWU) is a private, Christian university based in Langley, BC, about 25 miles north of Bellingham. TWU operates a branch campus in Bellingham, offering undergraduate courses and supports TWU's bachelor's degree completion program.
Northwest Indian College is a college supported by the Lummi Nation and serves the Native American community. Northwest Indian College is located on the Lummi Nation (Lummi Reservation), about five miles west of Bellingham.
Communities
Census-designated places
Unincorporated communities
- Blue Canyon
- Chuckanut
- Clearbrook
- Clipper
- Dewey
- Diablo
- Laurel
- Lummi Island
- Newhalem
- Saxon
- Van Buren
- Wahl
- Welcome
- Wickersham
Notable people
- Steve Alvord, defensive tackle in the NFL in 1987–88.
- Ryan Stiles, Emmy Award-nominated actor and comedian
- Hilary Swank, award-winning movie actress
See also
- National Register of Historic Places listings in Whatcom County, Washington
- Nooksack Salmon Enhancement Association, a non-profit organization dedicated to salmon restoration
- Whatcom Watch, a local newspaper
References
- "State & County QuickFacts". United States Census Bureau. Retrieved January 8, 2014.
- "Find a County". National Association of Counties. Retrieved June 7, 2011.
- "Milestones for Washington State History — Part 2: 1851 to 1900". HistoryLink.org. March 6, 2003.
- Oakley, Janet (July 3, 2005). "Whatcom County — Thumbnail History". HistoryLink.org.
- Johnson, Annie (2004). "Shifting Shorelines".
- Bellingham/Whatcom Chamber of Commerce & Industry
- Brown, J. Henry (1892). Brown's Political History of Oregon: Provisional Government. Portland: Wiley B. Allen. LCCN rc01000356. OCLC 422191413.
- Journal of the House of Representatives of the United States, Volume 48, p. 397, March 3, 1853.
- https://theimtc.com/data/
- https://www.straight.com/life/just-across-border-north-cascades-national-park-beckons
- "2010 Census Gazetteer Files". United States Census Bureau. August 22, 2012. Retrieved July 16, 2015.
- "Population and Housing Unit Estimates". Retrieved April 11, 2020.
- "U.S. Decennial Census". United States Census Bureau. Retrieved January 8, 2014.
- "Historical Census Browser". University of Virginia Library. Retrieved January 8, 2014.
- "Population of Counties by Decennial Census: 1900 to 1990". United States Census Bureau. Retrieved January 8, 2014.
- "Census 2000 PHC-T-4. Ranking Tables for Counties: 1990 and 2000" (PDF). United States Census Bureau. Retrieved January 8, 2014.
- "U.S. Census website". United States Census Bureau. Retrieved May 14, 2011.
- "Profile of General Population and Housing Characteristics: 2010 Demographic Profile Data". United States Census Bureau. Archived from the original on February 13, 2020. Retrieved March 6, 2016.
- "Population, Housing Units, Area, and Density: 2010 – County". United States Census Bureau. Archived from the original on February 13, 2020. Retrieved March 6, 2016.
- "Selected Social Characteristics in the United States – 2006–2010 American Community Survey 5-Year Estimates". United States Census Bureau. Archived from the original on February 13, 2020. Retrieved March 6, 2016.
- "Selected Economic Characteristics – 2006–2010 American Community Survey 5-Year Estimates". United States Census Bureau. Archived from the original on February 13, 2020. Retrieved March 6, 2016.
- "History - Whatcom County, WA - Official Website". www.whatcomcounty.us. Retrieved August 19, 2017.
- "County Council - Whatcom County, WA - Official Website". www.co.whatcom.wa.us. Retrieved August 19, 2017.
- "County Elected Officials". Archived from the original on May 27, 2008. Retrieved August 19, 2017.
- "County Code and Charter". Retrieved August 19, 2017.
- "Complete List of County Departments & Offices - Whatcom County, WA - Official Website". www.whatcomcounty.us. Retrieved August 19, 2017.
- "District Court - Whatcom County, WA - Official Website". www.whatcomcounty.us. Retrieved August 19, 2017.
- "Whatcom County Superior Court". Retrieved August 19, 2017.
- Leip, David. "Dave Leip's Atlas of U.S. Presidential Elections". uselectionatlas.org. Retrieved August 19, 2017.
- "Whatcom County Fire Districts map". Retrieved August 19, 2017.
- Seattle Times
- "School Districts in Whatcom County". Retrieved August 19, 2017.
External links
Places adjacent to Whatcom County, Washington | ||||||||||
|---|---|---|---|---|---|---|---|---|---|---|
| ||||||||||
Municipalities and communities of Whatcom County, Washington, United States | ||
|---|---|---|
| Cities | Map of Washington highlighting Whatcom County | |
| CDPs | ||
| Indian reservations | ||
| Unincorporated communities | ||
| Ghost towns | ||
| ||
| Authority control |
|---|