Wahkiakum County, Washington
Wahkiakum County /wəˈkaɪ.əkʌm/ is a county located in the U.S. state of Washington. As of the 2010 census, the population was 3,978,[1] making it the second-least populous county in Washington. The county seat and only incorporated town is Cathlamet.[2] The county was formed out of Cowlitz County in April 1854[3] and is named for Chief Wahkiakum ("Tall Timber") of the Chinook, who is buried in the Pioneer Cemetery in Cathlamet.[4]
Wahkiakum County | |
|---|---|
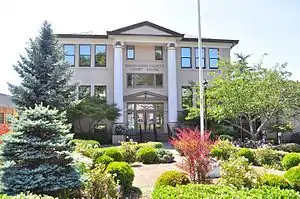 Wahkiakum County Courthouse at Cathlamet (July 2015) | |
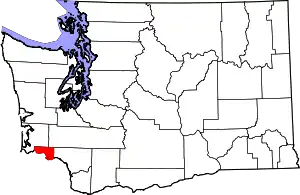 Location within the U.S. state of Washington | |
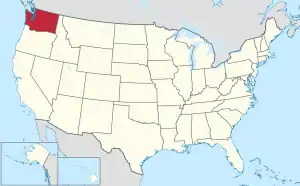 Washington's location within the U.S. | |
| Coordinates: 46°17′N 123°26′W | |
| Country | |
| State | |
| Founded | April 24, 1854 |
| Named for | Chief Wahkiakum |
| Seat | Cathlamet |
| Largest town | Puget Island |
| Area | |
| • Total | 287 sq mi (740 km2) |
| • Land | 263 sq mi (680 km2) |
| • Water | 24 sq mi (60 km2) 8.3%% |
| Population (2010) | |
| • Total | 3,978 |
| • Estimate (2019) | 4,488 |
| • Density | 15/sq mi (6/km2) |
| Time zone | UTC−8 (Pacific) |
| • Summer (DST) | UTC−7 (PDT) |
| Congressional district | 3rd |
| Website | www |
The county operates the Wahkiakum County Ferry, which connects Cathlamet to Westport, Oregon, across the Columbia River.
Geography
According to the U.S. Census Bureau, the county has a total area of 287 square miles (740 km2), of which 263 square miles (680 km2) is land and 24 square miles (62 km2) (8.3%) is water.[5] It is the smallest county of Washington by total area and the third-smallest by land area, ahead of San Juan County and Island County, which are mostly water by area.
Geographic features
State highways
Adjacent counties
- Pacific County – northwest
- Lewis County – north/northeast
- Cowlitz County – east/southeast
- Columbia County, Oregon – south/southeast
- Clatsop County, Oregon – south/southwest
National protected area
Demographics
| Historical population | |||
|---|---|---|---|
| Census | Pop. | %± | |
| 1860 | 42 | — | |
| 1870 | 270 | 542.9% | |
| 1880 | 1,598 | 491.9% | |
| 1890 | 2,526 | 58.1% | |
| 1900 | 2,819 | 11.6% | |
| 1910 | 3,285 | 16.5% | |
| 1920 | 3,472 | 5.7% | |
| 1930 | 3,862 | 11.2% | |
| 1940 | 4,286 | 11.0% | |
| 1950 | 3,835 | −10.5% | |
| 1960 | 3,426 | −10.7% | |
| 1970 | 3,592 | 4.8% | |
| 1980 | 3,832 | 6.7% | |
| 1990 | 3,327 | −13.2% | |
| 2000 | 3,824 | 14.9% | |
| 2010 | 3,978 | 4.0% | |
| 2019 (est.) | 4,488 | [6] | 12.8% |
| U.S. Decennial Census[7] 1790–1960[8] 1900–1990[9] 1990–2000[10] 2010–2019[1] | |||
Wahkiakum County has the second lowest population of any county in Washington state. Its population of 3,978 is 0.2% the size of the population of Washington's largest county, King.
The county has the second highest divorce rate of any Washington county, behind Lincoln County.[11]
2000 census
As of the census[12] of 2000, there were 3,824 people, 1,553 households, and 1,108 families living in the county. The population density was 14 people per square mile (6/km2). There were 1,792 housing units at an average density of 7 per square mile (3/km2). The racial makeup of the county was 93.46% White, 0.26% Black or African American, 1.57% Native American, 0.47% Asian, 0.08% Pacific Islander, 1.65% from other races, and 2.51% from two or more races. 2.56% of the population were Hispanic or Latino of any race. 18.7% were of German, 13.1% Norwegian, 10.6% United States or American, 9.1% English, 7.7% Irish, 6.5% Swedish, and 5.9% Finnish ancestry. 96.7% spoke English and 2.5% Spanish as a first language.
There were 1,553 households, out of which 26.90% had children under the age of 18 living with them, 61.40% were married couples living together, 6.30% had a female householder with no husband present, and 28.60% were non-families. 24.40% of all households were made up of individuals, and 10.60% had someone living alone who was 65 years of age or older. The average household size was 2.42 and the average family size was 2.83.
In the county, the population was spread out, with 23.40% under the age of 18, 5.30% from 18 to 24, 22.20% from 25 to 44, 30.60% from 45 to 64, and 18.50% who were 65 years of age or older. The median age was 44 years. For every 100 females there were 100.10 males. For every 100 females age 18 and over, there were 98.10 males.
The median income for a household in the county was $39,444, and the median income for a family was $47,604. Males had a median income of $37,123 versus $27,938 for females. The per capita income for the county was $19,063. About 5.90% of families and 8.10% of the population were below the poverty line, including 11.00% of those under age 18 and 2.70% of those age 65 or over.
2010 census
As of the 2010 United States Census, there were 3,978 people, 1,737 households, and 1,187 families living in the county.[13] The population density was 15.1 inhabitants per square mile (5.8/km2). There were 2,067 housing units at an average density of 7.8 per square mile (3.0/km2).[14] The racial makeup of the county was 94.0% white, 1.3% American Indian, 0.6% Asian, 0.3% black or African American, 0.2% Pacific islander, 0.7% from other races, and 3.1% from two or more races. Those of Hispanic or Latino origin made up 2.7% of the population.[13] In terms of ancestry, 19.8% were Norwegian, 19.3% were German, 13.3% were English, 9.6% were American, 8.5% were Swedish, and 6.8% were Irish.[15]
Of the 1,737 households, 21.9% had children under the age of 18 living with them, 57.2% were married couples living together, 6.2% had a female householder with no husband present, 31.7% were non-families, and 26.8% of all households were made up of individuals. The average household size was 2.26 and the average family size was 2.69. The median age was 52.3 years.[13]
The median income for a household in the county was $40,372 and the median income for a family was $47,266. Males had a median income of $44,779 versus $36,111 for females. The per capita income for the county was $23,115. About 7.1% of families and 12.2% of the population were below the poverty line, including 14.5% of those under age 18 and 10.7% of those age 65 or over.[16]
Politics
In the 2016 Presidential election, Donald Trump won the county over Hillary Clinton by a decisive margin – 55.3% to 34.3%.[17] It is generally a swing county in presidential elections. Between 1932 and 1996, it voted Democratic all but twice, but since 2000 it has voted Republican all but once.
| Year | Republican | Democratic | Third parties |
|---|---|---|---|
| 2020 | 58.4% 1,741 | 39.1% 1,165 | 2.5% 75 |
| 2016 | 55.3% 1,344 | 34.3% 832 | 10.4% 253 |
| 2012 | 48.4% 1,119 | 47.3% 1,094 | 4.3% 100 |
| 2008 | 47.9% 1,105 | 48.6% 1,121 | 3.5% 80 |
| 2004 | 52.4% 1,171 | 45.7% 1,021 | 1.9% 43 |
| 2000 | 52.4% 1,033 | 40.7% 803 | 7.0% 137 |
| 1996 | 33.7% 619 | 50.3% 924 | 16.0% 293 |
| 1992 | 27.2% 488 | 38.8% 696 | 34.1% 612 |
| 1988 | 38.7% 629 | 59.1% 961 | 2.2% 36 |
| 1984 | 44.6% 776 | 53.5% 930 | 1.9% 33 |
| 1980 | 46.6% 828 | 42.2% 751 | 11.2% 199 |
| 1976 | 41.2% 704 | 55.1% 942 | 3.7% 64 |
| 1972 | 47.4% 818 | 46.1% 796 | 6.5% 112 |
| 1968 | 38.3% 641 | 53.7% 899 | 8.1% 135 |
| 1964 | 27.5% 446 | 72.4% 1,175 | 0.2% 3 |
| 1960 | 46.2% 796 | 53.6% 923 | 0.2% 3 |
| 1956 | 45.7% 808 | 53.9% 953 | 0.3% 6 |
| 1952 | 46.3% 815 | 52.7% 928 | 1.0% 17 |
| 1948 | 39.0% 622 | 54.9% 877 | 6.1% 98 |
| 1944 | 34.4% 532 | 64.9% 1,003 | 0.7% 10 |
| 1940 | 35.2% 642 | 63.8% 1,164 | 1.0% 19 |
| 1936 | 26.5% 419 | 69.4% 1,098 | 4.2% 66 |
| 1932 | 32.4% 442 | 53.5% 730 | 14.1% 192 |
| 1928 | 59.3% 578 | 39.2% 382 | 1.5% 15 |
| 1924 | 60.5% 496 | 10.9% 89 | 28.7% 235 |
| 1920 | 57.6% 494 | 19.1% 164 | 23.2% 199 |
| 1916 | 52.1% 490 | 36.1% 340 | 11.8% 111 |
| 1912 | 31.9% 282 | 20.9% 185 | 47.2% 417 |
| 1908 | 70.8% 485 | 21.9% 150 | 7.3% 50 |
| 1904 | 72.9% 473 | 15.6% 101 | 11.6% 75 |
| 1900 | 61.8% 396 | 32.3% 207 | 5.9% 38 |
| 1896 | 42.1% 290 | 57.5% 396 | 0.4% 3 |
| 1892 | 46.2% 239 | 43.5% 225 | 10.3% 53 |
Communities
Town
- Cathlamet (county seat)
Census-designated places
Unincorporated communities
- Brookfield
- Eagle Cliff
- Flandersville
- Skamokawa
- Waterford
Notable residents
- Krist Novoselic, former bass player of the Seattle grunge band Nirvana
- Robert Michael Pyle, lepidopterist and author
- Hadley Caliman, jazz musician
References
- "State & County QuickFacts". United States Census Bureau. Archived from the original on January 9, 2014. Retrieved January 8, 2014.
- "Find a County". National Association of Counties. Retrieved June 7, 2011.
- "Milestones for Washington State History — Part 2: 1851 to 1900". HistoryLink.org. March 6, 2003.
- History of Wahkiakum County
- "2010 Census Gazetteer Files". United States Census Bureau. August 22, 2012. Retrieved July 16, 2015.
- "Population and Housing Unit Estimates". Retrieved April 12, 2020.
- "U.S. Decennial Census". United States Census Bureau. Retrieved January 8, 2014.
- "Historical Census Browser". University of Virginia Library. Retrieved January 8, 2014.
- "Population of Counties by Decennial Census: 1900 to 1990". United States Census Bureau. Retrieved January 8, 2014.
- "Census 2000 PHC-T-4. Ranking Tables for Counties: 1990 and 2000" (PDF). United States Census Bureau. Retrieved January 8, 2014.
- St. John, Natalie (March 7, 2017). "Cathlamet is place to go for mail-order divorces". Chinook Observer. Retrieved September 29, 2019.
- "U.S. Census website". United States Census Bureau. Retrieved May 14, 2011.
- "Profile of General Population and Housing Characteristics: 2010 Demographic Profile Data". United States Census Bureau. Archived from the original on February 13, 2020. Retrieved March 6, 2016.
- "Population, Housing Units, Area, and Density: 2010 – County". United States Census Bureau. Archived from the original on February 13, 2020. Retrieved March 6, 2016.
- "Selected Social Characteristics in the United States – 2006–2010 American Community Survey 5-Year Estimates". United States Census Bureau. Archived from the original on February 13, 2020. Retrieved March 6, 2016.
- "Selected Economic Characteristics – 2006–2010 American Community Survey 5-Year Estimates". United States Census Bureau. Archived from the original on February 13, 2020. Retrieved March 6, 2016.
- US Elections Atlas
- Leip, David. "Dave Leip's Atlas of U.S. Presidential Elections". uselectionatlas.org. Retrieved April 10, 2018.
External links
- Wahkiakum County, official county site
 Media related to Wahkiakum County, Washington at Wikimedia Commons
Places adjacent to Wahkiakum County, Washington | ||||||||||
|---|---|---|---|---|---|---|---|---|---|---|
| ||||||||||
Municipalities and communities of Wahkiakum County, Washington, United States | ||
|---|---|---|
| Town | Map of Washington highlighting Wahkiakum County | |
| CDPs | ||
| Unincorporated communities |
| |
| ||
| Authority control |
|---|