Whitby—Oshawa (provincial electoral district)
Whitby—Oshawa was a provincial electoral district in Ontario, Canada, that was represented in the Legislative Assembly of Ontario from the 2007 provincial election until 2018. The riding was adjusted by the 2015 Representation Act for the 2018 provincial election,[2] losing some territory to the district of Oshawa,[3] and replaced as the district of Whitby.
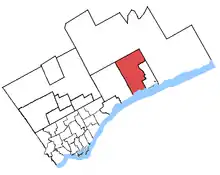 Whitby—Oshawa in relation to other Greater Toronto ridings | |
| Defunct provincial electoral district | |
| Legislature | Legislative Assembly of Ontario |
| District created | 2006 |
| District abolished | 2018 |
| First contested | 2011 |
| Last contested | 2016-by |
| Demographics | |
| Population (2011) | 146,307 |
| Electors (2014) | 110,398[1] |
| Area (km²) | 234 |
| Census division(s) | Durham |
| Census subdivision(s) | Whitby, Oshawa |
.png.webp)
History
The riding was created in 2003 and consists of 68 percent of the Whitby—Ajax district, 20 percent of the Oshawa district and three percent of the Durham.[4] The provincial electoral district was created from the same ridings in 2007.
It consists of the Town of Whitby and northwestern section of the City of Oshawa (specifically, the portion of the city lying north and west of a line drawn from the western city limit east along King Street West, north along the Oshawa Creek, east along Rossland Road West, north along Simcoe Street North, and east along Winchester Road East to the eastern city limit).
For the 2018 election, Whitby-Oshawa was re-districted as Whitby to more closely correspond to the actual town's borders.
Demographics
According to the Canada 2011 Census
- Population: 146,307
- Ethnic Groups: 81.4% White, 5.5% Black, 4.3% South Asian, 1.7% Chinese, 1.7% Filipino, 1.4% Aboriginal
- Languages: 85.3% English, 2.1% French, 1.5% Italian, 1.1% Chinese
- Religion: 71.2% Christian (32.6% Catholic, 10.3% United Church, 8.3% Anglican, 2.6% Presbyterian, 2.4% Christian Orthodox, 2.1% Baptist, 10.4% Other Christian), 2.6% Muslim, 1.4% Hindu, 23.6% No religion.
- Average household income: $104,969
- Median household income: $89,608
- Average individual income: $48,444
- Median individual income: $37,099
Members of Provincial Parliament
| Whitby—Oshawa | ||||
|---|---|---|---|---|
| Assembly | Years | Member | Party | |
| Riding created from Whitby—Ajax, Oshawa and Durham | ||||
| 39th | 2007–2011 | Christine Elliott | Progressive Conservative | |
| 40th | 2011–2014 | |||
| 41st | 2014–2015 | |||
| 2016–2018 | Lorne Coe | |||
| Riding dissolved into Whitby, Durham and Oshawa | ||||
Election results
| Ontario provincial by-election, February 11, 2016 Resignation of Christine Elliott | ||||||||
|---|---|---|---|---|---|---|---|---|
| Party | Candidate | Votes | % | ±% | ||||
| Progressive Conservative | Lorne Coe | 17,053 | 52.92 | +12.27 | ||||
| Liberal | Elizabeth Roy | 8,865 | 27.51 | −3.99 | ||||
| New Democratic | Niki Lundquist | 5,172 | 16.05 | −6.99 | ||||
| Green | Stacey Leadbetter | 529 | 1.64 | −2.63 | ||||
| None of the Above | Greg Vezina | 261 | 0.81 | – | ||||
| Independent | Above Znoneofthe | 140 | 0.43 | – | ||||
| Libertarian | Adam McEwan | 109 | 0.34 | – | ||||
| People's Political Party | Garry Cuthbert | 52 | 0.16 | – | ||||
| Freedom | Douglas Thom | 34 | 0.11 | −0.44 | ||||
| Pauper | John Turmel | 11 | 0.03 | – | ||||
| Total valid votes | 32,226 | 100.00 | ||||||
| Total rejected, unmarked and declined ballots | 61 | 0.19 | ||||||
| Turnout | 32,287 | 28.94 | ||||||
| Eligible voters | 111,566 | |||||||
| Progressive Conservative hold | Swing | +8.13 | ||||||
Source(s)
Elections Ontario (February 12, 2016). "Return from the Records, 2016 By-election Whitby—Oshawa (100)" (PDF). Retrieved February 18, 2016. | ||||||||
| 2014 Ontario general election | ||||||||
|---|---|---|---|---|---|---|---|---|
| Party | Candidate | Votes | % | ±% | ||||
| Progressive Conservative | Christine Elliott | 24,027 | 40.65 | -7.52 | ||||
| Liberal | Ajay Krishnan | 18,617 | 31.50 | -1.90 | ||||
| New Democratic | Ryan Kelly | 13,621 | 23.04 | +7.58 | ||||
| Green | Stacey Leadbetter | 2,523 | 4.27 | +2.03 | ||||
| Freedom | Douglas Thom | 322 | 0.54 | +0.23 | ||||
| Total valid votes | 59,110 | 100.00 | ||||||
| Total rejected ballots | 892 | 1.49 | +1.18 | |||||
| Turnout | 60,002 | 54.35 | +4.66 | |||||
| Eligible voters | 110,398 | |||||||
| Progressive Conservative hold | Swing | -2.81 | ||||||
| Source: Elections Ontario[5] | ||||||||
| 2011 Ontario general election | ||||||||
|---|---|---|---|---|---|---|---|---|
| Party | Candidate | Votes | % | ±% | ||||
| Progressive Conservative | Christine Elliott | 24,499 | 48.17 | +4.16 | ||||
| Liberal | Elizabeth Roy | 16,988 | 33.40 | −2.59 | ||||
| New Democratic | Maret Sadem-Thompson | 7,865 | 15.46 | +4.34 | ||||
| Green | Bradley Gibson | 1,139 | 2.24 | −5.02 | ||||
| Special Needs | Dan King | 211 | 0.41 | |||||
| Freedom | Douglas Thom | 160 | 0.31 | +0.02 | ||||
| Total valid votes | 50,862 | 100.00 | ||||||
| Total rejected, unmarked and declined ballots | 154 | 0.30 | -0.22 | |||||
| Turnout | 51,016 | 49.69 | -3.84 | |||||
| Eligible voters | 102,672 | |||||||
| Progressive Conservative hold | Swing | +3.38 | ||||||
Source(s)
"Official return from the records / Rapport des registres officiels - Whitby—Oshawa" (PDF). Elections Ontario. 2011. Retrieved 5 June 2014. | ||||||||
| 2007 Ontario general election | ||||||||
|---|---|---|---|---|---|---|---|---|
| Party | Candidate | Votes | % | ±% | ||||
| Progressive Conservative | Christine Elliott | 22,694 | 44.00 | −3.12 | ||||
| Liberal | Laura Hammer | 18,560 | 35.99 | −1.00 | ||||
| New Democratic | Nigel Moses | 5,734 | 11.12 | −1.57 | ||||
| Green | Doug Anderson | 3,745 | 7.26 | |||||
| Libertarian | Marty Gobin | 414 | 0.80 | |||||
| Family Coalition | Dale Chilvers | 275 | 0.53 | |||||
| Freedom | Bill Frampton | 152 | 0.29 | |||||
| Total valid votes | 51,572 | 100.00 | ||||||
| Total rejected ballots | 270 | 0.52 | ||||||
| Turnout | 51,842 | 53.53 | ||||||
| Eligible voters | 96,842 | |||||||
| Progressive Conservative hold | Swing | −1.06 | ||||||
^ Change is from redistributed results.
| 2003 general election redistributed results[6] | |||
|---|---|---|---|
| Party | Vote | % | |
| Progressive Conservative | 22,278 | 47.13 | |
| Liberal | 17,485 | 36.99 | |
| New Democratic | 5,999 | 12.69 | |
| Others | 1,511 | 3.20 | |
2007 electoral reform referendum
| 2007 Ontario electoral reform referendum | |||
|---|---|---|---|
| Side | Votes | % | |
| First Past the Post | 33,509 | 66.18 | |
| Mixed member proportional | 17,121 | 33.82 | |
| Total | 50,630 | 100.00 | |
| Rejected | 1,212 | 2.34 | |
References
- http://www.elections.on.ca/content/dam/NGW/sitecontent/2014/historical-results/2014/Statistical%20Summary%20-%202014%20General%20Election%20and%202012-2014%20By-elections.pdf
- https://www.elections.on.ca/en/voting-in-ontario/electoral-districts/redistribution.html#accordionchanges
- https://www.ontario.ca/laws/statute/15r31
- "Canada Votes 2006: Whitby-Oshawa". CBC. 2006. Archived from the original on 2007-06-13. Retrieved 2007-08-01.
- "Summary of Valid Votes Cast For Each Candidate" (PDF). Elections Ontario. 2014. Retrieved 11 January 2016.
- https://web.archive.org/web/20071012015305/http://www.elections.on.ca/NR/rdonlyres/58B42005-4D29-433A-B555-39A7DC0660D5/0/Transposition_of_votes.xls