Oshawa (electoral district)
Oshawa (formerly known as Oshawa—Whitby) is a federal electoral district in Ontario, Canada, that is represented in the House of Commons of Canada. It currently consists of the City of Oshawa south of Taunton Road. Historially, the riding was dominated by a working-class electorate.
 Oshawa in relation to other Greater Toronto Area districts | |||
| Federal electoral district | |||
| Legislature | House of Commons | ||
| MP |
Conservative | ||
| District created | 1966 | ||
| First contested | 1968 | ||
| Last contested | 2019 | ||
| District webpage | profile, map | ||
| Demographics | |||
| Population (2016)[1] | 126,764 | ||
| Electors (2015) | 94,928 | ||
| Census division(s) | Durham | ||
| Census subdivision(s) | Oshawa | ||
The riding was first created in 1966 from parts of what are now Oshawa and Whitby, and was very competitive for its first 2 elections. However, the riding quickly became a New Democratic Party (NDP) stronghold during the tenure of Ed Broadbent and the riding continued to be that way until the early 1990s. During this period, the boundaries were changed twice, in 1976 and 1987, with the riding now consisting of southern and central Oshawa.
In the early 1990s, the unpopularity of both the NDP and the Progressive Conservatives (PCs) caused the Liberals to win the seat throughout the 1990s. After the PCs and the Reform Party merged to form the Conservative Party, the NDP tried to take it back by nominating a well-known labour leader but lost by a close margin. In the elections following 2004, the Conservatives continued to increase their share of the vote, as did the NDP to a lesser extent, at the expense of the Liberals. Despite large Liberal gains in 2015, the Conservatives continued to hold this riding. It has been represented by Conservative Colin Carrie since 2004.
Riding profile
The riding currently consists of the City of Oshawa south of Taunton Road.[2]
In 2016, the riding's population was 126,764, an increase of 0.8% compared to the population in 2011. In 2015, the median income in the riding was $32,567, slightly below the Ontario average and up from 30,773 in 2010.[1][3] The riding has a much lower proportion of visible minorities compared to the rest of the province. In 2016, 11.9% of the riding's population was part of a visible minority, compared to the provincial average of 29.3%.[1] In 2011, about 67% of the riding's population was Christian, which was slightly above the Ontario average. Having no religious affiliation was also slightly above the Ontario average, with about 30% of people in the riding having no affiliation.[3][4] The riding had historically been dominated by a working-class electorate, but the loss of auto industry jobs in the area since the 1980s has lessened the effect of the working class.[5]
History
1966-1990: Oshawa—Whitby as a marginal seat and dominance of the NDP
The riding was first created in 1966 with the Town of Whitby, the City of Oshawa, and part of Whitby Township, which were previously part of the riding of Ontario. In 1967, its name was changed to "Oshawa—Whitby."[6][7] In the Ontario riding, the previous election was competitive, with the PCs, Liberals, and NDP all being within about 6500 votes (10%) away from each other.[8] In 1968, the election was very close. There were over 45,000 votes cast and all 3 candidates were within 325 votes of each other. NDP candidate Ed Broadbent won, beating PC Michael Starr, who won the previous election in the riding of Ontario, by 15 votes.[8][9] Broadbent and Starr would once again run against each other in the 1972 election. It was also a close race, with Broadbent beating Starr by 824 votes.[9]
In the 1974 election, Broadbent had increased his lead to 11,000 votes, and his vote count was almost as much as the Liberal and PC candidates combined.[8] This had happened at the same time as prominent New Democrats such as David Lewis lost their seats.[10] Shortly after the 1974 election, Broadbent was appointed Parliamentary leader of the NDP.[11] In 1975, Broadbent was elected leader of the NDP.[12] In 1976, the riding was modified to now only include the City of Oshawa and its name was changed back to "Oshawa."[7][13] In 1979, a writer for Maclean's described Broadbent's re-election chances as "considerably better" than his chances in 1968.[10] He ended up being re-elected by a similar margin, though this time it was over a PC instead of a Liberal.[8]
By this point, the riding was an NDP stronghold and they continued to win elections by large margins, increasing their margin of victory to 12,000 votes in 1980.[8][9] Shortly afterward, Prime Minister Pierre Trudeau invited Broadbent to join his cabinet, but Broadbent ultimately rejected his offer.[14] In 1984, Broadbent held on to the seat by a margin of 2000 votes despite the landslide that the PCs won nationally.[8][9] In 1986, the riding was modified to exclude the area north of Rossland Road.[13] In 1988, Broadbent would increase his margin of victory to about 4,400 votes over the PCs.[8]
In 1989, Broadbent resigned as NDP leader and he announced his retirement as MP later that year. He left parliament on December 31, 1989.[12][15][16] By mid-1990, before the by-election happened, the government of Prime Minister Brian Mulroney was very unpopular.[17] The PCs ended up dropping from 33.8% to 6.4% and the NDP increased their vote share slightly. The Liberals increased their vote share to 34.4%.[18]
1991-2002: The NDP's fall and the Liberals' success
.png.webp)
By the time the 1993 election campaign started, the NDP was also very unpopular.[19] Liberal candidate Ivan Grose did win, but the Liberals' vote share didn't go up much. This was the same election that the Liberals nearly swept Ontario.[18][20] In 1996, the riding was once again modified. It would lose the part of the riding east of Harmony Road and north of King Street (former Highway 2), but it would gain the area west of Ritson Road between Rossland Road and Taunton Road.[13] The 1993 result for each party did not vary more than 1.2% when redistributed to the new area of the riding.[18][21]
In 1997, the PCs and the NDP rebounded slightly et the expense of the Liberals and the Reform Party and Grose was re-elected by a slightly smaller margin.[21] In 2000, the Liberals increased their vote share and their margin of victory by about 5%, mostly at the expense of the NDP.[21]
In 2003, the riding was expanded. Initially, the district would consist of the area of Oshawa south of Rossland Road as well as the area east of Ritson Road south of Taunton Road.[22] However, area MP Judy Longfield objected, by which point the proposed boundaries had changed to south of Rossland and south of Taunton west of Ritson. Longfield proposed, citing support from MP Ivan Grose and Oshawa City Council, that the district be changed from the previous version to not include the area west of Simcoe Street north of Rossland Road and the Oshawa Creek north of former Highway 2, but include the area east of Sincoe Street up to Winchester Road. A new Whitby—Oshawa riding would cover the rest of Oshawa. This proposal ended up being implemented.[23][24] The redistributed result showed minimal change.[21][25]
2004-2011: The Conservatives take the riding
.png.webp)
In 2004, there was some infighting in the Liberal Party. Grose ended up losing the Liberal nomination for that year's election. It was instead won by Louise Parks. The NDP nominated Sid Ryan, a well-known labour leader.[5] That year's election ended up being very close. Sid Ryan was within 500 votes of Conservative candidate Colin Carrie. Liberal candidate Louise Parks was within 1400 votes of Carrie.[26] In the 2006 election, Parks, Ryan, and Carrie ran again. During the 2006 campaign, a writer for The Globe and Mail considered it to be a riding to watch.[27] The NDP increased their share of the vote, but the Conservatives increased their vote share even more. These gains were at the expense of the Liberals, likely due to the recent layoffs at the General Motors Oshawa plant.[26][27][28]
The Conservatives would once again increase their vote percentage in the 2008 election and by a higher amount than the NDP, at the expense of the Liberals. The Conservatives now had 41% of the vote, compared to the NDP's 34%.[28][29] In 2011, a writer for the Toronto Star said that the increasing margins of victory for the Conservative Party over the NDP reflected the transformation of Oshawa from a working-class centre of the auto industry to another Toronto suburb.[5] In the run-up to that year's election, a writer for the National Post considered it to be a potential NDP pickup. The NDP had nominated another union leader, Chris Buckley, president of a local branch of the Canadian Auto Workers union.[30] Despite the NDP's rise nationally, the Conservatives still increased their vote share more than them, now having a majority of the vote in the riding.[29][31]
2012-present: Nearly being split and continued Tory success
During the 2012 redistribution, the riding was originally going to be split into 2 ridings. South of former Highway 2, it would be part of a new riding called "Oshawa—Bowmanville" and the part north of former Highway 2 would be part of the riding of "Oshawa—Durham."[32] During the public hearings, there was opposition to the new boundaries and the commission ended up revising the boundaries to consist of the area of Oshawa south of Taunton Road, despite the fact that the population of the district was now almost 20% above the provincial quota.[33] MPs Erin O'Toole and Colin Carrie later objected, requesting that as much of Oshawa as possible be kept within one electoral district, adding 2 campuses. The commission rejected this.[34][35]
In the 2015 election, despite the large gains by the Liberals under Justin Trudeau, who now had 27% of the vote in the riding, Carrie was re-elected with 38% of the vote. The NDP did fall, but not as much as the Conservatives to 31%.[36] Shortly after the election, Carrie was appointed to be the Conservatives' Deputy Health Critic.[37] In April 2016, Carrie was promoted to Health Critic.[38] By the 2019 election, Carrie had become the Shadow Cabinet Secretary for Canada-US relations and Economic Development in Southern Ontario.[39]
In April 2019, Forum Research conducted a poll in the riding showing a larger Conservative lead and a large NDP decline.[9] In the 2019 election, Carrie was re-elected again, increasing his vote share slightly while the Liberal and NDP candidates lost 2-4% of the vote each.[40][41] After the election, Carrie retained his previously held critic roles.[42]
Members of Parliament
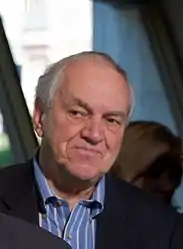
_(cropped).jpg.webp)
This riding has elected the following Members of Parliament:
| Parliament | Years | Member | Party | |
|---|---|---|---|---|
| Oshawa—Whitby Riding created from Ontario |
||||
| 28th | 1968–1972 | Ed Broadbent | New Democratic | |
| 29th | 1972–1974 | |||
| 30th | 1974–1979 | |||
| Oshawa | ||||
| 31st | 1979–1980 | Ed Broadbent | New Democratic | |
| 32nd | 1980–1984 | |||
| 33rd | 1984–1988 | |||
| 34th | 1988–1990 | |||
| 1990–1993 | Michael Breaugh | |||
| 35th | 1993–1997 | Ivan Grose | Liberal | |
| 36th | 1997–2000 | |||
| 37th | 2000–2004 | |||
| 38th | 2004–2006 | Colin Carrie | Conservative | |
| 39th | 2006–2008 | |||
| 40th | 2008–2011 | |||
| 41st | 2011–2015 | |||
| 42nd | 2015–2019 | |||
| 43rd | 2019–present | |||
Election results
| 2019 Canadian federal election | ||||||||
|---|---|---|---|---|---|---|---|---|
| Party | Candidate | Votes | % | ±% | Expenditures | |||
| Conservative | Colin Carrie | 24,087 | 38.9 | $111,106.65 | ||||
| New Democratic | Shailene Panylo | 17,668 | 28.5 | $19,350.32 | ||||
| Liberal | Afroza Hossain | 15,750 | 25.4 | $17,557.03 | ||||
| Green | Jovannah Ramsden | 3,151 | 5.1 | none listed | ||||
| People's | Eric Mackenzie | 1,215 | 2.0 | none listed | ||||
| Communist | Jeff Tomlinson | 112 | 0.2 | none listed | ||||
| Total valid votes/Expense limit | 61,983 | 100.0 | ||||||
| Total rejected ballots | 414 | |||||||
| Turnout | 62,397 | 61.5 | ||||||
| Eligible voters | 101,419 | |||||||
| Source: Elections Canada[43][41] | ||||||||
| 2015 Canadian federal election | ||||||||
|---|---|---|---|---|---|---|---|---|
| Party | Candidate | Votes | % | ±% | Expenditures | |||
| Conservative | Colin Carrie | 23,162 | 38.17 | -12.96 | $119,096.25 | |||
| New Democratic | Mary Fowler | 19,339 | 31.87 | -5.23 | $124,250.16 | |||
| Liberal | Tito-Dante Marimpietri | 16,588 | 27.33 | +19.67 | $26,849.94 | |||
| Green | Michael Dempsey | 1,522 | 2.51 | -1.04 | $10.22 | |||
| Marxist–Leninist | David Gershuny | 75 | 0.12 | – | – | |||
| Total valid votes/Expense limit | 60,686 | 100.00 | $240,095.10 | |||||
| Total rejected ballots | 228 | 0.37 | – | |||||
| Turnout | 60,914 | 63.74 | – | |||||
| Eligible voters | 95,561 | |||||||
| Conservative hold | Swing | -3.86 | ||||||
| Source: Elections Canada[40][44] | ||||||||
| 2011 federal election redistributed results[45] | |||
|---|---|---|---|
| Party | Vote | % | |
| Conservative | 26,837 | 51.13 | |
| New Democratic | 19,474 | 37.10 | |
| Liberal | 4,022 | 7.66 | |
| Green | 1,863 | 3.55 | |
| Others | 294 | 0.56 | |
| 2011 Canadian federal election | ||||||||
|---|---|---|---|---|---|---|---|---|
| Party | Candidate | Votes | % | ±% | Expenditures | |||
| Conservative | Colin Carrie | 26,034 | 51.31 | +9.95 | ||||
| New Democratic | Chris Buckley | 19,212 | 37.87 | +3.15 | ||||
| Liberal | James Morton | 3,536 | 6.97 | -9.07 | ||||
| Green | Gail Bates | 1,631 | 3.21 | -3.78 | ||||
| Libertarian | Matthew Belanger | 260 | 0.51 | – | ||||
| Marxist–Leninist | David Gershuny | 61 | 0.12 | -0.12 | ||||
| Total valid votes/Expense limit | 50,734 | 100.00 | ||||||
| Total rejected ballots | 200 | 0.39 | 0.00 | |||||
| Turnout | 50,934 | 57.31 | +2.06 | |||||
| Eligible voters | 88,878 | – | – | |||||
| 2008 Canadian federal election | ||||||||
|---|---|---|---|---|---|---|---|---|
| Party | Candidate | Votes | % | ±% | Expenditures | |||
| Conservative | Colin Carrie | 19.951 | 41.36 | +2.76 | $83,665 | |||
| New Democratic | Mike Shields | 16,750 | 34.72 | +1.26 | $66,814 | |||
| Liberal | Sean Godfrey | 7,741 | 16.04 | -7.94 | $62,601 | |||
| Green | Pat Gostlin | 3,374 | 6.99 | +3.22 | $9,606 | |||
| Christian Heritage | Peter Vogel | 246 | 0.51 | – | $2,149 | |||
| Marxist–Leninist | David Gershuny | 117 | 0.24 | -0.07 | ||||
| Canadian Action | Alex Kreider | 52 | 0.10 | – | ||||
| Total valid votes/Expense limit | 48,231 | 100.00 | $89,927 | |||||
| Total rejected ballots | 191 | 0.39 | +0.04 | |||||
| Turnout | 48,422 | 55.25 | -8.62 | |||||
| Conservative hold | Swing | +0.75 | ||||||
| 2006 Canadian federal election | ||||||||
|---|---|---|---|---|---|---|---|---|
| Party | Candidate | Votes | % | ±% | ||||
| Conservative | Colin Carrie | 20,657 | 38.60 | +5.39 | ||||
| New Democratic | Sid Ryan | 17,905 | 33.46 | +1.23 | ||||
| Liberal | Louise V. Parkes | 12,831 | 23.98 | -6.49 | ||||
| Green | Adam Jobse | 2,019 | 3.77 | -0.11 | ||||
| Marxist–Leninist | David Gershuny | 91 | 0.17 | -0.02 | ||||
| Total valid votes | 53,503 | 100.00 | ||||||
| Total rejected ballots | 186 | 0.35 | -0.25 | |||||
| Turnout | 53,689 | 63.87 | +6.67 | |||||
| 2004 Canadian federal election | ||||||||
|---|---|---|---|---|---|---|---|---|
| Party | Candidate | Votes | % | ±% | ||||
| Conservative | Colin Carrie | 15,815 | 33.21 | -10.7 | ||||
| New Democratic | Sid Ryan | 15,352 | 32.23 | +21.1 | ||||
| Liberal | Louise V. Parkes | 14,510 | 30.47 | -12.4 | ||||
| Green | Liisa Walley | 1,850 | 3.88 | |||||
| Marxist–Leninist | Tim Sullivan | 91 | 0.19 | -0.1 | ||||
| Total valid votes | 47,618 | 100.0 | ||||||
| Total rejected ballots | 287 | 0.60 | ||||||
| Turnout | 47,905 | 57.20 | ||||||
Note: Conservative vote is compared to the total of the Canadian Alliance vote and Progressive Conservative vote in 2000 election.
| 2000 Canadian federal election | ||||||||
|---|---|---|---|---|---|---|---|---|
| Party | Candidate | Votes | % | ±% | ||||
| Liberal | Ivan Grose | 16,179 | 42.9 | +5.2 | ||||
| Alliance | Barry Bussey | 10,863 | 28.8 | +0.5 | ||||
| Progressive Conservative | Bruce L. Wright | 5,675 | 15.1 | -1.5 | ||||
| New Democratic | Bruce Rogers | 4,203 | 11.1 | -6.3 | ||||
| Marijuana | Craig James Michael McMillan | 679 | 1.8 | |||||
| Marxist–Leninist | David Gershuny | 97 | 0.3 | |||||
| Total valid votes | 37,696 | 100.0 | ||||||
Note: Canadian Alliance vote is compared to the Reform vote in 1997 election.
| 1997 Canadian federal election | ||||||||
|---|---|---|---|---|---|---|---|---|
| Party | Candidate | Votes | % | ±% | ||||
| Liberal | Ivan Grose | 15,925 | 37.7 | -0.5 | ||||
| Reform | Andrew Davies | 11,974 | 28.4 | -0.5 | ||||
| New Democratic | Brian Nicholson | 7,350 | 17.4 | +2.5 | ||||
| Progressive Conservative | Alan Hayes | 6,972 | 16.5 | +1.4 | ||||
| Total valid votes | 42,221 | 100.0 | ||||||
| 1993 Canadian federal election | ||||||||
|---|---|---|---|---|---|---|---|---|
| Party | Candidate | Votes | % | ±% | ||||
| Liberal | Ivan Grose | 15,574 | 38.3 | +3.9 | ||||
| Reform | Andrew Davies | 11,760 | 28.9 | |||||
| Progressive Conservative | Linda Dionne | 6,137 | 15.1 | +6.4 | ||||
| New Democratic | Michael Breaugh | 6,066 | 14.9 | -32.7 | ||||
| National | John Arkelian | 387 | 1.0 | |||||
| Christian Heritage | Brian Chiasson | 383 | 0.9 | -4.2 | ||||
| Natural Law | Helene Ann Darisse | 260 | 0.6 | |||||
| Commonwealth of Canada | Ann-Marie Methot | 73 | 0.2 | |||||
| Abolitionist | Christopher Boddy | 60 | 0.1 | |||||
| Total valid votes | 40,700 | 100.0 | ||||||
| Canadian federal by-election, 13 August 1990 | ||||||||
|---|---|---|---|---|---|---|---|---|
| Party | Candidate | Votes | % | ±% | ||||
| On Ed Broadbent's resignation, 2 January 1990 | ||||||||
| New Democratic | Michael Breaugh | 12,046 | 47.6 | +3.3 | ||||
| Liberal | Cathy O'Flynn | 8,709 | 34.4 | +13.9 | ||||
| Progressive Conservative | Bill Longworth | 1,627 | 6.4 | -27.4 | ||||
| Christian Heritage | Gerry Van Schepen | 1,308 | 5.2 | |||||
| Confederation of Regions | Garnet Chesebrough | 1,024 | 4.0 | |||||
| Green | David A.J. Hubbell | 243 | 1.0 | |||||
| Libertarian | George Dance | 117 | 0.5 | -0.6 | ||||
| Social Credit | Ken Campbell | 96 | 0.4 | |||||
| Independent | Robert Bob Kirk | 94 | 0.4 | |||||
| Independent | John Turmel | 50 | 0.2 | |||||
| Total valid votes | 25,314 | 100.0 | ||||||
| 1988 Canadian federal election | ||||||||
|---|---|---|---|---|---|---|---|---|
| Party | Candidate | Votes | % | ±% | ||||
| New Democratic | Ed Broadbent | 18,410 | 44.3 | +2.0 | ||||
| Progressive Conservative | Nancy McLean | 14,040 | 33.8 | -5.0 | ||||
| Liberal | Ed White | 8,496 | 20.5 | +2.4 | ||||
| Libertarian | George S. Kozaroff | 449 | 1.1 | +0.5 | ||||
| Commonwealth of Canada | Lucylle Boikoff | 139 | 0.3 | +0.2 | ||||
| Total valid votes | 41,534 | 100.0 | ||||||
| 1984 Canadian federal election | ||||||||
|---|---|---|---|---|---|---|---|---|
| Party | Candidate | Votes | % | ±% | ||||
| New Democratic | Ed Broadbent | 25,092 | 42.3 | -9.3 | ||||
| Progressive Conservative | Alex Sosna | 23,028 | 38.8 | +10.6 | ||||
| Liberal | Terry Kelly | 10,719 | 18.1 | -1.5 | ||||
| Libertarian | Rolf Posma | 335 | 0.6 | +0.2 | ||||
| Commonwealth of Canada | Lucille Boikoff | 74 | 0.1 | |||||
| Communist | Russell Z. Rak | 72 | 0.1 | 0.0 | ||||
| Total valid votes | 59,320 | 100.0 | ||||||
| 1980 Canadian federal election | ||||||||
|---|---|---|---|---|---|---|---|---|
| Party | Candidate | Votes | % | ±% | ||||
| New Democratic | Ed Broadbent | 26,761 | 51.6 | +0.4 | ||||
| Progressive Conservative | Jim Souch | 14,645 | 28.3 | -4.1 | ||||
| Liberal | Elizabeth Gomes | 10,129 | 19.5 | +3.5 | ||||
| Libertarian | Dolores Keys | 178 | 0.3 | |||||
| Communist | Russell Rak | 81 | 0.2 | 0.0 | ||||
| Marxist–Leninist | Steve Rutchinski | 29 | 0.1 | 0.0 | ||||
| Total valid votes | 51,823 | 100.0 | ||||||
| 1979 Canadian federal election | ||||||||
|---|---|---|---|---|---|---|---|---|
| Party | Candidate | Votes | % | ±% | ||||
| New Democratic | Ed Broadbent | 29,090 | 51.3 | +2.6 | ||||
| Progressive Conservative | Jim Souch | 18,369 | 32.4 | +10.2 | ||||
| Liberal | Elizabeth Gomes | 9,099 | 16.0 | -12.7 | ||||
| Communist | Russ Rak | 80 | 0.1 | -0.1 | ||||
| Marxist–Leninist | Bill Aird | 62 | 0.1 | 0.0 | ||||
| Independent | Richard Sanders | 47 | 0.1 | |||||
| Total valid votes | 56,747 | 100.0 | ||||||
Oshawa—Whitby, 1967-1976
| 1974 Canadian federal election | ||||||||
|---|---|---|---|---|---|---|---|---|
| Party | Candidate | Votes | % | ±% | ||||
| New Democratic | Ed Broadbent | 25,013 | 48.7 | +6.8 | ||||
| Liberal | Margaret Shaw | 14,783 | 28.8 | +11.1 | ||||
| Progressive Conservative | Martin Weatherall | 11,412 | 22.2 | -18.2 | ||||
| Communist | Russell Rak | 125 | 0.2 | 0.0 | ||||
| Marxist–Leninist | Dennis Deveau | 66 | 0.1 | |||||
| Total valid votes | 51,399 | 100.0 | ||||||
| 1972 Canadian federal election | ||||||||
|---|---|---|---|---|---|---|---|---|
| Party | Candidate | Votes | % | ±% | ||||
| New Democratic | Ed Broadbent | 23,757 | 41.8 | +8.2 | ||||
| Progressive Conservative | Michael Starr | 22,933 | 40.4 | +6.8 | ||||
| Liberal | Peter Connolly | 10,027 | 17.6 | -15.2 | ||||
| Independent | Russell Rak | 98 | 0.2 | |||||
| Total valid votes | 56,815 | 100.0 | ||||||
| 1968 Canadian federal election | ||||||||
|---|---|---|---|---|---|---|---|---|
| Party | Candidate | Votes | % | |||||
| New Democratic | Ed Broadbent | 15,224 | 33.6 | |||||
| Progressive Conservative | Michael Starr | 15,209 | 33.6 | |||||
| Liberal | Desmond G. Newman | 14,899 | 32.9 | |||||
| Total valid votes | 45,332 | 100.0 | ||||||
References
- "(Code 35061) Census Profile". 2011 census. Statistics Canada. 2012. Retrieved 3 March 2011.
- 1966-67 Riding history from the Library of Parliament
- 1976-2008 Riding history from the Library of Parliament
- 2011 results from Elections Canada
- Campaign expense data from Elections Canada
Notes
- Statistics Canada (2016). "Census Profile, 2016 Census". statcan.gc.ca. Retrieved 3 June 2020.
- "Oshawa". elections.ca. Elections Canada. Retrieved 5 June 2020.
- Statistics Canada (2011). "NHS Profile: Oshawa, Ontario". statcan.gc.ca. Archived from the original on 5 June 2020. Retrieved 5 June 2020.
- Statistics Canada (2011). "NHS Profile: Ontario". statcan.gc.ca. Retrieved 6 June 2020.
- Kennedy, Brendan (10 April 2011). "Oshawa: NDP trying to win back former stronghold". Toronto Star. Torstar. Archived from the original on 15 May 2020. Retrieved 14 May 2020.
-
- "Ontario, Ontario (1925-09-05 - 1997-04-26)". lop.parl.ca. Library of Parliament. Archived from the original on 12 May 2020. Retrieved 12 May 2020.
- "Oshawa, Ontario ( - )". lop.parl.ca. Library of Parliament. Archived from the original on 12 May 2020. Retrieved 12 May 2020.
- "Oshawa--Whitby, Ontario (1967-11-06 - 1979-03-25)". lob.parl.ca. Library of Parliament. Archived from the original on 12 May 2020. Retrieved 12 May 2020.
- "Elections and Candidates". lop.parl.ca. Library of Parliament. Archived from the original on 20 December 2019. Retrieved 12 May 2020.
- "FEATURE: The riding of Oshawa". The Oshawa Express. Dowellman Publishing Corp. 2 May 2019. Archived from the original on 12 May 2020. Retrieved 12 May 2020.
- "The Third Man". Maclean's. 23 April 1979. pp. 30–31. Retrieved 12 May 2020.
- The Canadian Press (18 July 1974). "Hopes for new life in NDP" (PDF). The Sherbooke Record. p. 1. Archived from the original (PDF) on 12 May 2020. Retrieved 12 May 2020.
- CBC Archives (4 March 2019). "When Ed Broadbent Stepped Down as NDP Leader". Retrieved 12 May 2020.
- "Oshawa, Ontario (1979-03-26 - )". lop.parl.ca. Library of Parliament. Archived from the original on 12 May 2020. Retrieved 12 May 2020.
- Wong, Jan (17 November 2009). "Ed Broadbent, 2005". The Globe and Mail. Archived from the original on 13 May 2020. Retrieved 13 May 2020.
- "An Oshawa legend gets his due". Oshawa Express. Dowellman Publishing Corp. 8 October 2019. Archived from the original on 13 May 2020. Retrieved 13 May 2020.
- "The Hon. John Edward Broadbent, P.C., C.C., M.P." lop.parl.ca. Library of Parliament. Archived from the original on 14 December 2019. Retrieved 13 May 2020.
- Laver, Ross (7 May 1990). "A COMEBACK PLAN". Maclean's. Archived from the original on 13 May 2020. Retrieved 13 May 2020.
- "Oshawa, ON (1987 Rep. Order)". Pundit's Guide to Canadian Elections. Archived from the original on 21 October 2015. Retrieved 13 May 2020.
- "Ready, Set, Go!". Maclean's. 13 September 1993. p. 20. Retrieved 13 May 2020.
- Natural Resources Canada (26 October 1993). Results of the 35th Federal Election (PDF) (Map). 1:7,500,000. Cartography by Surveys, Mapping, and Remote Sensing Sector. Archived (PDF) from the original on 5 August 2017. Retrieved 13 May 2020.
- "Oshawa, ON (1996 Rep. Order)". Pundit's Guide to Canadian Elections. Archived from the original on 8 September 2015. Retrieved 13 May 2020.
- "Oshawa". elections.ca. Elections Canada. 2003. Archived from the original on 2 July 2003. Retrieved 6 June 2020.
- "OBJECTIONS FILED BY MEMBERS OF THE HOUSE OF COMMONS" (PDF). elections.ca. Elections Canada. 2003. pp. 23–24. Archived from the original (PDF) on 31 August 2003. Retrieved 6 June 2020.
- "Whitby--Oshawa, Ontario (2004-05-23 - 2015-08-01)". lop.parl.ca. Library of Parliament. Archived from the original on 14 May 2020. Retrieved 14 May 2020.
- "Oshawa, ON (2003 Rep. Order)". Pundit's Guide to Canadian Elections. Archived from the original on 8 September 2015. Retrieved 14 May 2020.
- "Official Results of the 38th General Election: Oshawa". elections.ca. Elections Canada. 2004. Archived from the original on 9 February 2005. Retrieved 15 May 2020.
- Lorinc, John (3 December 2006). "10 RIDINGS TO WATCH". The Globe and Mail. Archived from the original on 15 May 2020. Retrieved 14 May 2020.
- "Official Results of the 39th Canadian General Election: Oshawa". elections.ca. Elections Canada. 2006. Archived from the original on 15 May 2020. Retrieved 15 May 2020.
- "Official Results of the 40th General Election: Oshawa". elections.ca. Elections Canada. 2008. Archived from the original on 31 July 2020. Retrieved 15 May 2020.
- Carlson, Kathryn Blaze (26 April 2011). "Road map to a potential NDP breakthrough". National Post. Postmedia. Retrieved 15 May 2020.
- "Results of the 41st General Election: Oshawa". elections.ca. Elections Canada. 2011. Archived from the original on 30 July 2020. Retrieved 15 May 2020.
- Ontario Electoral Redistribution Commission (2012). "Proposed Boundaries: Durham" (PDF). 2012 federal electoral redistribution. Archived (PDF) from the original on 11 December 2017. Retrieved 12 May 2020.
- Ontario federal electoral boundaries commission. "Initial Report". 2012 federal electoral redistribution. Retrieved 10 September 2020.
- Ontario Electoral Redistribution Commission (31 July 2013). "Part II – Amendments to the Initial Report– Ontario – Objections". 2012 federal electoral redistribution. Archived from the original on 11 December 2017. Retrieved 12 May 2020.
- Ontario Electoral Redistribution Commission (2013). "Final Boundaries: Oshawa" (PDF). 2012 federal electoral redistribution. Archived (PDF) from the original on 11 December 2017. Retrieved 12 May 2020.
- Oshawa This Week (19 October 2015). "Oshawa returns Colin Carrie: 2015 federal election results". DurhamRegion.com. Torstar. Metroland Media. Archived from the original on 27 November 2015. Retrieved 15 May 2020.
- Wittnebel, Joel (24 November 2015). "O'Toole, Carrie named to shadow cabinet". The Oshawa Express. Dowellman Publishing Corp. Archived from the original on 2 March 2017. Retrieved 15 May 2020.
- Dickson, Janice (8 April 2016). "Ambrose shakes up shadow cabinet, adds role for 'sharing economy'". iPolitics. Archived from the original on 6 May 2016. Retrieved 15 May 2020.
- "Colin Carrie | Vote 2019". DurhamRegion.com. Torstar. Metroland Media. 20 October 2019. Archived from the original on 3 June 2020. Retrieved 3 June 2020.
- Elections Canada – Confirmed candidates for Oshawa, 30 September 2015
- "FORTY-THIRD GENERAL ELECTION 2019 — Poll-by-poll results (Oshawa)". elections.ca. Elections Canada. April 2020. Retrieved 3 June 2020.
- Lim, Jolson (29 November 2019). "Tories release list of 'shadow cabinet' members". iPolitics. Archived from the original on 21 January 2020. Retrieved 15 May 2020.
- "List of confirmed candidates". Elections Canada. Retrieved 3 October 2019.
- Elections Canada – Preliminary Election Expenses Limits for Candidates
- "Oshawa, ON (2013 Rep. Order)". Pundit's Guide to Canadian Elections. Archived from the original on 21 October 2015. Retrieved 12 May 2020.