2016 United States presidential election in Connecticut
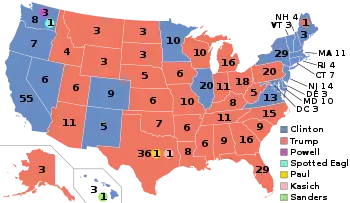
The 2016 United States presidential election in Connecticut was held on Tuesday, November 8, 2016, as part of the 2016 United States presidential election in which all 50 states plus the District of Columbia participated. Connecticut voters chose electors to represent them in the Electoral College via a popular vote, pitting the Republican Party's nominee, businessman Donald Trump, and running mate Indiana Governor Mike Pence against Democratic Party nominee, former Secretary of State Hillary Clinton, and her running mate Virginia Senator Tim Kaine. Connecticut has seven electoral votes in the Electoral College.[1]
| ||||||||||||||||||||||||||
| Turnout | 76.94% | |||||||||||||||||||||||||
|---|---|---|---|---|---|---|---|---|---|---|---|---|---|---|---|---|---|---|---|---|---|---|---|---|---|---|
| ||||||||||||||||||||||||||
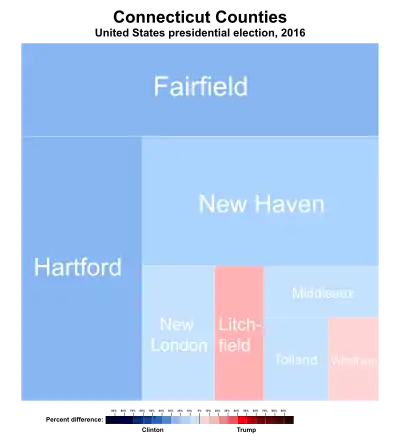
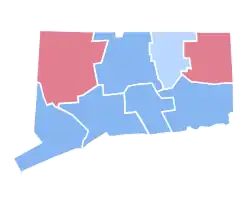 County Results
| ||||||||||||||||||||||||||
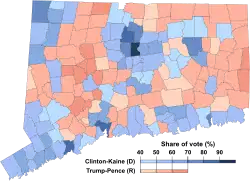 Municipal Results | ||||||||||||||||||||||||||
| ||||||||||||||||||||||||||
.jpg.webp)
| Elections in Connecticut |
|---|
 |
Clinton won the state with 54.5% of the vote, a reduced margin from Barack Obama's 58.06% in 2012. Conversely, Trump received 40.9% of the vote.[2] Clinton carried six of the state's eight counties; however, this was the first time a Republican had won Windham County since George H. W. Bush in 1988.
Primary elections results
Democratic primary
Three candidates appeared on the Democratic presidential primary ballot:[3]
Opinion polling
Results
| Candidate | Popular vote | Estimated delegates | |||
|---|---|---|---|---|---|
| Count | Percentage | Pledged | Unpledged | Total | |
| Hillary Clinton | 170,045 | 51.80% | 28 | 15 | 43 |
| Bernie Sanders | 152,379 | 46.42% | 27 | 0 | 27 |
| Roque "Rocky" De La Fuente | 960 | 0.29% | 0 | 0 | 0 |
| Uncommitted | 4,871 | 1.48% | 0 | 1 | 1 |
| Total | 328,255 | 100% | 55 | 16 | 71 |
| Source: The Green Papers, Connecticut Secretary of State - Official Primary Results | |||||
Republican primary
Four candidates appeared on the Republican presidential primary ballot:[3]
- Ben Carson (withdrawn)
- Ted Cruz
- John Kasich
- Donald Trump
Opinion polling
Results
| Connecticut Republican primary, April 26, 2016 | |||||
|---|---|---|---|---|---|
| Candidate | Votes | Percentage | Actual delegate count | ||
| Bound | Unbound | Total | |||
| Donald Trump | 123,523 | 57.86% | 28 | 0 | 28 |
| John Kasich | 60,522 | 28.35% | 0 | 0 | 0 |
| Ted Cruz | 24,987 | 11.70% | 0 | 0 | 0 |
| Uncommitted | 2,728 | 1.28% | 0 | 0 | 0 |
| Ben Carson (withdrawn) | 1,733 | 0.81% | 0 | 0 | 0 |
| Unprojected delegates: | 0 | 0 | 0 | ||
| Total: | 213,493 | 100.00% | 28 | 0 | 28 |
| Source: The Green Papers | |||||
Polling
Clinton won every pre-election poll conducted. An average of the final 3 polls showed Clinton leading 49% to 38%, and the final poll showed Clinton leading Trump 50% to 35%. [4]
General election
Trump's strongest county in the state was rural Litchfield County, while Clinton's biggest win was in adjacent, more urban Hartford County. [5] Areas that swung in Clinton's favor were mainly concentrated in suburban Fairfield County, in towns like Darien, New Canaan, and Westport.[6] [7]This area is home to many New York City commuters. Other Democratic swings were in suburbs outside Hartford, such as Granby, East Granby, and Glastonbury, as well as outside New Haven.[8][9]
Statewide results
| Party | Candidate | Votes | % | |
|---|---|---|---|---|
| Democratic | Hillary Clinton | 897,572 | 54.57% | |
| Republican | Donald Trump | 673,215 | 40.93% | |
| Libertarian | Gary Johnson | 48,676 | 2.96% | |
| Green | Jill Stein | 22,841 | 1.39% | |
| Independent | Evan McMullin (write-in) | 2,108 | 0.13% | |
| Write-in | 361 | 0.02% | ||
| Constitution | Darrell Castle (write-in) | 147 | 0.01% | |
| Total votes | 1,644,920 | 100.00% | ||
Results by county
| Candidate | Clinton | Trump | Johnson | Stein | Write-in | Total | |||||
|---|---|---|---|---|---|---|---|---|---|---|---|
| County | Votes | % | Votes | % | Votes | % | Votes | % | Votes | % | |
| Tolland | 38,506 | 49.73% | 34,194 | 44.16% | 3,181 | 4.11% | 1,370 | 1.77% | 173 | 0.23% | 77,424 |
| New Haven | 205,609 | 54.25% | 159,048 | 41.96% | 9,119 | 2.41% | 4,757 | 1.26% | 473 | 0.13% | 379,006 |
| Fairfield | 243,852 | 57.89% | 160,077 | 38.00% | 11,691 | 2.78% | 4,866 | 1.16% | 723 | 0.18% | 421,209 |
| Windham | 21,792 | 42.88% | 25,747 | 50.66% | 2,180 | 4.29% | 1,010 | 1.99% | 94 | 0.18% | 50,823 |
| Hartford | 240,403 | 59.09% | 148,173 | 36.42% | 11,997 | 2.95% | 5,680 | 1.40% | 611 | 0.15% | 406,864 |
| Litchfield | 39,775 | 40.82% | 53,051 | 54.44% | 3,004 | 3.08% | 1,441 | 1.48% | 171 | 0.17% | 97,442 |
| New London | 62,278 | 50.42% | 54,058 | 43.76% | 4,744 | 3.84% | 2,220 | 1.80% | 228 | 0.19% | 123,528 |
| Middlesex | 45,357 | 51.18% | 38,867 | 43.86% | 2,760 | 3.11% | 1,497 | 1.69% | 143 | 0.16% | 88,624 |
Turnout
According to the Connecticut's Secretary of State Elections Night Reporting website, voter turnout was 76.94% with 1,675,934 voters checked reported out of 2,178,169 Registered Voters Reported. [11]
See also
References
- "Distribution of Electoral Votes". National Archives and Records Administration. Retrieved November 23, 2020.
- "Connecticut Election Results 2016 – The New York Times". Retrieved November 10, 2016.
- "Secretary Merrill Selects Presidential Primary Ballot Order" (PDF). Secretary of the State of Connecticut. March 22, 2016. Archived from the original (PDF) on August 6, 2016. Retrieved May 21, 2016.
- https://www.realclearpolitics.com/epolls/2016/president/ct/connecticut_trump_vs_clinton-5720.html
- https://authoring.ct.gov/-/media/SOTS/ElectionServices/StatementOfVote_PDFs/2016StatementofVotepdf.pdf
- https://authoring.ct.gov/-/media/SOTS/ElectionServices/StatementOfVote_PDFs/2012StatementofVoteBookpdf.pdf
- https://authoring.ct.gov/-/media/SOTS/ElectionServices/StatementOfVote_PDFs/2016StatementofVotepdf.pdf
- https://authoring.ct.gov/-/media/SOTS/ElectionServices/StatementOfVote_PDFs/2012StatementofVoteBookpdf.pdf
- https://authoring.ct.gov/-/media/SOTS/ElectionServices/StatementOfVote_PDFs/2016StatementofVotepdf.pdf
- Bump, Philip. "The counties that flipped parties to swing the 2016 election". Washington Post. ISSN 0190-8286. Retrieved 2020-09-01.
- https://ctemspublic.pcctg.net/#/home Last edited 2020-07-9 Retrieved 2020-07-09