Etobicoke—Lakeshore
Etobicoke—Lakeshore (formerly known as Lakeshore and Toronto—Lakeshore) is a federal electoral district in Ontario, Canada, that has been represented in the House of Commons of Canada since 1968.
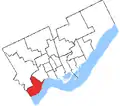
.png.webp) Etobicoke—Lakeshore in relation to other electoral districts in Toronto (2015 boundaries) | |||
| Federal electoral district | |||
| Legislature | House of Commons | ||
| MP |
Liberal | ||
| District created | 1976 | ||
| First contested | 1979 | ||
| Last contested | 2019 | ||
| District webpage | profile, map | ||
| Demographics | |||
| Population (2016)[1] | 129,081 | ||
| Electors (2015) | 90,167 | ||
| Area (km²)[2] | 53 | ||
| Pop. density (per km²) | 2,435.5 | ||
| Census division(s) | Toronto | ||
| Census subdivision(s) | Toronto | ||
.gif)
It covers the southern part of the Etobicoke portion of Toronto on the shore of Lake Ontario including the former 'Lakeshore Municipalities' of Mimico, New Toronto and Long Branch.
This riding has been a destination for Slavic immigrants. The percentage of native speakers of Slavic languages in this riding (primarily Polish, Ukrainian, Russian, Serbian, and Croatian) is 15.0%, the highest in Canada.[3]
Demographics
- According to the Canada 2011 Census
Ethnic groups: 75.3% White, 4.6% South Asian, 4.2% Black, 3.3% Filipino, 2.8% Chinese, 2.2% Latin American, 1.8% Korean, 1.3% Southeast Asian
Languages: 60.6% English, 5.5% Polish, 3.4% Ukrainian, 2.7% Italian, 2.3% Spanish, 2.2% Portuguese, 2.1% Russian, 2.1% Chinese, 2.0% French, 1.8% Tagalog, 1.7% Serbian, 1.5% Korean
Religions: 70.7% Christian (40.8% Catholic, 5.9% Christian Orthodox, 5.3% United Church, 4.8% Anglican, 1.9% Presbyterian, 1.2% Baptist), 3.7% Muslim, 1.7% Hindu, 1.1% Buddhist, 21.6 No religion
Median income (2005): $30,419
Geography
Consisting of that part of the City of Toronto described as follows: commencing at the intersection of the Humber River with Dundas Street West; thence southwesterly along said street to the Canadian Pacific Railway; thence southerly along said railway to Mimico Creek; thence generally westerly along said creek to Kipling Avenue; thence southerly along said avenue to Burnhamthorpe Road; thence westerly along said road to Highway 427; thence southerly along said highway to Dundas Street West; thence westerly along said street to the westerly limit of said city; thence generally southerly and northeasterly along the westerly and southerly limits of said city to the southeasterly production of the Humber River; thence generally northwesterly along said production and the Humber River to the point of commencement.
History
The riding was created in 1966 as "Lakeshore" from part of York—Humber, the same year the 'Lakeshore municipalities', Mimico, New Toronto, Long Branch were annexed to the new Borough of Etobicoke. In 1971, it was renamed "Toronto—Lakeshore". In 1976, it was abolished, and replaced by "Etobicoke—Lakeshore".
The riding was represented by federal Liberal Party and official Opposition leader Michael Ignatieff, who was first elected in 2006, until he was unseated in the 2011 General Election by Conservative Bernard Trottier. It was previously represented by Jean Augustine. Provincially, it has been represented by Peter Milczyn since 2014. On Toronto City Council, the southern half of the riding is represented by Mark Grimes, and the northern half by Justin Di Ciano.
In the 1988 federal election, there was no Liberal candidate on the ballot because two days after nominations were due, the Liberal candidate, Emmanuel Feuerwerker, withdrew citing heart problems after the news media reported that Mr. Feuerwerker's campaign literature claimed university degrees that he did not, in fact, possess.[4]
This riding lost territory to Etobicoke Centre during the 2012 electoral redistribution.
Former boundaries
 1966 to 1976
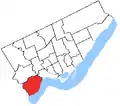 1976 to 1987
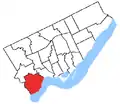 1987 to 1996
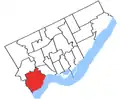 1996 to 2004
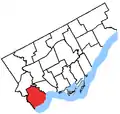 2004 to 2015
Members of Parliament
This riding has elected the following Members of Parliament:
| Parliament | Years | Member | Party | |
|---|---|---|---|---|
| Lakeshore Riding created from York—Humber |
||||
| 28th | 1968–1972 | Ken Robinson | Liberal | |
| Toronto—Lakeshore | ||||
| 29th | 1972–1974 | Terry Grier | New Democratic | |
| 30th | 1974–1979 | Ken Robinson | Liberal | |
| Etobicoke—Lakeshore | ||||
| 31st | 1979–1980 | Ken Robinson | Liberal | |
| 32nd | 1980–1984 | |||
| 33rd | 1984–1988 | Patrick Boyer | Progressive Conservative | |
| 34th | 1988–1993 | |||
| 35th | 1993–1997 | Jean Augustine | Liberal | |
| 36th | 1997–2000 | |||
| 37th | 2000–2004 | |||
| 38th | 2004–2006 | |||
| 39th | 2006–2008 | Michael Ignatieff | ||
| 40th | 2008–2011 | |||
| 41st | 2011–2015 | Bernard Trottier | Conservative | |
| 42nd | 2015–2019 | James Maloney | Liberal | |
| 43rd | 2019–present | |||
Election results
Etobicoke—Lakeshore
| 2019 Canadian federal election | ||||||||
|---|---|---|---|---|---|---|---|---|
| Party | Candidate | Votes | % | ±% | Expenditures | |||
| Liberal | James Maloney | 36,061 | 51.9 | -1.80 | $117,733.35 | |||
| Conservative | Barry O'Brien | 19,952 | 28.7 | -3.75 | $107,171.56 | |||
| New Democratic | Branko Gasperlin | 8,277 | 11.9 | +1.00 | $19,071.10 | |||
| Green | Chris Caldwell | 4,141 | 6.0 | +3.66 | none listed | |||
| People's | Jude Sulejmani | 921 | 1.3 | - | none listed | |||
| Marxist–Leninist | Janice Murray | 163 | 0.2 | -0.06 | $0.00 | |||
| Total valid votes/Expense limit | 69,515 | 100.0 | ||||||
| Total rejected ballots | 525 | |||||||
| Turnout | 70,040 | 68.0 | ||||||
| Eligible voters | 102,987 | |||||||
| Source: Elections Canada[5][6] | ||||||||
| 2015 Canadian federal election | ||||||||
|---|---|---|---|---|---|---|---|---|
| Party | Candidate | Votes | % | ±% | Expenditures | |||
| Liberal | James Maloney | 34,638 | 53.70 | +18.60 | $154,037.25 | |||
| Conservative | Bernard Trottier | 20,932 | 32.45 | -7.78 | $114,083.23 | |||
| New Democratic | Phil Trotter | 7,030 | 10.90 | -9.40 | $27,861.80 | |||
| Green | Angela Salewsky | 1,507 | 2.34 | -1.68 | $2,045.10 | |||
| Animal Alliance | Liz White | 233 | 0.36 | – | $4,975.83 | |||
| Marxist–Leninist | Janice Murray | 168 | 0.26 | -0.10 | – | |||
| Total valid votes/Expense limit | 64,508 | 100.00 | $233,887.62 | |||||
| Total rejected ballots | 307 | 0.47 | ||||||
| Turnout | 64,815 | 70.37 | ||||||
| Eligible voters | 92,100 | |||||||
| Liberal gain from Conservative | Swing | +13.19 | ||||||
| Source: Elections Canada[7][8] | ||||||||
| 2011 federal election redistributed results[9] | |||
|---|---|---|---|
| Party | Vote | % | |
| Conservative | 20,484 | 40.23 | |
| Liberal | 17,867 | 35.09 | |
| New Democratic | 10,336 | 20.30 | |
| Green | 2,046 | 4.02 | |
| Marxist-Leninist | 182 | 0.36 | |
| 2011 Canadian federal election | ||||||||
|---|---|---|---|---|---|---|---|---|
| Party | Candidate | Votes | % | ±% | Expenditures | |||
| Conservative | Bernard Trottier | 21,997 | 40.35 | +5.48 | $78,142.35 | |||
| Liberal | Michael Ignatieff | 19,128 | 35.08 | -11.05 | $68,176.10 | |||
| New Democratic | Michael Erickson | 11,046 | 20.26 | +8.60 | $19,716.93 | |||
| Green | David Corail | 2,159 | 3.96 | -3.02 | $6,090.24 | |||
| Marxist–Leninist | Janice Murray | 190 | 0.35 | – | – | |||
| Total valid votes/Expense limit | 54,520 | 100.00 | – | $91,715.45 | ||||
| Total rejected ballots | 243 | 0.44 | +0.02 | |||||
| Turnout | 54,763 | 64.02 | ||||||
| Eligible voters | 85,547 | – | – | |||||
| 2008 Canadian federal election | ||||||||
|---|---|---|---|---|---|---|---|---|
| Party | Candidate | Votes | % | ±% | Expenditures | |||
| Liberal | Michael Ignatieff | 23,536 | 46.13 | $65,816 | ||||
| Conservative | Patrick Boyer | 17,793 | 34.87 | $86,667 | ||||
| New Democratic | Liam McHugh-Russell | 5,950 | 11.66 | $20,386 | ||||
| Green | David Corail | 3,562 | 6.98 | $946 | ||||
| Marxist–Leninist | Janice Murray | 181 | 0.35 | |||||
| Total valid votes/Expense limit | 51,022 | 100.00 | $88,903 | |||||
| Total rejected ballots | 213 | 0.42 | ||||||
| Turnout | 51,235 | |||||||
| 2006 Canadian federal election | ||||||||
|---|---|---|---|---|---|---|---|---|
| Party | Candidate | Votes | % | ±% | ||||
| Liberal | Michael Ignatieff | 24,337 | 43.6 | |||||
| Conservative | John Capobianco | 19,613 | 35.2 | |||||
| New Democratic | Liam McHugh-Russell | 8,685 | 15.6 | |||||
| Green | Philip Ridge | 2,853 | 5.1 | |||||
| Communist | Cathy Holliday | 186 | 0.3 | |||||
| Marxist–Leninist | Janice Murray | 104 | 0.2 | |||||
| Total valid votes | 55,778 | 100.0 | ||||||
| 2004 Canadian federal election | ||||||||
|---|---|---|---|---|---|---|---|---|
| Party | Candidate | Votes | % | ±% | ||||
| Liberal | Jean Augustine | 24,909 | 50.2 | |||||
| Conservative | John Capobianco | 15,159 | 30.6 | |||||
| New Democratic | Margaret Anne McHugh | 7,179 | 14.4 | |||||
| Green | John Huculiak | 2,201 | 4.4 | |||||
| Marxist–Leninist | Janice Murray | 129 | 0.2 | 0.0 | ||||
| Total valid votes | 49,577 | 100.0 | ||||||
Note: Conservative vote is compared to the total of the Canadian Alliance vote and Progressive Conservative vote in 2000 election.
| 2000 Canadian federal election | ||||||||
|---|---|---|---|---|---|---|---|---|
| Party | Candidate | Votes | % | ±% | ||||
| Liberal | Jean Augustine | 22,467 | 51.8 | |||||
| Alliance | David Court | 9,160 | 21.1 | |||||
| Progressive Conservative | David Haslam | 8,453 | 19.5 | |||||
| New Democratic | Richard Joseph Banigan | 2,835 | 6.5 | |||||
| Natural Law | Don Jackson | 244 | 0.6 | |||||
| Marxist–Leninist | Janice Murray | 116 | 0.3 | 0.0 | ||||
| Communist | Ed Bil | 113 | 0.3 | |||||
| Total valid votes | 43,388 | 100.0 | ||||||
Note: Canadian Alliance vote is compared to the Reform vote in 1997 election.
| 1997 Canadian federal election | ||||||||
|---|---|---|---|---|---|---|---|---|
| Party | Candidate | Votes | % | ±% | ||||
| Liberal | Jean Augustine | 21,180 | 46.2 | +4.1 | ||||
| Progressive Conservative | Charles Donley | 10,509 | 22.9 | -8.0 | ||||
| Reform | Robert Beard | 8,697 | 19.0 | +0.2 | ||||
| New Democratic | Karen Ridley | 4,085 | 8.9 | +3.9 | ||||
| Canadian Action | Paul Hellyer | 770 | 1.7 | |||||
| Green | David Burman | 315 | 0.7 | |||||
| Natural Law | Geraldine Jackson | 139 | 0.3 | -0.3 | ||||
| Marxist–Leninist | Barbara Seed | 133 | 0.3 | +0.1 | ||||
| Total valid votes | 45,828 | 100.0 | ||||||
| 1993 Canadian federal election | ||||||||
|---|---|---|---|---|---|---|---|---|
| Party | Candidate | Votes | % | ±% | ||||
| Liberal | Jean Augustine | 19,458 | 42.1 | |||||
| Progressive Conservative | Patrick Boyer | 14,306 | 31.0 | -15.1 | ||||
| Reform | Ken Anstruther | 8,693 | 18.8 | |||||
| New Democratic | Karen Ridley | 2,316 | 5.0 | -39.2 | ||||
| National | Gilles Brunet | 861 | 1.9 | |||||
| Natural Law | Don Jackson | 283 | 0.6 | |||||
| Libertarian | Alan D'Orsay | 197 | 0.4 | -6.6 | ||||
| Marxist–Leninist | Julie Northrup | 78 | 0.2 | |||||
| Abolitionist | Michael McCabe | 2 | 0.0 | |||||
| Total valid votes | 46,194 | 100.0 | ||||||
| 1988 Canadian federal election | ||||||||
|---|---|---|---|---|---|---|---|---|
| Party | Candidate | Votes | % | ±% | ||||
| Progressive Conservative | Patrick Boyer | 20,405 | 46.0 | +1.3 | ||||
| New Democratic | Judy Brandow | 19,609 | 44.2 | +20.5 | ||||
| Libertarian | Daniel Hunt | 3,097 | 7.0 | +6.3 | ||||
| Green | Dan Freeman | 679 | 1.5 | |||||
| Independent | Françoise Roy | 393 | 0.9 | |||||
| Communist | Vicky Holloway | 141 | 0.3 | -0.2 | ||||
| Total valid votes | 44,324 | 100.0 | ||||||
| 1984 Canadian federal election | ||||||||
|---|---|---|---|---|---|---|---|---|
| Party | Candidate | Votes | % | ±% | ||||
| Progressive Conservative | Patrick Boyer | 19,902 | 44.8 | +14.7 | ||||
| Liberal | Ken Robinson | 13,455 | 30.3 | -10.5 | ||||
| New Democratic | Pat Lawlor | 10,549 | 23.7 | -4.6 | ||||
| Libertarian | Monica Cain | 317 | 0.7 | +0.2 | ||||
| Communist | Peter Boychuck | 216 | 0.5 | |||||
| Total valid votes | 44,439 | 100.0 | ||||||
| 1980 Canadian federal election | ||||||||
|---|---|---|---|---|---|---|---|---|
| Party | Candidate | Votes | % | ±% | ||||
| Liberal | Ken Robinson | 17,903 | 40.8 | +6.1 | ||||
| Progressive Conservative | Al Kolyn | 13,209 | 30.1 | -3.0 | ||||
| New Democratic | Terry Meagher | 12,405 | 28.3 | -2.6 | ||||
| Libertarian | Stephen Kimish | 247 | 0.6 | -0.2 | ||||
| Marxist–Leninist | Diane Waldman | 88 | 0.2 | 0.0 | ||||
| Total valid votes | 43,852 | 100.0 | ||||||
| 1979 Canadian federal election | ||||||||
|---|---|---|---|---|---|---|---|---|
| Party | Candidate | Votes | % | ±% | ||||
| Liberal | Ken Robinson | 15,791 | 34.7 | -5.4 | ||||
| Progressive Conservative | Al Kolyn | 15,044 | 33.1 | +9.2 | ||||
| New Democratic | Terry Meagher | 14,044 | 30.9 | -4.5 | ||||
| Libertarian | Sheldon Gold | 349 | 0.8 | |||||
| Communist | Tom Morris | 169 | 0.4 | 0.0 | ||||
| Marxist–Leninist | Diane Waldman | 72 | 0.2 | 0.0 | ||||
| Total valid votes | 45,469 | 100.0 | ||||||
Toronto—Lakeshore
| 1974 Canadian federal election | ||||||||
|---|---|---|---|---|---|---|---|---|
| Party | Candidate | Votes | % | ±% | ||||
| Liberal | Ken Robinson | 14,241 | 40.1 | +4.2 | ||||
| New Democratic | Terry Grier | 12,584 | 35.4 | -4.0 | ||||
| Progressive Conservative | Jim Muir | 8,475 | 23.9 | -0.2 | ||||
| Communist | Ginny Thomson | 145 | 0.4 | |||||
| Marxist–Leninist | Paul Herman | 68 | 0.2 | |||||
| Total valid votes | 35,513 | 100.0 | ||||||
| 1972 Canadian federal election | ||||||||
|---|---|---|---|---|---|---|---|---|
| Party | Candidate | Votes | % | ±% | ||||
| New Democratic | Terry Grier | 14,722 | 39.4 | +2.6 | ||||
| Liberal | Ken Robinson | 13,393 | 35.9 | -7.2 | ||||
| Progressive Conservative | Dmytro Kupiak | 9,004 | 24.1 | +3.9 | ||||
| Independent | Gordon Massie | 124 | 0.3 | |||||
| Independent | George Bedard | 102 | 0.3 | |||||
| Total valid votes | 37,345 | 100.0 | ||||||
Lakeshore
| 1968 Canadian federal election | ||||||||
|---|---|---|---|---|---|---|---|---|
| Party | Candidate | Votes | % | |||||
| Liberal | Ken Robinson | 14,464 | 43.0 | |||||
| New Democratic | Terry Grier | 12,367 | 36.8 | |||||
| Progressive Conservative | Stuart Summerhayes | 6,794 | 20.2 | |||||
| Total valid votes | 33,625 | 100.0 | ||||||
References
- "(Code 35023) Census Profile". 2011 census. Statistics Canada. 2012. Retrieved 2011-03-03.
- Federal riding history from the Library of Parliament:
- 2011 Results from Elections Canada
- Campaign expense data from Elections Canada
Notes
- Statistics Canada: 2012
- Statistics Canada: 2012
- "List of confirmed candidates". Elections Canada. Retrieved October 4, 2019.
- "Election Night Results". Elections Canada. Retrieved November 5, 2019.
- Elections Canada – Confirmed candidates for Etobicoke—Lakeshore, 30 September 2015
- Elections Canada – Final Candidates Election Expenses Limits
- Pundits' Guide to Canadian Elections