Childress County, Texas
Childress County (/ˈtʃɪldrɪs/ CHIL-driss) is a county located in the U.S. state of Texas. As of the 2010 census, its population was 7,041.[1] The county seat is Childress.[2] The county was created in 1876 and later organized in 1887.[3] It is named for George Campbell Childress, the author of the Texas Declaration of Independence.
Childress County | |
|---|---|
 Veterans Memorial at the Childress County Courthouse in Childress | |
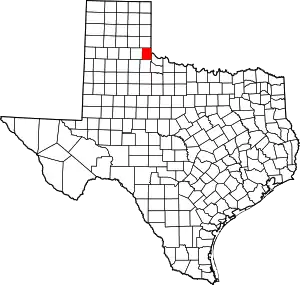 Location within the U.S. state of Texas | |
 Texas's location within the U.S. | |
| Coordinates: 34°32′N 100°12′W | |
| Country | |
| State | |
| Founded | 1887 |
| Named for | George Campbell Childress |
| Seat | Childress |
| Largest city | Childress |
| Area | |
| • Total | 714 sq mi (1,850 km2) |
| • Land | 696 sq mi (1,800 km2) |
| • Water | 17 sq mi (40 km2) 2.4%% |
| Population | |
| • Estimate (2015) | 7,088 |
| • Density | 10/sq mi (4/km2) |
| Time zone | UTC−6 (Central) |
| • Summer (DST) | UTC−5 (CDT) |
| Congressional district | 13th |
| Website | www |
County and regional history is preserved in the Childress County Heritage Museum in downtown Childress. The Bradley 3 Ranch, operated by matriarch Minnie Lou Bradley, is entirely in Childress County, but has a Memphis (Hall County) mailing address.
Republican Drew Springer, Jr., a businessman from Muenster in Cooke County, has since January 2013 represented Childress County in the Texas House of Representatives.[4]
Geography
According to the U.S. Census Bureau, the county has a total area of 714 square miles (1,850 km2), of which 696 square miles (1,800 km2) are land and 17 square miles (44 km2) (2.4%) are covered by water.[5]
Major highways
 U.S. Highway 62
 U.S. Highway 83
 U.S. Highway 287
 State Highway 256
Adjacent counties
- Collingsworth County (north)
- Harmon County, Oklahoma (northeast)
- Hardeman County (east)
- Cottle County (south)
- Hall County (west)
Demographics
| Historical population | |||
|---|---|---|---|
| Census | Pop. | %± | |
| 1880 | 25 | — | |
| 1890 | 1,175 | 4,600.0% | |
| 1900 | 2,138 | 82.0% | |
| 1910 | 9,538 | 346.1% | |
| 1920 | 10,933 | 14.6% | |
| 1930 | 16,044 | 46.7% | |
| 1940 | 12,149 | −24.3% | |
| 1950 | 12,123 | −0.2% | |
| 1960 | 8,421 | −30.5% | |
| 1970 | 6,605 | −21.6% | |
| 1980 | 6,950 | 5.2% | |
| 1990 | 5,953 | −14.3% | |
| 2000 | 7,688 | 29.1% | |
| 2010 | 7,041 | −8.4% | |
| 2019 (est.) | 7,306 | [6] | 3.8% |
| U.S. Decennial Census[7] 1850–2010[8] 2010–2014[1] | |||
As of the census[9] of 2000, 7,688 people, 2,474 households, and 1,650 families resided in the county. The population density was 11 people per square mile (4/km2). The 3,059 housing units averaged 4 per square mile (2/km2). The racial makeup of the county was 67.70% White, 14.09% Black or African American, 0.33% Native American, 0.30% Asian, 0.05% Pacific Islander, 15.70% from other races, and 1.83% from two or more races. About 20.47% of the population was Hispanic or Latino of any race.
Of the 2,474 households, 31.30% had children under the age of 18 living with them, 52.40% were married couples living together, 11.40% had a female householder with no husband present, and 33.30% were not families. About 30.80% of all households were made up of individuals, and 16.50% had someone living alone who was 65 years of age or older. The average household size was 2.40 and the average family size was 3.00.
In the county, the population was distributed as 22.10% under the age of 18, 12.10% from 18 to 24, 30.60% from 25 to 44, 19.40% from 45 to 64, and 15.80% who were 65 years of age or older. The median age was 37 years. For every 100 females, there were 142.40 males. For every 100 females age 18 and over, there were 149.50 males.
The median income for a household in the county was $27,457, and for a family was $35,543. Males had a median income of $25,606 versus $20,037 for females. The per capita income for the county was $12,452. About 13.70% of families and 17.60% of the population were below the poverty line, including 28.30% of those under age 18 and 10.30% of those age 65 or over.
Politics
| Year | Republican | Democratic | Third parties |
|---|---|---|---|
| 2020 | 85.3% 1,943 | 13.6% 310 | 1.1% 26 |
| 2016 | 86.5% 1,802 | 12.1% 253 | 1.4% 29 |
| 2012 | 83.4% 1,665 | 16.0% 320 | 0.6% 11 |
| 2008 | 77.6% 1,782 | 21.7% 497 | 0.7% 17 |
| 2004 | 76.0% 1,629 | 23.8% 511 | 0.2% 4 |
| 2000 | 70.8% 1,506 | 28.3% 602 | 0.9% 18 |
| 1996 | 54.6% 1,072 | 36.7% 719 | 8.7% 171 |
| 1992 | 44.2% 1,033 | 37.7% 881 | 18.1% 424 |
| 1988 | 53.0% 1,201 | 46.8% 1,060 | 0.3% 6 |
| 1984 | 63.4% 1,574 | 36.3% 900 | 0.3% 7 |
| 1980 | 53.2% 1,443 | 45.0% 1,222 | 1.8% 48 |
| 1976 | 39.7% 1,043 | 60.1% 1,578 | 0.2% 5 |
| 1972 | 69.8% 1,716 | 29.7% 729 | 0.5% 13 |
| 1968 | 37.9% 1,045 | 39.6% 1,093 | 22.5% 621 |
| 1964 | 32.5% 952 | 67.5% 1,977 | 0.1% 2 |
| 1960 | 56.8% 1,571 | 43.0% 1,189 | 0.3% 7 |
| 1956 | 45.6% 1,268 | 54.1% 1,503 | 0.3% 9 |
| 1952 | 50.1% 1,890 | 49.8% 1,879 | 0.1% 2 |
| 1948 | 9.8% 273 | 86.2% 2,415 | 4.0% 113 |
| 1944 | 10.7% 299 | 82.1% 2,295 | 7.3% 203 |
| 1940 | 10.9% 335 | 89.0% 2,729 | 0.1% 3 |
| 1936 | 9.1% 209 | 90.0% 2,076 | 1.0% 22 |
| 1932 | 6.8% 153 | 92.6% 2,072 | 0.6% 13 |
| 1928 | 66.5% 1,438 | 33.6% 726 | |
| 1924 | 13.0% 178 | 81.8% 1,117 | 5.2% 71 |
| 1920 | 11.0% 158 | 84.0% 1,206 | 5.0% 72 |
| 1916 | 2.9% 31 | 89.5% 948 | 7.6% 80 |
| 1912 | 4.2% 34 | 89.9% 721 | 5.9% 47 |
See also
References
- "State & County QuickFacts". United States Census Bureau. Archived from the original on March 1, 2016. Retrieved December 9, 2013.
- "Find a County". National Association of Counties. Archived from the original on 2015-05-09. Retrieved 2011-06-07.
- "Texas: Individual County Chronologies". Texas Atlas of Historical County Boundaries. The Newberry Library. 2008. Retrieved May 21, 2015.
- "State Rep. Springer announces district tour July 30". Lubbock Avalanche-Journal, July 16, 2013. Retrieved July 18, 2013.
- "2010 Census Gazetteer Files". United States Census Bureau. August 22, 2012. Retrieved April 20, 2015.
- "Population and Housing Unit Estimates". United States Census Bureau. May 24, 2020. Retrieved May 27, 2020.
- "U.S. Decennial Census". United States Census Bureau. Retrieved April 20, 2015.
- "Texas Almanac: Population History of Counties from 1850–2010" (PDF). Texas Almanac. Retrieved April 20, 2015.
- "U.S. Census website". United States Census Bureau. Retrieved 2011-05-14.
- Leip, David. "Dave Leip's Atlas of U.S. Presidential Elections". uselectionatlas.org. Retrieved 2018-07-20.
External links
- Childress County government's website
- Historic photographs from the Childress County Heritage Museum, hosted by the Portal to Texas History
- Childress County in Handbook of Texas Online at the University of Texas
- Childress County Profile from the Texas Association of Counties
Places adjacent to Childress County, Texas | ||||||||||
|---|---|---|---|---|---|---|---|---|---|---|
| ||||||||||
Municipalities and communities of Childress County, Texas, United States | ||
|---|---|---|
| City | Childress County map | |
| Unincorporated communities | ||
| ||

| Authority control |
|---|