Overton County, Tennessee
Overton County is a county located in the U.S. state of Tennessee. As of the 2010 census, the population was 22,083.[2] Its county seat is Livingston.[3]
Overton County | |
|---|---|
 Overton County Courthouse in Livingston | |
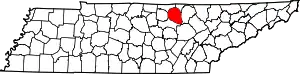 Location within the U.S. state of Tennessee | |
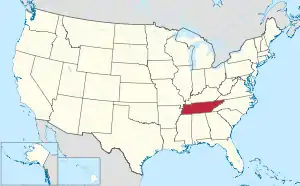 Tennessee's location within the U.S. | |
| Coordinates: 36°20′N 85°17′W | |
| Country | |
| State | |
| Founded | September 1806 |
| Named for | John Overton[1] |
| Seat | Livingston |
| Largest town | Livingston |
| Area | |
| • Total | 435 sq mi (1,130 km2) |
| • Land | 433 sq mi (1,120 km2) |
| • Water | 1.4 sq mi (4 km2) 0.3%% |
| Population | |
| • Estimate (2018) | 22,068 |
| • Density | 51/sq mi (20/km2) |
| Time zone | UTC−6 (Central) |
| • Summer (DST) | UTC−5 (CDT) |
| Congressional district | 6th |
| Website | www |
Overton County is part of the Cookeville, TN Micropolitan Statistical Area.
History
On May 10, 1933, a half-mile wide F4 tornado struck the small community of Beatty Swamps (also referred to as Bethsadia). The tornado destroyed every structure in the town and either killed or injured nearly every inhabitant, with 33 of the 35 deaths occurring in the area. Much of the area was swept clean of debris, a reaper-binder was thrown 500 yards (460 m), and cars were moved hundreds of feet.[4][5][6]
Geography
According to the U.S. Census Bureau, the county has a total area of 435 square miles (1,130 km2), of which 433 square miles (1,120 km2) is land and 1.4 square miles (3.6 km2) (0.3%) is water.[7]
Overton County straddles the Eastern Highland Rim, and generally consists of low, rolling hills divided by narrow creek valleys. The backwaters of Dale Hollow Lake, namely the Mitchell Creek and Big Eagle Creek sections, spill over into the northern part of the county. The Southeast part of the county is on the Cumberland Plateau.
Adjacent counties
- Pickett County (northeast)
- Fentress County (east)
- Putnam County (south)
- Jackson County (west)
- Clay County (northwest)
State protected areas
- Alpine Mountain Wildlife Management Area
- Jackson Swamp Wildlife Management Area
- Standing Stone State Forest (part)
- Standing Stone State Park
Demographics
| Historical population | |||
|---|---|---|---|
| Census | Pop. | %± | |
| 1810 | 5,643 | — | |
| 1820 | 7,128 | 26.3% | |
| 1830 | 8,242 | 15.6% | |
| 1840 | 9,279 | 12.6% | |
| 1850 | 11,211 | 20.8% | |
| 1860 | 12,637 | 12.7% | |
| 1870 | 11,297 | −10.6% | |
| 1880 | 12,153 | 7.6% | |
| 1890 | 12,039 | −0.9% | |
| 1900 | 13,353 | 10.9% | |
| 1910 | 15,854 | 18.7% | |
| 1920 | 17,617 | 11.1% | |
| 1930 | 18,079 | 2.6% | |
| 1940 | 18,883 | 4.4% | |
| 1950 | 17,566 | −7.0% | |
| 1960 | 14,661 | −16.5% | |
| 1970 | 14,866 | 1.4% | |
| 1980 | 17,575 | 18.2% | |
| 1990 | 17,636 | 0.3% | |
| 2000 | 20,118 | 14.1% | |
| 2010 | 22,083 | 9.8% | |
| 2018 (est.) | 22,068 | [8] | −0.1% |
| U.S. Decennial Census[9] 1790-1960[10] 1900-1990[11] 1990-2000[12] 2010-2014[2] | |||
As of the census[14] of 2000, there were 20,118 people, 8,110 households, and 5,920 families residing in the county. The population density was 46 people per square mile (18/km2). There were 9,168 housing units at an average density of 21 per square mile (8/km2). The racial makeup of the county was 94.59% White, 0.28% Black or African American, 2.28% Native American, 0.09% Asian, 0.05% Pacific Islander, 0.22% from other races, and 0.49% from two or more races. 2.69% of the population were Hispanic or Latino of any race.
There were 8,110 households, out of which 29.20% had children under the age of 18 living with them, 59.20% were married couples living together, 9.90% had a female householder with no husband present, and 27.00% were non-families. 24.10% of all households were made up of individuals, and 11.00% had someone living alone who was 65 years of age or older. The average household size was 2.46 and the average family size was 2.90.
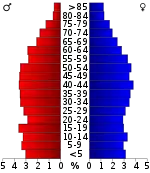
In the county, the population was spread out, with 23.00% under the age of 18, 8.40% from 18 to 24, 27.70% from 25 to 44, 25.90% from 45 to 64, and 15.00% who were 65 years of age or older. The median age was 39 years. For every 100 females, there were 96.20 males. For every 100 females age 18 and over, there were 93.10 males.
The median income for a household in the county was $26,915, and the median income for a family was $32,156. Males had a median income of $25,287 versus $19,674 for females. The per capita income for the county was $13,910. About 12.30% of families and 16.00% of the population were below the poverty line, including 20.40% of those under age 18 and 20.50% of those age 65 or over.
Communities
Town
- Livingston (county seat)
Unincorporated communities
- Allons
- Allred
- Alpine
- Crawford
- Hanging Limb
- Hardy's Chapel
- Hilham
- Mineral Springs
- Monroe
- Rickman
- Timothy
- Twinton
Notable people
- Lester Flatt, Bluegrass musician
- Thomas D. Harp, California state senator born in Overton County
- Albert H. Roberts, Governor of Tennessee
- Roy Roberts, Blues singer
- Catherine "Bonny Kate" Sevier, widow of John Sevier
- Cordell Hull United States Secretary of State
- Josiah Gregg merchant, explorer, naturalist, and author of Commerce of the Prairies
- Benoni Strivson Medal of Honor Recipient Indian Wars
Politics
| Year | Republican | Democratic | Third Parties |
|---|---|---|---|
| 2020 | 78.9% 7,918 | 20.3% 2,033 | 0.9% 86 |
| 2016 | 73.6% 6,059 | 23.6% 1,945 | 2.7% 225 |
| 2012 | 62.3% 4,775 | 36.6% 2,805 | 1.1% 84 |
| 2008 | 55.6% 4,497 | 42.3% 3,419 | 2.2% 176 |
| 2004 | 46.3% 3,941 | 53.1% 4,518 | 0.6% 51 |
| 2000 | 38.4% 2,875 | 60.1% 4,507 | 1.5% 114 |
| 1996 | 29.1% 1,756 | 63.0% 3,800 | 7.9% 476 |
| 1992 | 24.9% 1,657 | 67.5% 4,489 | 7.6% 505 |
| 1988 | 42.6% 1,873 | 57.1% 2,511 | 0.3% 13 |
| 1984 | 42.5% 2,054 | 56.9% 2,749 | 0.6% 27 |
| 1980 | 35.5% 1,869 | 63.5% 3,343 | 1.0% 55 |
| 1976 | 22.1% 1,115 | 77.2% 3,897 | 0.7% 35 |
| 1972 | 54.2% 1,947 | 43.8% 1,573 | 2.1% 74 |
| 1968 | 31.3% 1,258 | 39.5% 1,592 | 29.2% 1,176 |
| 1964 | 26.2% 1,155 | 73.8% 3,258 | |
| 1960 | 43.1% 1,831 | 56.2% 2,389 | 0.8% 32 |
| 1956 | 38.4% 1,508 | 60.8% 2,385 | 0.8% 30 |
| 1952 | 39.5% 1,453 | 60.0% 2,209 | 0.5% 19 |
| 1948 | 31.6% 917 | 63.2% 1,835 | 5.3% 153 |
| 1944 | 39.1% 935 | 60.7% 1,449 | 0.2% 5 |
| 1940 | 36.2% 988 | 62.9% 1,718 | 1.0% 27 |
| 1936 | 36.9% 942 | 62.9% 1,608 | 0.2% 6 |
| 1932 | 22.8% 661 | 76.8% 2,231 | 0.5% 13 |
| 1928 | 51.8% 1,195 | 47.9% 1,105 | 0.3% 7 |
| 1924 | 36.3% 900 | 61.9% 1,532 | 1.8% 45 |
| 1920 | 51.9% 1,939 | 47.6% 1,779 | 0.5% 17 |
| 1916 | 39.8% 1,030 | 58.4% 1,512 | 1.8% 47 |
| 1912 | 29.5% 743 | 60.7% 1,531 | 9.8% 247 |
See also
References
- Michael Birdwell, "Overton County," Tennessee Encyclopedia of History and Culture. Retrieved: 17 March 2013.
- "State & County QuickFacts". United States Census Bureau. Archived from the original on June 7, 2011. Retrieved December 6, 2013.
- "Find a County". National Association of Counties. Retrieved 2011-06-07.
- Assorted Historical Events in Middle Tennessee. Archived June 6, 2011.
- Neal, Samuel K. "20 Dead, Many Hurt in Overton Tornado". Archived from the original on May 23, 2007. Retrieved April 22, 2013.CS1 maint: unfit URL (link)
- Grazulis, Significant, pp. 850-851
- "2010 Census Gazetteer Files". United States Census Bureau. August 22, 2012. Retrieved April 9, 2015.
- "Population and Housing Unit Estimates". Retrieved July 20, 2019.
- "U.S. Decennial Census". United States Census Bureau. Retrieved April 9, 2015.
- "Historical Census Browser". University of Virginia Library. Retrieved April 9, 2015.
- Forstall, Richard L., ed. (March 27, 1995). "Population of Counties by Decennial Census: 1900 to 1990". United States Census Bureau. Retrieved April 9, 2015.
- "Census 2000 PHC-T-4. Ranking Tables for Counties: 1990 and 2000" (PDF). United States Census Bureau. April 2, 2001. Retrieved April 9, 2015.
- Based on 2000 census data
- "U.S. Census website". United States Census Bureau. Retrieved 2011-05-14.
- Leip, David. "Dave Leip's Atlas of U.S. Presidential Elections". uselectionatlas.org. Retrieved 2018-03-12.
External links
 Media related to Overton County, Tennessee at Wikimedia Commons
- Official site
- Overton County, TNGenWeb - free genealogy resources for the county
- Overton County at Curlie
Places adjacent to Overton County, Tennessee | ||||||||||
|---|---|---|---|---|---|---|---|---|---|---|
| ||||||||||
Municipalities and communities of Overton County, Tennessee, United States | ||
|---|---|---|
| Town | ||
| Unincorporated communities | ||
| ||

| Authority control |
|---|