Rutherford County, Tennessee
Rutherford County is a county located in the U.S. state of Tennessee. It is located in Middle Tennessee. As of the 2010 census, the population was 262,604, growing to an estimated 332,285 in 2019,[2] making it the fifth-most populous county in Tennessee. A study conducted by the University of Tennessee projects Rutherford County to become the third largest county in Tennessee by population by 2050.[3] Its county seat is Murfreesboro,[4] which is also the geographic center of Tennessee. As of 2010, it is the center of population of Tennessee.[5][6]
Rutherford County | |
|---|---|
| County of Rutherford | |
 Rutherford County Courthouse, Murfreesboro | |
 Seal | |
 Location within the U.S. state of Tennessee | |
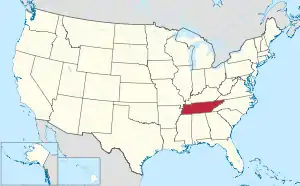
 Tennessee's location within the U.S. | |
| Coordinates: | |
| Country | |
| State | |
| Founded | October 25, 1803 |
| Named for | Griffith Rutherford[1] |
| Seat | Murfreesboro |
| Largest city | Murfreesboro |
| Government | |
| • Mayor | Bill Ketron |
| Area | |
| • Total | 624 sq mi (1,620 km2) |
| • Land | 619 sq mi (1,600 km2) |
| • Water | 4.7 sq mi (12 km2) 0.8%% |
| Population | |
| • Estimate (2019) | 332,285 |
| • Density | 498/sq mi (192/km2) |
| Time zone | UTC−6 (Central) |
| • Summer (DST) | UTC−5 (CDT) |
| ZIP Codes | 37037, 37060, 37063, 37085, 37086, 37089, 37118, 37127, 37128, 37129, 37130, 37131, 37132, 37133, 37153, 37167 |
| Area code | 615, 629 |
| Congressional district | 4th |
| Website | rutherfordcountytn |
Rutherford County is included in the Nashville-Davidson–Murfreesboro–Franklin, TN Metropolitan Statistical Area.
History
Rutherford County was formed in 1803 from parts of Davidson, Williamson and Wilson counties,[1] and named in honor of Griffith Rutherford (1721–1805).[7] Rutherford was a North Carolina colonial legislator and an American Revolutionary War general, who settled in Middle Tennessee after the Revolution. He was appointed President of the Council of the Southwest Territory (the upper chamber of the territorial legislature) in 1794.[8]
Rutherford County strongly supported the Confederacy during the Civil War, having voted 2,392 to 73 in favor of Tennessee's Ordinance of Secession on June 8, 1861.[9] Rutherford County's central location and proximity to Nashville during the Civil War made it a contested area.[10] The county was home to one of the bloodiest battles of the war, the Battle of Stones River, which was fought between December 31, 1861, and January 2, 1862. On July 13, 1862, Confederate General Nathan Bedford Forrest conducted a series of cavalry operations known locally as Forrest's Raid. The raid successfully led to the surrender of all Union forces occupying the area.[11] Soon after his departure, Union troops returned to the area and held it until the end of the war.
Geography
According to the U.S. Census Bureau, the county has a total area of 624 square miles (1,620 km2), of which 619 square miles (1,600 km2) is land and 4.7 square miles (12 km2) (0.8%) is water.[12]
Adjacent counties
- Wilson County (north)
- Cannon County (east)
- Coffee County (southeast)
- Bedford County (south)
- Marshall County (southwest)
- Williamson County (west)
- Davidson County (northwest)
National protected area
State protected areas
- Flat Rock Cedar Glades and Barrens State Natural Area
- Gattinger's Cedar Glade and Barrens State Natural Area (part)
- Long Hunter State Park (part)
- Manus Road Cedar Glade State Natural Area
- Overbridge State Natural Area
- Percy Priest Wildlife Management Area (part)
- Elsie Quarterman Cedar Glade State Natural Area
- Fate Sanders Barrens State Natural Area
- Sunnybell Cedar Glade State Natural Area
- Stones River Cedar Glade and Barrens State Natural Area
- Walterhill Floodplain State Natural Area
Demographics
| Historical population | |||
|---|---|---|---|
| Census | Pop. | %± | |
| 1810 | 10,265 | — | |
| 1820 | 19,552 | 90.5% | |
| 1830 | 26,134 | 33.7% | |
| 1840 | 24,280 | −7.1% | |
| 1850 | 29,122 | 19.9% | |
| 1860 | 27,918 | −4.1% | |
| 1870 | 33,289 | 19.2% | |
| 1880 | 36,741 | 10.4% | |
| 1890 | 35,097 | −4.5% | |
| 1900 | 33,543 | −4.4% | |
| 1910 | 33,199 | −1.0% | |
| 1920 | 33,059 | −0.4% | |
| 1930 | 32,286 | −2.3% | |
| 1940 | 33,604 | 4.1% | |
| 1950 | 40,696 | 21.1% | |
| 1960 | 52,368 | 28.7% | |
| 1970 | 59,428 | 13.5% | |
| 1980 | 84,058 | 41.4% | |
| 1990 | 118,570 | 41.1% | |
| 2000 | 182,023 | 53.5% | |
| 2010 | 262,604 | 44.3% | |
| 2019 (est.) | 332,285 | [2] | 26.5% |
| U.S. Decennial Census[13] 1790-1960[14] 1900-1990[15] 1990-2000[16] 2010-2019[2] | |||
2010 census
As of the census of 2010,[17] there were 262,604 people, 96,232 households, and 66,810 families living in the county. The population density was 424 people per square mile (114/km2), and the housing unit density was 156 units per square mile (44/km2). The racial makeup of the county was 80.67% White, 12.65% Black or African American, 3.08% Asian, 0.36% Native American, 0.05% Pacific Islander, and 2.04% from two or more races. Those of Hispanic or Latino origins were 6.67% of the population.
Of the 96,232 households, 35.19% had children under the age of 18 living in them, 51.61% were married couples living together, 5.04% had a male householder with no wife present, 12.77% had a female householder with no husband present, and 30.59% were non-families. 22.10% of all households were made up of individuals, and 5.38% had someone living alone who was 65 years of age or older. The average household size was 2.68 and the average family size was 3.14.
Of the 262,604 residents, 26.17% were under the age of 18, 65.62% were between the ages of 18 and 64, and 8.21% were 65 years of age and older. The median age was 33.1 years. 50.60% of all residents were female and 49.40% were male.
The median household income in the county was $53,770 and the median family income was $63,483. Males had a median income of $43,306 versus $35,437 for females. The per capita income was $24,390. About 8.8% of families and 12.7% of the population were below the poverty line, including 16.2% of those under the age of 18 and 7.4% of those age 65 and over.
2000 census
As of the 2000 census, there were 182,023 people, 66,443 households, and 47,440 families living in the county. The population density was 294 people per square mile (114/km2), and there were 70,616 housing units. The racial makeup of the county was 85.73% White, 9.51% Black or African American, 1.90% Asian, 0.29% Native American, 0.04% Pacific Islander, 1.32% from other races, and 1.20% from two or more races. 2.78% of the population were Hispanic or Latino of any race.
There were 66,443 households, out of which 37.80% had children under the age of 18 living with them, 56.30% were married couples living together, 11.20% had a female head of household with no husband present, and 28.60% were non-families. 20.80% of all households were made up of individuals, and 5.10% had someone living alone who was 65 years of age or older. The average household size was 2.65 and the average family size was 3.09.
In the county, the population was spread out, with 26.40% under the age of 18, 13.20% from 18 to 24, 33.50% from 25 to 44, 19.40% from 45 to 64, and 7.50% who were 65 years of age or older. The median age was 31 years. For every 100 females, there were 99.10 males. For every 100 females age 18 and over, there were 97.20 males.
The median income for a household in the county was $46,312, and the median income for a family was $53,553. Males had a median income of $36,788 versus $26,555 for females. The per capita income for the county was $19,938. About 5.80% of families and 9.00% of the population were below the poverty line, including 8.50% of those under age 18 and 9.40% of those age 65 or over.
The 2010 census put the population of Rutherford County at 262,604. This represents a greater than 40% population growth since the 2000 U.S. Census. As of 2009, it was estimated that the total minority fraction of the population had grown to almost 20% of the total, with Hispanic population at 5.58%, African-American population at 12.09%, and Asian population at 2.66% of the total.[18]
Government and politics
The Board of County Commissioners, the county legislative body, consists of 21 members elected for four-year terms from single-member districts based on roughly equal populations. The county mayor is the chief executive officer and is elected from the county at-large.
Political parties
This area of the state was predominately Democratic following the American Civil War, but the significant minority of African Americans joined the Republican Party. The white-dominated state legislature in the 1880s passed four laws that effectively disenfranchised most blacks and many poor whites, particularly due to the requirement of payment of a poll tax in order to register to vote. This reduced the competitiveness of the Republican Party in the state for more than six decades, and thus it effectively held political power only in eastern Tennessee.
| Year | Republican | Democratic | Third Parties |
|---|---|---|---|
| 2020 | 56.6% 81,480 | 41.2% 59,341 | 2.1% 3,057 |
| 2016 | 60.1% 64,515 | 34.2% 36,706 | 5.8% 6,215 |
| 2012 | 61.6% 60,846 | 36.8% 36,414 | 1.6% 1,588 |
| 2008 | 58.8% 59,892 | 39.7% 40,460 | 1.5% 1,547 |
| 2004 | 61.8% 52,200 | 37.5% 31,647 | 0.7% 562 |
| 2000 | 53.8% 33,445 | 44.0% 27,360 | 2.2% 1,377 |
| 1996 | 47.6% 24,565 | 44.2% 22,815 | 8.2% 4,214 |
| 1992 | 40.0% 18,877 | 44.7% 21,084 | 15.2% 7,179 |
| 1988 | 62.2% 20,397 | 37.3% 12,245 | 0.5% 159 |
| 1984 | 62.0% 19,503 | 36.9% 11,618 | 1.1% 348 |
| 1980 | 41.0% 11,208 | 55.6% 15,213 | 3.4% 929 |
| 1976 | 34.3% 7,921 | 64.4% 14,854 | 1.3% 307 |
| 1972 | 64.1% 11,256 | 33.1% 5,811 | 2.8% 487 |
| 1968 | 24.7% 4,168 | 29.2% 4,921 | 46.1% 7,773 |
| 1964 | 29.9% 4,088 | 70.1% 9,580 | |
| 1960 | 41.0% 4,526 | 58.0% 6,410 | 1.1% 116 |
| 1956 | 29.2% 2,713 | 69.8% 6,494 | 1.1% 99 |
| 1952 | 31.8% 3,196 | 67.5% 6,793 | 0.7% 72 |
| 1948 | 14.1% 854 | 68.3% 4,151 | 17.7% 1,073 |
| 1944 | 15.6% 879 | 83.9% 4,730 | 0.5% 29 |
| 1940 | 15.6% 782 | 84.0% 4,207 | 0.4% 20 |
| 1936 | 12.3% 580 | 87.1% 4,101 | 0.6% 29 |
| 1932 | 13.3% 606 | 86.2% 3,924 | 0.4% 20 |
| 1928 | 40.3% 1,429 | 59.7% 2,115 | |
| 1924 | 23.9% 680 | 75.0% 2,137 | 1.1% 32 |
| 1920 | 35.6% 1,881 | 64.4% 3,406 | |
| 1916 | 27.5% 1,116 | 72.5% 2,941 | |
| 1912 | 24.5% 1,217 | 68.6% 3,406 | 6.9% 344 |
| 1908 | 30.7% 1,226 | 69.2% 2,764 | 0.0% 0 |
| 1904 | 34.6% 1,348 | 64.3% 2,504 | 0.9% 37 |
| 1900 | 35.3% 1,429 | 62.2% 2,517 | 2.3% 95 |
| 1896 | 39.0% 2,203 | 59.4% 3,352 | 1.4% 82 |
| 1892 | 29.8% 1,210 | 54.5% 2,211 | 15.6% 635 |
| 1888 | 41.3% 2,479 | 55.0% 3,302 | 3.5% 215 |
| 1884 | 41.6% 2,040 | 57.6% 2,828 | 0.7% 36 |
| 1880 | 38.7% 2,482 | 60.1% 3,855 | 1.2% 77 |
Since the late 20th century, the majority of white conservatives in Rutherford County shifted toward the Republican Party. After gaining enforcement of their voting rights under the Voting Rights Act of 1965, most local African Americans favored the Democratic Party.
The changing demographics of the county has shown a slow and shifting increase in minorities; however, this small change has resulted in no significant impact to party alignment. In recent years the county has favored Republican candidates for local, state, and national elections.
Economy
The top employers in the county are listed below. Rutherford County government including Rutherford County Schools also employ 6,028 individuals.[20]
Murfreesboro
- Middle Tennessee State University: 2,205
- National Healthcare: 2,071
- City of Murfreesboro: 1,912
- State Farm Insurance: 1,650
- Amazon.com: 1,550
- Saint Thomas Rutherford: 1,400
- Alvin C. York Veterans Administration Medical Center: 1,300
Smyrna and La Vergne
- Nissan Motor Company: 8,000
- Ingram Content Group: 2,048
- Asurion: 1,050
- Vi-Jon (personal care products): 737
- Stonecrest Medical Center (hospital): 550
The county is also home to Barrett Firearms Manufacturing and a General Mills production facility.
References
- Hankins, Caneta Skelley (December 25, 2009). "Rutherford County". Tennessee Encyclopedia of History and Culture. Retrieved March 22, 2013.
- "Population and Housing Unit Estimates". Retrieved March 26, 2020.
- Hineman, Brinley (December 12, 2019). "Rutherford's explosive growth set to push county's population to Tennessee's third-largest, study says". Murfreesboro Daily News Journal. Retrieved August 15, 2020.
Currently ranking fifth-largest county statewide, researchers from the Boyd Center for Business and Economic Research at the University of Tennessee project that by 2026, Rutherford County's growth will outpace Hamilton County, and by 2050, it will have more residents than Knox County.
- "Find a County". National Association of Counties. Retrieved June 7, 2011.
- "Centers of Population by State: 2010". United States Census Bureau. Retrieved April 28, 2014.
- "Geographic Center of Tennessee". The Historical Marker Database. December 31, 2009. Retrieved April 28, 2014.
- Gannett, Henry (1905). The Origin of Certain Place Names in the United States. Geological Survey Bulletin, no. 258 (2nd ed.). Washington, D.C.: Government Printing Office. p. 268. OCLC 1156805.
- Garrett, William Robertson; Goodpasture, Albert Virgil (1900). History of Tennessee: Its People and Its Institutions. Nashville, TN: Brandon Printing. p. 339. OCLC 1986075.
- Jones, Shirley Ferris (May 29, 2012). "Merry Month of May". The Murfreesboro Post via Rutherford County Historical Society. Archived from the original on July 8, 2013. Retrieved June 17, 2013.
- "A History of Rutherford County, Tennessee". Rutherford County Historical Society. Archived from the original on July 8, 2013. Retrieved June 17, 2013.
- "CWSAC Battle Summaries: Murfreesboro". National Park Service. Retrieved June 17, 2013.
- "2010 Census Gazetteer Files". United States Census Bureau. August 22, 2012. Retrieved April 14, 2015.
- "U.S. Decennial Census". United States Census Bureau. Retrieved April 14, 2015.
- "Historical Census Browser". University of Virginia Library. Retrieved April 14, 2015.
- Forstall, Richard L., ed. (March 27, 1995). "Population of Counties by Decennial Census: 1900 to 1990". United States Census Bureau. Retrieved April 14, 2015.
- "Census 2000 PHC-T-4. Ranking Tables for Counties: 1990 and 2000" (PDF). United States Census Bureau. April 2, 2001. Retrieved April 14, 2015.
- "U.S. Census website". United States Census Bureau. 2010. Retrieved 2019-12-29.
- Rutherford County Pop-Facts: Demographic Snapshot Report Archived 2007-11-07 at the Wayback Machine from the Rutherford Chamber of Commerce
- Leip, David. "Dave Leip's Atlas of U.S. Presidential Elections". uselectionatlas.org. Retrieved 2020-03-12.
- "Comprehensive Annual Financial Report: Rutherford County, Tennessee, For the Year Ended June 30, 2016" (PDF). Tennessee Comptroller of the Treasury. 2016. p. 301. Retrieved June 9, 2017.
External links
| Wikimedia Commons has media related to Rutherford County, Tennessee. |
