Stewart County, Tennessee
Stewart County is a county located on the northwestern corner of Middle Tennessee, in the U.S. state of Tennessee. As of the 2010 census, the population was 13,324.[2] Its county seat is Dover.[3]
Stewart County | |
|---|---|
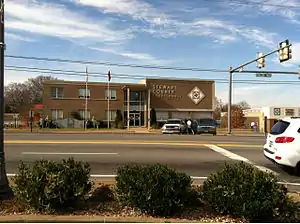 Stewart County courthouse | |
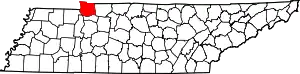 Location within the U.S. state of Tennessee | |
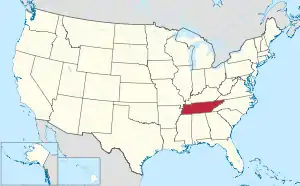 Tennessee's location within the U.S. | |
| Coordinates: 36°30′N 87°50′W | |
| Country | |
| State | |
| Founded | 1803 |
| Named for | Duncan Stewart[1] |
| Seat | Dover |
| Largest city | Dover |
| Area | |
| • Total | 493 sq mi (1,280 km2) |
| • Land | 459 sq mi (1,190 km2) |
| • Water | 34 sq mi (90 km2) 6.8%% |
| Population | |
| • Estimate (2018) | 13,561 |
| • Density | 29/sq mi (11/km2) |
| Time zone | UTC−6 (Central) |
| • Summer (DST) | UTC−5 (CDT) |
| Congressional district | 7th |
| Website | www |
Stewart County is part of the Clarksville Metropolitan Statistical Area.
History
Stewart County was created by European Americans in 1803 from a portion of Montgomery County, and was named for Duncan Stewart, an early settler and state legislator.[1] The first County Court met in March 1804. According to Goodspeed's history of Stewart County, "Stewart County was settled principally by North Carolinians, the first of whom came some time about 1795, that State having issued military grants to survivors of the Continental war, which called for large tracts of land lying in this county". [4] It was settled during the early migration of pioneers from Virginia to the west after the American Revolutionary War. They pushed Native American peoples, such as the Cherokee, out of the area. (Please supply sources proving that the early pioners were from Virginia.)
During the American Civil War, the Battle of Fort Donelson took place in February 1862. Union forces took control of the state, occupying several strategic areas. In August 1862 their forces partially burned the county seat, Dover, to prevent its re-capture by Confederate Lt. Col. Thomas G. Woodward.[5] A second battle in the area, commonly called the Battle of Dover, took place in February 1863.
Tobaccoport Saltpeter Cave was intensely mined for saltpeter, possibly during the War of 1812 but more likely not until the Civil War. Saltpeter is the main ingredient of gunpowder and was obtained by leaching the earth from the cave. The Union took control of Tennessee and this area in February 1862, early in the Civil War. It seems unlikely that mining could have happened before that.[6]
Geography
.jpg.webp)
According to the U.S. Census Bureau, the county has a total area of 493 square miles (1,280 km2), of which 459 square miles (1,190 km2) is land and 34 square miles (88 km2) (6.8%) is water.[7] The county lies in a rugged section of the northwestern Highland Rim. The Cumberland River (part of Lake Barkley) traverses the county. The Tennessee River (part of Kentucky Lake) provides the county's border with Henry County to the west.
Federal and state agencies control nearly 44% of the land in the county.[1]
Adjacent counties
- Trigg County, Kentucky (north)
- Christian County, Kentucky (northeast)
- Montgomery County (east)
- Houston County (south)
- Benton County (southwest)
- Henry County (west)
- Calloway County, Kentucky (northwest)
National protected areas
State protected areas
- Barkley Wildlife Management Area
- Stewart State Forest
Demographics
| Historical population | |||
|---|---|---|---|
| Census | Pop. | %± | |
| 1810 | 4,262 | — | |
| 1820 | 8,397 | 97.0% | |
| 1830 | 6,968 | −17.0% | |
| 1840 | 8,587 | 23.2% | |
| 1850 | 9,719 | 13.2% | |
| 1860 | 9,896 | 1.8% | |
| 1870 | 12,019 | 21.5% | |
| 1880 | 12,690 | 5.6% | |
| 1890 | 12,193 | −3.9% | |
| 1900 | 15,224 | 24.9% | |
| 1910 | 14,860 | −2.4% | |
| 1920 | 14,664 | −1.3% | |
| 1930 | 13,278 | −9.5% | |
| 1940 | 13,549 | 2.0% | |
| 1950 | 9,175 | −32.3% | |
| 1960 | 7,851 | −14.4% | |
| 1970 | 7,319 | −6.8% | |
| 1980 | 8,665 | 18.4% | |
| 1990 | 9,479 | 9.4% | |
| 2000 | 12,370 | 30.5% | |
| 2010 | 13,324 | 7.7% | |
| 2018 (est.) | 13,561 | [8] | 1.8% |
| U.S. Decennial Census[9] 1790-1960[10] 1900-1990[11] 1990-2000[12] 2010-2014[2] | |||
As of the census[14] of 2000, there were 12,370 people, 4,930 households, and 3,653 families residing in the county. The population density was 27 people per square mile (10/km2). There were 5,977 housing units at an average density of 13 per square mile (5/km2). The racial makeup of the county was 95.27% White, 1.29% Black or African American, 0.61% Native American, 1.46% Asian, 0.05% Pacific Islander, 0.23% from other races, and 1.10% from two or more races. 1.00% of the population were Hispanic or Latino of any race.
There were 4,930 households, out of which 31.50% had children under the age of 18 living with them, 62.30% were married couples living together, 8.10% had a female householder with no husband present, and 25.90% were non-families. 23.10% of all households were made up of individuals, and 10.80% had someone living alone who was 65 years of age or older. The average household size was 2.49 and the average family size was 2.91.
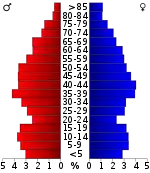
In the county, the population was spread out, with 23.90% under the age of 18, 7.50% from 18 to 24, 28.40% from 25 to 44, 25.40% from 45 to 64, and 14.90% who were 65 years of age or older. The median age was 39 years. For every 100 females, there were 99.10 males. For every 100 females age 18 and over, there were 96.50 males.
The median income for a household in the county was $32,316, and the median income for a family was $38,655. Males had a median income of $31,106 versus $21,985 for females. The per capita income for the county was $16,302. About 10.60% of families and 12.40% of the population were below the poverty line, including 12.90% of those under age 18 and 15.60% of those age 65 or over.
Politics
| Year | Republican | Democratic | Third Parties |
|---|---|---|---|
| 2020 | 78.6% 4,950 | 19.6% 1,232 | 1.8% 114 |
| 2016 | 72.9% 3,864 | 23.1% 1,222 | 4.0% 213 |
| 2012 | 57.9% 2,963 | 40.5% 2,069 | 1.6% 83 |
| 2008 | 53.7% 2,956 | 44.9% 2,470 | 1.5% 81 |
| 2004 | 47.9% 2,675 | 51.2% 2,860 | 0.9% 48 |
| 2000 | 38.2% 1,826 | 60.0% 2,870 | 1.8% 86 |
| 1996 | 27.8% 1,306 | 63.0% 2,962 | 9.2% 432 |
| 1992 | 24.2% 1,046 | 64.3% 2,779 | 11.5% 498 |
| 1988 | 39.5% 1,302 | 60.0% 1,979 | 0.5% 15 |
| 1984 | 36.8% 1,285 | 62.3% 2,174 | 0.9% 31 |
| 1980 | 29.7% 985 | 68.5% 2,274 | 1.8% 59 |
| 1976 | 17.2% 510 | 82.2% 2,442 | 0.7% 20 |
| 1972 | 40.8% 790 | 56.7% 1,098 | 2.4% 47 |
| 1968 | 17.4% 443 | 41.0% 1,041 | 41.6% 1,057 |
| 1964 | 15.3% 441 | 84.7% 2,444 | |
| 1960 | 22.6% 539 | 75.9% 1,810 | 1.6% 37 |
| 1956 | 20.8% 560 | 78.6% 2,120 | 0.6% 16 |
| 1952 | 22.7% 641 | 76.9% 2,170 | 0.4% 12 |
| 1948 | 13.7% 331 | 81.4% 1,962 | 4.9% 118 |
| 1944 | 14.9% 335 | 85.1% 1,916 | |
| 1940 | 12.1% 374 | 87.4% 2,699 | 0.5% 15 |
| 1936 | 14.9% 303 | 84.7% 1,718 | 0.4% 7 |
| 1932 | 10.6% 184 | 88.8% 1,548 | 0.7% 12 |
| 1928 | 24.2% 401 | 75.8% 1,255 | |
| 1924 | 15.9% 264 | 82.6% 1,369 | 1.5% 25 |
| 1920 | 26.2% 849 | 72.9% 2,366 | 0.9% 29 |
| 1916 | 25.3% 591 | 73.1% 1,711 | 1.6% 38 |
| 1912 | 23.7% 485 | 64.1% 1,312 | 12.3% 251 |
The county is part of Tennessee's 8th congressional district. From the antebellum period, conservative whites historically voted Democratic, adding to the Southern Block. Residents of eastern Tennessee had been Unionist and supported the Republican Party.
In the late 20th century realignment of political parties, many white conservatives shifted into the Republican Party. Before Richard Nixon's campaign in 1972, no Republican had ever won as much as thirty percent of Stewart County's vote, but he won by a landslide in the South. Until 2000 Richard Nixon was the only GOP presidential candidate to gain forty percent of the vote in the country.
Before 2000, the Democratic presidential candidate lost Stewart County only in 1968, when segregationist George Wallace ran for the American Independent Party. After that Stewart County was one of only six Wallace counties[lower-alpha 1] to support Democratic candidate George McGovern.
Since the turn of the 21st century, Stewart County's voters have increasingly supported Republican candidates in recent presidential elections. In the 2008 presidential election, John McCain received approximately 53.7% of the vote;[16] he was the first Republican to carry the county. For 100 years before that, Stewart County was the sole county in Tennessee that had never voted in majority for a Republican presidential candidate.[17] In 2016, Republican Donald Trump gained a proportion of votes here that was only marginally less than that of the GOP gained in the historically Unionist counties of East Tennessee and the Highland Rim.
Media
Radio stations
- WTPR-FM 101.7 - "The Greatest Hits of All Time"
- WTPR-AM 710 - "The Greatest Hits of All Time"
- WRQR-FM 105.5 - "Today's Best Music with Ace & TJ in the Morning"
Newspaper
Communities
City
- Dover (county seat)
Towns
- Cumberland City
- Tennessee Ridge (mostly in Houston County)
Unincorporated communities
- Bear Spring
- Big Rock
- Bumpus Mills
- Indian Mound
- Standing Rock
- Leatherwood
- Carlisle
Notes
- The others were the fellow secessionist white-majority Middle Tennessee counties of Houston and Perry, plus the three Alabama Black Belt counties of Bullock, Lowndes and Wilcox. where Negro voter registration was severely delayed after the Voting Rights Act.
References
- Jane Bagwell, "Stewart County," Tennessee Encyclopedia of History and Culture. Retrieved: 7 April 2013.
- "State & County QuickFacts". United States Census Bureau. Retrieved December 7, 2013.
- "Find a County". National Association of Counties. Archived from the original on May 31, 2011. Retrieved 2011-06-07.
- "Goodspeed/Part2:Early Settlement". www.tngenweb.org. Retrieved 2020-11-25.
- "The War of the Rebellion". Cornell University. August 22, 2012. Retrieved February 11, 2019.
- Thomas C. Barr, Jr., "Caves of Tennessee", Bulletin 64 of the Tennessee Division of Geology, 1961, 568 pages.
- "2010 Census Gazetteer Files". United States Census Bureau. August 22, 2012. Retrieved April 14, 2015.
- "Population and Housing Unit Estimates". Retrieved July 20, 2019.
- "U.S. Decennial Census". United States Census Bureau. Retrieved April 14, 2015.
- "Historical Census Browser". University of Virginia Library. Retrieved April 14, 2015.
- Forstall, Richard L., ed. (March 27, 1995). "Population of Counties by Decennial Census: 1900 to 1990". United States Census Bureau. Retrieved April 14, 2015.
- "Census 2000 PHC-T-4. Ranking Tables for Counties: 1990 and 2000" (PDF). United States Census Bureau. April 2, 2001. Retrieved April 14, 2015.
- Based on 2000 census data
- "U.S. Census website". United States Census Bureau. Retrieved 2011-05-14.
- Leip, David. "Dave Leip's Atlas of U.S. Presidential Elections". uselectionatlas.org. Retrieved 2018-03-12.
- 2008 electoral map, New York Times, 9 December 2008. Retrieved: 7 April 2013.
- David Leip, "Presidential General Election Map Comparison (Tennessee)," Atlas of U.S. Presidential Elections. Retrieved: 7 April 2013.
External links
| Wikimedia Commons has media related to Stewart County, Tennessee. |
- Official website
- Stewart County Chamber of Commerce
- Stewart County Schools
- www.stewartcountystandard.com
- TNGenWeb
- Stewart County at Curlie
- Stewart County Fire Rescue
Places adjacent to Stewart County, Tennessee | |
|---|---|
Municipalities and communities of Stewart County, Tennessee, United States | ||
|---|---|---|
| City | Stewart County map | |
| Towns | ||
| Unincorporated communities | ||
| Ghost town | ||
| Footnotes | ‡This populated place also has portions in an adjacent county or counties | |
| ||

| Authority control |
|---|