Smith County, Tennessee
Smith County is a county in the U.S. state of Tennessee. As of the 2010 census, the population was 19,166.[2] In the section known as Middle Tennessee, its county seat is Carthage.[3] The county was organized in 1799 and is named for Daniel Smith, a Revolutionary War veteran who made the first map of Tennessee and served as a United States senator .
Smith County | |
|---|---|
 Smith County Courthouse in Carthage | |
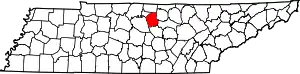 Location within the U.S. state of Tennessee | |
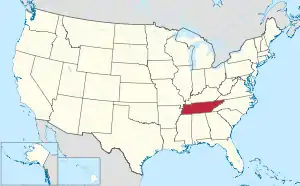 Tennessee's location within the U.S. | |
| Coordinates: 36°15′N 85°58′W | |
| Country | |
| State | |
| Founded | 1799 |
| Named for | Daniel Smith[1] |
| Seat | Carthage |
| Largest town | Carthage |
| Area | |
| • Total | 325 sq mi (840 km2) |
| • Land | 314 sq mi (810 km2) |
| • Water | 11 sq mi (30 km2) 3.4%% |
| Population | |
| • Estimate (2019) | 20,157 |
| • Density | 61/sq mi (24/km2) |
| Time zone | UTC−6 (Central) |
| • Summer (DST) | UTC−5 (CDT) |
| Congressional district | 6th |

Smith County is part of the Nashville-Davidson–Murfreesboro–Franklin, TN Metropolitan Statistical Area.
History
Smith County was established in 1799 from a portion of Sumner County, and was named for Daniel Smith, a U.S. Senator and former Secretary of the Southwest Territory.[1] The location of the county seat was hotly contested between Bledsoesborough (near modern Dixon Springs) and William Walton's ferry and tavern at the confluence of the Caney Fork and the Cumberland River. In 1804, voters chose Walton's site, and a town, named Carthage, was platted the following year.[1]
Smith County was the site of a large saltpeter mine. Piper Cave, located near Monoville, contains the poorly preserved remnants of dozens of saltpeter leaching vats. Most saltpeter mining in Middle Tennessee took place during the War of 1812 and the Civil War, though the exact dates of this operation are unclear.[4]
Geography

According to the U.S. Census Bureau, the county has a total area of 325 square miles (840 km2), of which 314 square miles (810 km2) is land and 11 square miles (28 km2) (3.4%) is water.[5] The county is located in a transition area between the rugged Highland Rim to the east and the flatter Nashville Basin to the west. The Caney Fork has its confluence with the Cumberland River in Carthage; these are the primary waterways flowing through the county. Cordell Hull Dam on the Cumberland is located near Carthage.
Adjacent counties
- Macon County (north)
- Jackson County (northeast)
- Putnam County (east)
- DeKalb County (southeast)
- Wilson County (west)
- Trousdale County (northwest)
State protected areas
- Cordell Hull Wildlife Management Area (part)
Demographics
| Historical population | |||
|---|---|---|---|
| Census | Pop. | %± | |
| 1800 | 4,294 | — | |
| 1810 | 11,649 | 171.3% | |
| 1820 | 17,580 | 50.9% | |
| 1830 | 19,906 | 13.2% | |
| 1840 | 21,179 | 6.4% | |
| 1850 | 18,412 | −13.1% | |
| 1860 | 16,357 | −11.2% | |
| 1870 | 15,994 | −2.2% | |
| 1880 | 17,799 | 11.3% | |
| 1890 | 18,404 | 3.4% | |
| 1900 | 19,026 | 3.4% | |
| 1910 | 18,548 | −2.5% | |
| 1920 | 17,134 | −7.6% | |
| 1930 | 15,473 | −9.7% | |
| 1940 | 16,148 | 4.4% | |
| 1950 | 14,098 | −12.7% | |
| 1960 | 12,059 | −14.5% | |
| 1970 | 12,059 | 0.0% | |
| 1980 | 14,935 | 23.8% | |
| 1990 | 14,143 | −5.3% | |
| 2000 | 17,712 | 25.2% | |
| 2010 | 19,166 | 8.2% | |
| 2019 (est.) | 20,157 | [6] | 5.2% |
| U.S. Decennial Census[7] 1790-1960[8] 1900-1990[9] 1990-2000[10] 2010-2014[2] | |||

As of the census[12] of 2000, there were 17,712 people, 6,878 households, and 5,069 families residing in the county. The population density was 56 people per square mile (22/km2). There were 7,665 housing units at an average density of 24 per square mile (9/km2). The racial makeup of the county was 95.42% White, 2.53% Black or African American, 0.37% Native American, 0.17% Asian, 0.01% Pacific Islander, 0.59% from other races, and 0.93% from two or more races. 1.13% of the population were Hispanic or Latino of any race.
There were 6,878 households, out of which 34.10% had children under the age of 18 living with them, 60.10% were married couples living together, 9.80% had a female householder with no husband present, and 26.30% were non-families. 23.40% of all households were made up of individuals, and 11.10% had someone living alone who was 65 years of age or older. The average household size was 2.55 and the average family size was 3.00.
In the county, the population was spread out, with 25.50% under the age of 18, 8.00% from 18 to 24, 30.00% from 25 to 44, 23.10% from 45 to 64, and 13.40% who were 65 years of age or older. The median age was 37 years. For every 100 females, there were 97.00 males. For every 100 females age 18 and over, there were 92.40 males.
The median income for a household in the county was $35,625, and the median income for a family was $41,645. Males had a median income of $30,853 versus $22,133 for females. The per capita income for the county was $17,473. About 10.30% of families and 12.20% of the population were below the poverty line, including 14.70% of those under age 18 and 14.80% of those age 65 or over.
Politics
Prior to 2008, Smith County was a Democratic Party stronghold at the presidential level. The county failed to back a Democratic candidate only twice between the Civil War and 2004, when voting for George Wallace in 1968 and against George McGovern in 1972. However, while the county was Carthage resident Al Gore's fourth strongest statewide in his 2000 presidential bid, he failed to win an increasingly Republican Tennessee. Since then, Smith County has swung hard towards the Republican Party similar to the rest of the state outside of Memphis and Nashville. Hillary Clinton failed to win even a quarter of the county's votes in 2016, a far cry from the 71 percent and 62 percent her husband Bill won in the county with Gore also on the ticket.
| Year | Republican | Democratic | Third Parties |
|---|---|---|---|
| 2020 | 78.8% 7,136 | 19.9% 1,802 | 1.3% 113 |
| 2016 | 73.9% 5,494 | 22.7% 1,689 | 3.4% 253 |
| 2012 | 63.4% 4,495 | 34.8% 2,470 | 1.8% 124 |
| 2008 | 59.0% 4,563 | 38.7% 2,992 | 2.4% 186 |
| 2004 | 47.8% 3,739 | 51.7% 4,044 | 0.6% 45 |
| 2000 | 32.4% 2,384 | 66.5% 4,884 | 1.1% 80 |
| 1996 | 30.7% 1,857 | 62.9% 3,812 | 6.4% 388 |
| 1992 | 21.0% 1,482 | 71.9% 5,061 | 7.1% 501 |
| 1988 | 45.6% 2,138 | 53.8% 2,522 | 0.6% 26 |
| 1984 | 42.1% 2,393 | 57.3% 3,258 | 0.7% 40 |
| 1980 | 31.7% 1,755 | 66.4% 3,674 | 1.9% 102 |
| 1976 | 25.9% 1,332 | 73.1% 3,753 | 1.0% 51 |
| 1972 | 56.8% 1,812 | 39.5% 1,260 | 3.6% 116 |
| 1968 | 25.0% 1,089 | 33.1% 1,443 | 42.0% 1,831 |
| 1964 | 27.0% 1,084 | 73.0% 2,934 | |
| 1960 | 39.4% 1,601 | 59.4% 2,411 | 1.2% 48 |
| 1956 | 30.0% 1,267 | 69.7% 2,949 | 0.3% 13 |
| 1952 | 34.8% 1,412 | 64.6% 2,622 | 0.6% 24 |
| 1948 | 27.3% 773 | 62.4% 1,764 | 10.3% 291 |
| 1944 | 29.5% 887 | 70.1% 2,107 | 0.4% 12 |
| 1940 | 22.3% 648 | 77.2% 2,244 | 0.5% 14 |
| 1936 | 23.0% 626 | 76.7% 2,092 | 0.3% 8 |
| 1932 | 22.3% 595 | 77.1% 2,057 | 0.6% 16 |
| 1928 | 43.9% 1,150 | 55.3% 1,446 | 0.8% 21 |
| 1924 | 28.8% 700 | 70.0% 1,701 | 1.2% 28 |
| 1920 | 38.6% 1,981 | 61.4% 3,150 | |
| 1916 | 30.0% 941 | 70.0% 2,196 | 0.1% 2 |
| 1912 | 30.9% 915 | 62.9% 1,863 | 6.2% 184 |
References
- Sue W. Maggart, "Smith County," Tennessee Encyclopedia of History and Culture. Retrieved: 6 April 2013.
- "State & County QuickFacts". United States Census Bureau. Retrieved December 7, 2013.
- "Find a County". National Association of Counties. Retrieved 2011-06-07.
- Thomas C. Barr, Jr., "Caves of Tennessee", Bulletin 64 of the Tennessee Division of Geology, 1961, 568 pages.
- "2010 Census Gazetteer Files". United States Census Bureau. August 22, 2012. Retrieved April 14, 2015.
- "Population and Housing Unit Estimates". Retrieved July 20, 2019.
- "U.S. Decennial Census". United States Census Bureau. Retrieved April 14, 2015.
- "Historical Census Browser". University of Virginia Library. Retrieved April 14, 2015.
- Forstall, Richard L., ed. (March 27, 1995). "Population of Counties by Decennial Census: 1900 to 1990". United States Census Bureau. Retrieved April 14, 2015.
- "Census 2000 PHC-T-4. Ranking Tables for Counties: 1990 and 2000" (PDF). United States Census Bureau. April 2, 2001. Retrieved April 14, 2015.
- Based on 2000 census data
- "U.S. Census website". United States Census Bureau. Retrieved 2011-05-14.
- Leip, David. "Dave Leip's Atlas of U.S. Presidential Elections". uselectionatlas.org. Retrieved 2018-03-12.
External links
| Wikimedia Commons has media related to Smith County, Tennessee. |
- Smith County at TN.gov
- Smith County Chamber of Commerce
- UT Extension office
- TNGenWeb
- Tennessee Central Economic Alliance for Smith County
- Smith County at Curlie
Places adjacent to Smith County, Tennessee | ||||||||||
|---|---|---|---|---|---|---|---|---|---|---|
| ||||||||||
Municipalities and communities of Smith County, Tennessee, United States | ||
|---|---|---|
| Towns | ||
| Unincorporated communities | ||
| ||
| Principal City | ||
|---|---|---|
| Other Major Cities | ||
| Counties | ||

| Authority control |
|---|