Peterborough—Kawartha
Peterborough—Kawartha is a federal electoral district in Ontario, Canada, that has been represented in the House of Commons of Canada since 1953. Prior to the 2015 election, the riding was known as Peterborough.[2]
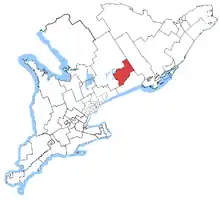 Peterborough in relation to southern Ontario ridings | |||
| Federal electoral district | |||
| Legislature | House of Commons | ||
| MP |
Liberal | ||
| District created | 1953 | ||
| First contested | 1953 | ||
| Last contested | 2019 | ||
| District webpage | profile, map | ||
| Demographics | |||
| Population (2011)[1] | 115,269 | ||
| Electors (2015) | 90,352 | ||
| Area (km²)[1] | 3,473 | ||
| Pop. density (per km²) | 33.2 | ||
| Census division(s) | Peterborough County | ||
| Census subdivision(s) | Curve Lake First Nation 35, Douro-Dummer, Trent Lakes, Havelock-Belmont-Methuen, North Kawartha, Peterborough, Selwyn | ||
Geography
It now consists of the City of Peterborough and the municipalities of: Douro-Dummer, Trent Lakes, Havelock-Belmont-Methuen, North Kawartha and Selwyn plus the Curve Lake First Nation.
History
The riding's borders have differed slightly since its creation in 1953, but has always included most or all of Peterborough County and its county seat of Peterborough, Ontario. Prior to 1952, Peterborough was split into two ridings, one of which was sometimes partly joined to neighbouring Hastings County. Since 1999, the riding boundaries and names of the provincial and federal electoral districts have been identical.
It was created in 1953 from Peterborough West and Hastings—Peterborough. It consisted initially of the city of Peterborough and the townships of Galway, Cavendish, Harvey, Ennismore, Smith, Douro, Otonabee, and North Monaghan. In 1966, the townships of Galway, Cavendish and Harvey were removed from the riding, and the townships of Belmont and Methuen, Dummer, Smith and Asphodel (excluding the Village of Hastings) were added.
In 1976, it was redefined to consist of the part of the County of Peterborough lying south of the Townships of Burleigh and Anstruther, Chandos and Harvey, but excluding the Township of Cavan and the Village of Hastings. In 1987, the Village of Millbrook was excluded, and the Village of Hastings was added to the riding.
In 2003, the Township of North Monaghan was removed from the riding.
In 2013, the riding lost the Townships of Otonabee-South Monaghan, Asphodel-Norwood, and the Hiawatha First Nation, while subsequently gaining the townships of Trent Lakes and North Kawartha.
The riding is a noted bellwether; it has been won by a member of the governing party of the day in all but four elections since its creation. Its previous MP, Dean Del Mastro, was elected as a member of the Conservative Party of Canada, but resigned from the Conservative caucus in 2013.[3] In 2014, Del Mastro was found guilty of falsifying his expense report in the 2008 election, failing to include $21,000 in expenses and spending more than the election spending limit.[4] He resigned his seat on November 5, 2014.[5]
Members of Parliament
This riding has elected the following Members of Parliament:
| Parliament | Years | Member | Party | |
|---|---|---|---|---|
| Peterborough Riding created from Peterborough West and Hastings—Peterborough |
||||
| 22nd | 1953–1957 | Gordon Fraser | Progressive Conservative | |
| 23rd | 1957–1958 | |||
| 24th | 1958–1960 | |||
| 1960–1961 | Walter Pitman | New | ||
| 1961–1962 | New Democratic | |||
| 25th | 1962–1963 | Fred Stenson | Progressive Conservative | |
| 26th | 1963–1965 | |||
| 27th | 1965–1968 | Hugh Faulkner | Liberal | |
| 28th | 1968–1972 | |||
| 29th | 1972–1974 | |||
| 30th | 1974–1979 | |||
| 31st | 1979–1980 | Bill Domm | Progressive Conservative | |
| 32nd | 1980–1984 | |||
| 33rd | 1984–1988 | |||
| 34th | 1988–1993 | |||
| 35th | 1993–1997 | Peter Adams | Liberal | |
| 36th | 1997–2000 | |||
| 37th | 2000–2004 | |||
| 38th | 2004–2006 | |||
| 39th | 2006–2008 | Dean Del Mastro | Conservative | |
| 40th | 2008–2011 | |||
| 41st | 2011–2013 | |||
| 2013–2014 | Independent Conservative | |||
| Peterborough—Kawartha | ||||
| 42nd | 2015–2019 | Maryam Monsef | Liberal | |
| 43rd | 2019–present | |||
Election results
Peterborough—Kawartha
| 2019 Canadian federal election | ||||||||
|---|---|---|---|---|---|---|---|---|
| Party | Candidate | Votes | % | ±% | Expenditures | |||
| Liberal | Maryam Monsef | 27,400 | 39.2 | -4.6 | $99,034.55 | |||
| Conservative | Michael Skinner | 24,096 | 34.9 | -0.2 | $97,460.55 | |||
| New Democratic | Candace Shaw | 11,872 | 17.0 | -1.7 | none listed | |||
| Green | Andrew MacGregor | 4,930 | 7.0 | +4.8 | none listed | |||
| People's | Alexander Murphy | 890 | 1.3 | none listed | ||||
| Independent | Robert M. Bowers | 180 | 0.3 | $0.00 | ||||
| Stop Climate Change | Ken Ranney | 172 | 0.3 | $1,666.19 | ||||
| Total valid votes/Expense limit | 100.0 | |||||||
| Total rejected ballots | ||||||||
| Turnout | ||||||||
| Eligible voters | ||||||||
| Source: Elections Canada[6] | ||||||||
| 2015 Canadian federal election | ||||||||
|---|---|---|---|---|---|---|---|---|
| Party | Candidate | Votes | % | ±% | Expenditures | |||
| Liberal | Maryam Monsef | 29,159 | 43.82 | +22.42 | $153,380.94 | |||
| Conservative | Michael Skinner | 23,335 | 35.07 | -14.60 | $158,210.30 | |||
| New Democratic | Dave Nickle | 12,437 | 18.69 | -6.19 | $56,760.61 | |||
| Green | Doug Mason | 1,480 | 2.22 | -1.34 | $82.52 | |||
| Strength in Democracy | Toban Leckie | 131 | 0.20 | – | $729.98 | |||
| Total valid votes/Expense limit | 66,542 | 100.0 | – | $232,452.91 | ||||
| Total rejected ballots | 190 | 0.28 | -0.01 | |||||
| Turnout | 66,732 | 73.19 | +7.88 | |||||
| Eligible voters | 91,180 | |||||||
| Source: Elections Canada[7][8] | ||||||||
| 2011 federal election redistributed results[9] | |||
|---|---|---|---|
| Party | Vote | % | |
| Conservative | 28,435 | 49.55 | |
| New Democratic | 14,341 | 24.99 | |
| Liberal | 12,231 | 21.32 | |
| Green | 2,106 | 3.67 | |
| Others | 268 | 0.47 | |
Peterborough
| 2011 Canadian federal election | ||||||||
|---|---|---|---|---|---|---|---|---|
| Party | Candidate | Votes | % | ±% | Expenditures | |||
| Conservative | Dean Del Mastro | 29,393 | 49.67 | +2.27 | $89,982.35 | |||
| New Democratic | Dave Nickle | 14,723 | 24.88 | +10.96 | $44,675.03 | |||
| Liberal | Betsy McGregor | 12,664 | 21.40 | -10.20 | $76,896.98 | |||
| Green | Michael Bell | 2,105 | 3.56 | -3.35 | $2,858.90 | |||
| Independent | Gordon Scott | 189 | 0.32 | – | $202.50 | |||
| Canadian Action | Michael Bates | 104 | 0.18 | – | none listed | |||
| Total valid votes/Expense limit | 59,178 | 100.0 | $95,207.51 | |||||
| Total rejected ballots | 170 | 0.29 | +0.01 | |||||
| Turnout | 59,348 | 65.31 | +1.99 | |||||
| Eligible voters | 90,870 | – | – | |||||
| 2008 Canadian federal election: Peterborough | ||||||||
|---|---|---|---|---|---|---|---|---|
| Party | Candidate | Votes | % | ±% | Expenditures | |||
| Conservative | Dean Del Mastro | 27,630 | 47.40 | +11.50 | $111,988 | |||
| Liberal | Betsy McGregor | 18,417 | 31.60 | −0.77 | $83,805 | |||
| New Democratic | Steve Sharpe | 8,115 | 13.92 | −11.76 | $47,973 | |||
| Green | Emily Berrigan | 4,029 | 6.91 | +1.86 | $10,235 | |||
| Marxist–Leninist | Elaine Couto | 98 | 0.17 | none listed | ||||
| Total valid votes/Expense Limit | 58,289 | 100.00 | – | $92,567 | ||||
| Total rejected ballots | 164 | 0.28 | −0.04 | |||||
| Turnout | 58,453 | 63.32 | −6.34 | |||||
| Electors on the lists | 92,317 | |||||||
| Conservative hold | Swing | +11.6 | ||||||
| 2006 Canadian federal election: Peterborough | ||||||||
|---|---|---|---|---|---|---|---|---|
| Party | Candidate | Votes | % | ±% | Expenditures | |||
| Conservative | Dean Del Mastro | 22,774 | 35.90 | +3.98 | $80,784 | |||
| Liberal | Diane Lloyd | 20,532 | 32.37 | −11.18 | $68,799 | |||
| New Democratic | Linda Slavin | 16,286 | 25.68 | +6.67 | $61,606 | |||
| Green | Brent Wood | 3,205 | 5.05 | −0.47 | $7,949 | |||
| Marijuana | Aiden Wiechula | 455 | 0.72 | none listed | ||||
| Independent | Bob Bowers | 179 | 0.28 | none listed | ||||
| Total valid votes/Expense Limit | 63,431 | 100.00 | – | $86,008 | ||||
| Total rejected ballots | 207 | 0.33 | −0.01 | |||||
| Turnout | 63,638 | 69.66 | +4.47 | |||||
| Electors on the lists | 91,361 | |||||||
| Sources: Official Results, Elections Canada and Financial Returns, Elections Canada. | ||||||||
| 2004 Canadian federal election: Peterborough | ||||||||
|---|---|---|---|---|---|---|---|---|
| Party | Candidate | Votes | % | ±% | Expenditures | |||
| Liberal | Peter Adams | 25,099 | 43.55 | – | $82,907 | |||
| Conservative | James Jackson | 18,393 | 31.92 | $51,318 | ||||
| New Democratic | Linda Slavin | 10,957 | 19.01 | $33,309 | ||||
| Green | Brent Wood | 3,182 | 5.52 | $4,730 | ||||
| Total valid votes/Expense Limit | 57,631 | 100.00 | – | $83,531 | ||||
| Total rejected ballots | 192 | 0.33 | 0.00 | |||||
| Turnout | 57,823 | 65.19 | 4.42 | |||||
| Electors on the lists | 88,695 | |||||||
| Percentage change figures are factored for redistribution. Conservative Party percentages are contrasted with the combined Canadian Alliance and Progressive Conservative percentages from 2000. | ||||||||
| Sources: Official Results, Elections Canada and Financial Returns, Elections Canada. | ||||||||
Note: Conservative vote is compared to the total of the Canadian Alliance vote and Progressive Conservative vote in 2000 election.
| 2000 Canadian federal election: Peterborough | ||||||||
|---|---|---|---|---|---|---|---|---|
| Party | Candidate | Votes | % | ±% | Expenditures | |||
| Liberal | Peter Adams | 25,310 | 48.41 | – | $55,442 | |||
| Alliance | Eric John Allan Mann | 14,924 | 28.54 | $61,961 | ||||
| Progressive Conservative | Darrin Langen | 7,034 | 13.45 | $22,256 | ||||
| New Democratic | Herb Wiseman | 3,967 | 7.59 | $20,021 | ||||
| Green | Tim Holland | 903 | 1.73 | $1,738 | ||||
| Independent | Bob Bowers | 147 | 0.28 | $1,097 | ||||
| Total valid votes/Expense Limit | 52,285 | 100.00 | ||||||
| Total rejected ballots | 175 | 0.33 | ||||||
| Turnout | 52,460 | 60.77 | ||||||
| Electors on the lists | 86,319 | |||||||
| Sources: Official Results, Elections Canada and Financial Returns, Elections Canada. | ||||||||
Note: Canadian Alliance vote is compared to the Reform vote in 1997 election.
| 1997 Canadian federal election | ||||||||
|---|---|---|---|---|---|---|---|---|
| Party | Candidate | Votes | % | ±% | ||||
| Liberal | Peter Adams | 25,594 | 46.5 | -1.0 | ||||
| Reform | Nancy Branscombe | 15,759 | 28.7 | +5.4 | ||||
| Progressive Conservative | Tom Macmillan | 8,757 | 15.9 | -4.1 | ||||
| New Democratic | Fred Birket | 4,874 | 8.9 | +3.6 | ||||
| Total valid votes | 54,984 | 100.0 | ||||||
| 1993 Canadian federal election | ||||||||
|---|---|---|---|---|---|---|---|---|
| Party | Candidate | Votes | % | ±% | ||||
| Liberal | Peter Adams | 27,575 | 47.6 | +17.3 | ||||
| Reform | Len Bangma | 13,460 | 23.2 | |||||
| Progressive Conservative | Bill Domm | 11,628 | 20.1 | -20.8 | ||||
| New Democratic | Merv Richards | 3,072 | 5.3 | -22.2 | ||||
| National | Herb Wiseman | 1,858 | 3.2 | |||||
| Natural Law | Sandy Callender | 368 | 0.6 | |||||
| Total valid votes | 57,961 | 100.0 | ||||||
| 1988 Canadian federal election | ||||||||
|---|---|---|---|---|---|---|---|---|
| Party | Candidate | Votes | % | ±% | ||||
| Progressive Conservative | Bill Domm | 22,492 | 40.9 | -11.8 | ||||
| Liberal | Barry MacDougall | 16,693 | 30.3 | +7.5 | ||||
| New Democratic | Gill Sandeman | 15,147 | 27.5 | +6.8 | ||||
| Libertarian | Mike Lantz | 277 | 0.5 | -2.4 | ||||
| Rhinoceros | C. Fibber McGee | 238 | 0.4 | -0.2 | ||||
| Green | George Kerr | 208 | 0.4 | 0.0 | ||||
| Total valid votes | 55,055 | 100.0 | ||||||
| 1984 Canadian federal election | ||||||||
|---|---|---|---|---|---|---|---|---|
| Party | Candidate | Votes | % | ±% | ||||
| Progressive Conservative | Bill Domm | 27,121 | 52.7 | +12.4 | ||||
| Liberal | Barry MacDougall | 11,737 | 22.8 | -12.9 | ||||
| New Democratic | Linda Slavin | 10,648 | 20.7 | -1.6 | ||||
| Libertarian | John Hayes | 1,479 | 2.9 | +1.9 | ||||
| Rhinoceros | Washboard Fisher | 309 | 0.6 | +0.1 | ||||
| Green | Simon Shields | 175 | 0.3 | |||||
| Total valid votes | 51,469 | 100.0 | ||||||
| 1980 Canadian federal election | ||||||||
|---|---|---|---|---|---|---|---|---|
| Party | Candidate | Votes | % | ±% | ||||
| Progressive Conservative | Bill Domm | 19,417 | 40.2 | -4.2 | ||||
| Liberal | Sylvia Sutherland | 17,202 | 35.7 | -1.0 | ||||
| New Democratic | Paul Rexe | 10,776 | 22.3 | +5.4 | ||||
| Libertarian | Sally Hayes | 469 | 1.0 | -0.6 | ||||
| Rhinoceros | Mark Elson | 243 | 0.5 | +0.2 | ||||
| Independent | Robert J. Norris | 69 | 0.1 | |||||
| Marxist–Leninist | Richard Anthony | 67 | 0.1 | 0.0 | ||||
| Total valid votes | 48,243 | 100.0 | ||||||
| 1979 Canadian federal election | ||||||||
|---|---|---|---|---|---|---|---|---|
| Party | Candidate | Votes | % | ±% | ||||
| Progressive Conservative | Bill Domm | 22,195 | 44.5 | +11.5 | ||||
| Liberal | Hugh Faulkner | 18,288 | 36.6 | -16.3 | ||||
| New Democratic | Cyril Carter | 8,451 | 16.9 | +3.3 | ||||
| Libertarian | John Hayes | 787 | 1.6 | |||||
| Rhinoceros | Brian Flynn | 150 | 0.3 | |||||
| Marxist–Leninist | Richard Anthony | 47 | 0.1 | |||||
| Total valid votes | 49,918 | 100.0 | ||||||
| 1974 Canadian federal election | ||||||||
|---|---|---|---|---|---|---|---|---|
| Party | Candidate | Votes | % | ±% | ||||
| Liberal | Hugh Faulkner | 23,865 | 52.9 | +7.4 | ||||
| Progressive Conservative | Duff Roblin | 14,891 | 33.0 | -7.1 | ||||
| New Democratic | Gill Sandeman | 6,171 | 13.7 | -0.7 | ||||
| Independent | Linda Peevers | 187 | 0.4 | |||||
| Total valid votes | 45,114 | 100.0 | ||||||
| 1972 Canadian federal election | ||||||||
|---|---|---|---|---|---|---|---|---|
| Party | Candidate | Votes | % | ±% | ||||
| Liberal | Hugh Faulkner | 20,282 | 45.5 | +3.4 | ||||
| Progressive Conservative | John Doris | 17,885 | 40.1 | +5.3 | ||||
| New Democratic | Ray Peters | 6,422 | 14.4 | -8.7 | ||||
| Total valid votes | 44,589 | 100.0 | ||||||
| 1968 Canadian federal election | ||||||||
|---|---|---|---|---|---|---|---|---|
| Party | Candidate | Votes | % | ±% | ||||
| Liberal | Hugh Faulkner | 15,675 | 42.1 | +5.1 | ||||
| Progressive Conservative | Archie McLean | 12,972 | 34.8 | -0.2 | ||||
| New Democratic | Bruce Hodgins | 8,593 | 23.1 | -4.9 | ||||
| Total valid votes | 37,240 | 100.0 | ||||||
| 1965 Canadian federal election | ||||||||
|---|---|---|---|---|---|---|---|---|
| Party | Candidate | Votes | % | ±% | ||||
| Liberal | Hugh Faulkner | 12,335 | 37.0 | +7.0 | ||||
| Progressive Conservative | Fred Stenson | 11,693 | 35.1 | -0.9 | ||||
| New Democratic | Arthur Parker | 9,327 | 28.0 | -5.6 | ||||
| Total valid votes | 33,355 | 100.0 | ||||||
| 1963 Canadian federal election | ||||||||
|---|---|---|---|---|---|---|---|---|
| Party | Candidate | Votes | % | ±% | ||||
| Progressive Conservative | Fred Stenson | 11,909 | 35.9 | -2.1 | ||||
| New Democratic | Walter Pitman | 11,131 | 33.6 | -2.7 | ||||
| Liberal | Hugh Faulkner | 9,927 | 29.9 | +4.3 | ||||
| Social Credit | David Hartman | 180 | 0.5 | |||||
| Total valid votes | 33,147 | 100.0 | ||||||
| 1962 Canadian federal election | ||||||||
|---|---|---|---|---|---|---|---|---|
| Party | Candidate | Votes | % | ±% | ||||
| Progressive Conservative | Fred Stenson | 12,185 | 38.1 | +2.6 | ||||
| New Democratic | Walter Pitman | 11,605 | 36.3 | -9.5 | ||||
| Liberal | Hugh Faulkner | 8,215 | 25.7 | +7.0 | ||||
| Total valid votes | 32,005 | 100.0 | ||||||
| By-election on 1960 By-election | ||||||
| Party | Candidate | Votes | % | ±% | ||
|---|---|---|---|---|---|---|
| New | Walter Pitman | 13,207 | 45.8 | +39.2 | ||
| Progressive Conservative | Harold Matthews | 10,246 | 35.5 | -31.3 | ||
| Liberal | Donald Munro | 5,394 | 18.7 | -6.8 | ||
| Total valid votes | 28,847 | 100.0 | ||||
Note: New Party vote is compared to CCF vote in 1958 election.
| 1958 Canadian federal election | ||||||||
|---|---|---|---|---|---|---|---|---|
| Party | Candidate | Votes | % | ±% | ||||
| Progressive Conservative | Gordon Fraser | 19,032 | 66.8 | +8.9 | ||||
| Liberal | Glenn Price | 7,254 | 25.5 | -3.5 | ||||
| Co-operative Commonwealth | John T. Taylor | 1,887 | 6.6 | 0.0 | ||||
| Social Credit | Martin Graves | 326 | 1.1 | -5.4 | ||||
| Total valid votes | 28,499 | 100.0 | ||||||
| 1957 Canadian federal election | ||||||||
|---|---|---|---|---|---|---|---|---|
| Party | Candidate | Votes | % | ±% | ||||
| Progressive Conservative | Gordon Fraser | 16,598 | 57.9 | +5.4 | ||||
| Liberal | Claire Hickman Stuart | 8,301 | 29.0 | -11.6 | ||||
| Co-operative Commonwealth | William Binney | 1,887 | 6.6 | -0.4 | ||||
| Social Credit | Martin Graves | 1,887 | 6.6 | |||||
| Total valid votes | 28,673 | 100.0 | ||||||
| 1953 Canadian federal election | ||||||||
|---|---|---|---|---|---|---|---|---|
| Party | Candidate | Votes | % | |||||
| Progressive Conservative | Gordon Fraser | 13,206 | 52.5 | |||||
| Liberal | Maxwell Swanston | 10,218 | 40.6 | |||||
| Co-operative Commonwealth | Maurice Ketcheson | 1,747 | 6.9 | |||||
| Total valid votes | 25,171 | 100.0 | ||||||
References
- "(Code 35071) Census Profile". 2011 census. Statistics Canada. 2012. Retrieved 2011-03-03.
- House of Commons of Canada historical ridings section
- 2011 results from Elections Canada
- Campaign expense data from Elections Canada
Notes
- Statistics Canada: 2012
- http://www.parl.gc.ca/HousePublications/Publication.aspx?Language=E&Mode=1&DocId=6654879&File=4
- Payton, Laura (September 26, 2013). "Dean Del Mastro quits Tory caucus after Election Act charges". CBC News.
- Laura Payton (31 October 2014). "Dean Del Mastro found guilty in election spending case". CBC News. Retrieved 31 October 2014.
- Payton, Laura and Kady O'Malley (November 5, 2014). "Dean Del Mastro, guilty of breaking election laws, resigns". CBC News.
- "List of confirmed candidates". Elections Canada. Retrieved 3 October 2019.
- Elections Canada – Confirmed candidates for Peterborough—Kawartha, 30 September 2015
- Elections Canada – Preliminary Election Expenses Limits for Candidates
- Pundits' Guide to Canadian Elections