Vaughan (provincial electoral district)
Vaughan was a provincial riding in Ontario, Canada, that was represented in the Legislative Assembly of Ontario between 2007 and 2018.
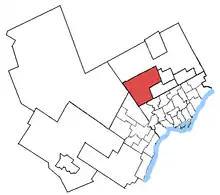 Vaughan in relation to other Greater Toronto ridings | |
| Defunct provincial electoral district | |
| Legislature | Legislative Assembly of Ontario |
| District created | 2003 |
| District abolished | 2018 |
| First contested | 2007 |
| Last contested | 2014 |
| Demographics | |
| Population (2006) | 154,206 |
| Electors (2007) | 100,066 |
| Area (km²) | 230 |
| Census division(s) | York |
| Census subdivision(s) | Vaughan |
.png.webp)
The riding covered the fast-growing region of Vaughan north of Toronto, Ontario.
It consisted of the part of the City of Vaughan that lies west of Highway 400 and north of Rutherford Road.
In 2018, the district was dissolved into Dufferin—Caledon, King—Vaughan and Vaughan—Woodbridge.
Demographics
- According to the Canada 2006 Census
Racial groups: 74.3% White, 9.3% South Asian, 2.7% Latin American, 2.5% Black, 2.4% Southeast Asian, 2.4% Chinese, 1.7% West Asian, 1.7% Filipino, 1.0% Arab
Languages: 44.8% English, 0.5% French, 54.6% Other
Religions (2001): 77.0% Catholic, 7.3% Protestant, 2.7% Muslim, 2.6% Christian Orthodox, 2.1% Sikh, 1.6% Hindu, 1.3% Buddhist, 3.9% No religion
Average income: $34,485
Members of Provincial Parliament
| Vaughan | ||||
|---|---|---|---|---|
| Assembly | Years | Member | Party | |
| Riding created | ||||
| 39th | 2007–2011 | Greg Sorbara | Liberal | |
| 40th | 2011–2012 | |||
| 2012–2014 | Steven Del Duca | Liberal | ||
| 41st | 2014–2018 | |||
| Riding dissolved into Dufferin—Caledon, King—Vaughan and Vaughan—Woodbridge |
||||
Election results
| 2014 Ontario general election | ||||||||
|---|---|---|---|---|---|---|---|---|
| Party | Candidate | Votes | % | ±% | ||||
| Liberal | Steven Del Duca | 33,545 | 55.99 | +4.62 | ||||
| Progressive Conservative | Peter Meffe | 16,654 | 27.80 | -5.49 | ||||
| New Democratic | Marco Coletta | 7,105 | 11.86 | +0.48 | ||||
| Green | Matthew Pankhurst | 1,336 | 2.23 | +0.47 | ||||
| Libertarian | Paolo Fabrizio | 1,277 | 2.13 | +1.19 | ||||
| Total valid votes | 59,917 | 100.0 | ||||||
| Liberal hold | Swing | +5.06 | ||||||
| Source: Elections Ontario[1] | ||||||||
| Ontario provincial by-election, September 6, 2012 Resignation of Greg Sorbara | ||||||||
|---|---|---|---|---|---|---|---|---|
| Party | Candidate | Votes | % | ±% | ||||
| Liberal | Steven Del Duca | 16,469 | 51.37 | -1.65 | ||||
| Progressive Conservative | Tony Genco | 10,674 | 33.29 | +2.05 | ||||
| New Democratic | Paul Donofrio | 3,647 | 11.38 | +0.05 | ||||
| Green | Paula Conning | 564 | 1.76 | +0.35 | ||||
| Libertarian | Paolo Fabrizio | 300 | 0.94 | -0.94 | ||||
| Family Coalition | Bart Wysokinski | 144 | 0.45 | |||||
| Independent | Stephen Tonner | 118 | 0.37 | |||||
| Freedom | Erin Goodwin | 90 | 0.28 | |||||
| People's | Phil Sarazen | 54 | 0.17 | |||||
| Total valid votes | 32,060 | 100.00 | ||||||
| Total rejected, unmarked and declined ballots | 301 | 0.93 | ||||||
| Turnout | 32,361 | 25.62 | ||||||
| Eligible voters | 126,323 | |||||||
| Liberal hold | Swing | -1.85 | ||||||
| Source: Elections Ontario[2] | ||||||||
| 2011 Ontario general election | ||||||||
|---|---|---|---|---|---|---|---|---|
| Party | Candidate | Votes | % | ±% | ||||
| Liberal | Greg Sorbara | 26,174 | 53.02 | -8.88 | ||||
| Progressive Conservative | Tony Genco | 15,420 | 31.24 | +12.52 | ||||
| New Democratic | Paul Donofrio | 5,594 | 11.33 | -0.36 | ||||
| Libertarian | Paolo Fabrizio | 929 | 1.88 | |||||
| Green | Brendan Frye | 694 | 1.41 | -4.95 | ||||
| Reform | David Natale | 218 | 0.44 | |||||
| Confederation of Regions | Terry Marino | 169 | 0.34 | |||||
| Independent | Savino Quatela | 169 | 0.34 | -0.99 | ||||
| Total valid votes | 49,367 | 100.00 | ||||||
| Total rejected, unmarked and declined ballots | 406 | 0.82 | ||||||
| Turnout | 49,773 | 41.08 | -5.23 | |||||
| Eligible voters | 121,154 | |||||||
| Liberal hold | Swing | -10.70 | ||||||
| Source: Elections Ontario[3] | ||||||||
| 2007 Ontario general election | ||||||||
|---|---|---|---|---|---|---|---|---|
| Party | Candidate | Votes | % | |||||
| Liberal | Greg Sorbara | 28,964 | 61.90 | |||||
| Progressive Conservative | Gayani Weerasinghe | 8,759 | 18.72 | |||||
| New Democratic | Rick Morelli | 5,470 | 11.69 | |||||
| Green | Russell Korus | 2,975 | 6.36 | |||||
| Independent | Savino Quatela | 623 | 1.33 | |||||
| Total valid votes | 46,791 | 100.0 | ||||||
| Total rejected ballots | 584 | |||||||
| Turnout | 47,375 | 46.31 | ||||||
| Eligible voters | 102,293 | – | ||||||
2007 electoral reform referendum
| 2007 Ontario electoral reform referendum | |||
|---|---|---|---|
| Side | Votes | % | |
| First Past the Post | 27,507 | 61.9 | |
| Mixed member proportional | 16,960 | 38.1 | |
| Total valid votes | 44,467 | 100.0 | |
Sources
- "General Election Results by District, 097 Vaughan". Elections Ontario. 2014. Archived from the original on 17 June 2014. Retrieved 17 June 2014.
- "Official return from the records / Rapport des registres officiels - Vaughan by-election" (PDF). Elections Ontario. 2012. Retrieved 5 June 2014.
- "Official return from the records / Rapport des registres officiels - Vaughan" (PDF). Elections Ontario. 2011. Retrieved 5 June 2014.