Vaughan (electoral district)
Vaughan was a federal electoral district in Ontario, Canada, that has been represented in the House of Commons of Canada from 2004 until 2015.
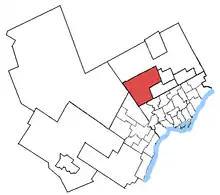 Vaughan in relation to other Greater Toronto ridings | |
| District created | 2003 |
| District abolished | 2013 |
| First contested | 2004 |
| Last contested | 2011 |
| District webpage | profile, map |
| Demographics | |
| Population (2011)[1] | 196,068 |
| Electors (2011) | 123,096 |
| Area (km²)[2] | 218.46 |
| Census division(s) | York |
| Census subdivision(s) | Vaughan |
.png.webp)
The riding covered the fast-growing region of Vaughan north of Toronto, Ontario.
The riding was created in 2003 from parts of Vaughan—King—Aurora riding. It consisted of the part of the City of Vaughan that lies west of Highway 400 or north of Rutherford Road.
Political geography
The riding was divided between the rural and urban parts. The Conservative concentrations in the riding can be found in the more rural parts, in the north and east parts of the riding, like the community of Kleinburg. The rest of the riding, the more suburban southern part is strongly Liberal.
Demographics
- According to the Canada 2006 Census
Racial groups: 74.3% White, 9.3% South Asian, 2.7% Latin American, 2.5% Black, 2.4% Southeast Asian, 2.4% Chinese, 1.7% West Asian, 1.7% Filipino, 1.0% Arab
Languages: 44.8% English, 0.5% French, 54.6% Other
Religions (2001): 77.0% Catholic, 7.3% Protestant, 2.7% Muslim, 2.6% Christian Orthodox, 2.1% Sikh, 1.6% Hindu, 1.3% Buddhist, 3.9% No religion
Average income: $34,485
The Vaughan riding had the highest percentage of Italian Canadians in all of Canada (54.4%).[3] 17.1% of its residents are Italian immigrants,[4] the highest such percentage for a Canadian federal riding, and 19.2% of its residents having Italian as their mother tongue.[5]
Members of Parliament
This riding has elected the following Members of Parliament:
| Parliament | Years | Member | Party | |
|---|---|---|---|---|
| Vaughan Riding created from Vaughan—King—Aurora |
||||
| 38th | 2004–2006 | Maurizio Bevilacqua | Liberal | |
| 39th | 2006–2008 | |||
| 40th | 2008–2010 | |||
| 2010–2011 | Julian Fantino | Conservative | ||
| 41st | 2011–2015 | |||
| Riding dissolved into Dufferin—Caledon, King—Vaughan and Vaughan—Woodbridge |
||||
Election results
| 2011 Canadian federal election | ||||||||
|---|---|---|---|---|---|---|---|---|
| Party | Candidate | Votes | % | ±% | Expenditures | |||
| Conservative | Julian Fantino | 38,533 | 56.32 | +7.22 | – | |||
| Liberal | Mario Ferri | 20,435 | 29.87 | -16.78 | – | |||
| New Democratic | Mark Pratt | 7,940 | 11.60 | +9.92 | – | |||
| Green | Claudia Rodriguez-Larrain | 1,515 | 2.21 | +0.99 | – | |||
| Total valid votes | 68,423 | 100.00 | – | |||||
| Total rejected ballots | 480 | 0.70 | +0.12 | |||||
| Turnout | 68,903 | 55.98 | +23.48 | |||||
| Conservative hold | Swing | |||||||
| Canadian federal by-election, November 29, 2010 due to the resignation of Maurizio Bevilacqua on September 2, 2010 | ||||||||
|---|---|---|---|---|---|---|---|---|
| Party | Candidate | Votes | % | ±% | Expenditures | |||
| Conservative | Julian Fantino | 19,290 | 49.10 | +14.77 | – | |||
| Liberal | Tony Genco | 18,326 | 46.65 | -2.53 | – | |||
| New Democratic | Kevin Bordian | 661 | 1.68 | -7.96 | – | |||
| Green | Claudia Rodriguez-Larrain | 481 | 1.22 | -5.64 | – | |||
| Libertarian | Paolo Fabrizio | 251 | 0.64 | – | – | |||
| Independent | Leslie Bory | 111 | 0.28 | – | – | |||
| Progressive Canadian | Dorian Baxter | 110 | 0.28 | – | – | |||
| United | Brian Jedan | 55 | 0.14 | – | – | |||
| Total valid votes/Expense limit | 39,285 | 100.00 | $114,412 | |||||
| Total rejected ballots | 231 | 0.58 | -0.16 | |||||
| Turnout | 39,516 | 32.50 | -19.42 | |||||
| Conservative gain from Liberal | Swing | -8.6 | ||||||
| 2008 Canadian federal election | ||||||||
|---|---|---|---|---|---|---|---|---|
| Party | Candidate | Votes | % | ±% | Expenditures | |||
| Liberal | Maurizio Bevilacqua | 27,773 | 49.18 | -10.54 | $36,208 | |||
| Conservative | Richard Lorello | 19,390 | 34.33 | +8.28 | $65,173 | |||
| New Democratic | Vicky Wilkin | 5,442 | 9.64 | +1.38 | $1,896 | |||
| Green | Adrian Visentin | 3,870 | 6.85 | +2.00 | $11,775 | |||
| Total valid votes/Expense limit | 56,475 | 100.00 | $103,581 | |||||
| Total rejected ballots | 421 | 0.74 | -0.02 | |||||
| Turnout | 56,906 | 51.92 | -12.09 | |||||
| Liberal hold | Swing | -9.4 | ||||||
| 2006 Canadian federal election | ||||||||
|---|---|---|---|---|---|---|---|---|
| Party | Candidate | Votes | % | ±% | ||||
| Liberal | Maurizio Bevilacqua | 36,968 | 59.72 | -3.24 | ||||
| Conservative | Richard Majkot | 16,124 | 26.05 | +2.37 | ||||
| New Democratic | Yurgo Alexopoulos | 5,114 | 8.26 | -0.50 | ||||
| Green | Adrian Visentin | 3,004 | 4.85 | +1.40 | ||||
| Libertarian | Paolo Fabrizio | 688 | 1.11 | +0.33 | ||||
| Total valid votes | 62,031 | 100.00 | ||||||
| Total rejected ballots | 472 | 0.76 | -0.34 | |||||
| Turnout | 62,370 | 64.01 | +8.00 | |||||
| Liberal hold | Swing | -2.8 | ||||||
| 2004 Canadian federal election | ||||||||
|---|---|---|---|---|---|---|---|---|
| Party | Candidate | Votes | % | ±% | ||||
| Liberal | Maurizio Bevilacqua | 31,430 | 62.96 | -12.96 | ||||
| Conservative | Joe Spina | 11,821 | 23.68 | +3.20 | ||||
| New Democratic | Octavia Beckles | 4,371 | 8.76 | +5.78 | ||||
| Green | Russell Korus | 1,722 | 3.45 | – | ||||
| Libertarian | Paolo Fabrizio | 388 | 0.78 | – | ||||
| Canadian Action | Walter Aolari | 192 | 0.38 | – | ||||
| Total valid votes | 49,924 | 100.00 | ||||||
| Total rejected ballots | 556 | 1.10 | ||||||
| Turnout | 50,480 | 56.01 | ||||||
| Liberal hold | Swing | -8.1 | ||||||
^ % Change is based on redistributed results. Conservative change is from a combination of Progressive Conservative and Canadian Alliance parties.
References
- "(Code 35096) Census Profile". 2011 census. Statistics Canada. 2012. Retrieved 2011-03-03.
Notes
- Statistics Canada: 2012
- Statistics Canada: 2012
- "2Profile of Ethnic Origin and Visible Minorities for Canada, Provinces, Territories and Federal Electoral Districts (2003 Representation Order), 2006 Census". 2.statcan.gc.ca. Retrieved 2012-12-02.
- "Immigrant Status and Place of Birth (38), Sex (3) and Age Groups (10) for the Population of Canada, Provinces, Territories and Federal Electoral Districts (2003 Representation Order), 2006 Census - 20% Sample Data". 2.statcan.gc.ca. Retrieved 2012-11-23.
- "2011 Census of Canada: Topic-based tabulations | Detailed Mother Tongue (232), Knowledge of Official Languages (5), Age Groups (17A) and Sex (3) for the Population Excluding Institutional Residents of Canada, Provinces, Territories and Federal Electoral Districts (2003 Representation Order), 2011 Census". 2.statcan.gc.ca. Retrieved 2012-11-16.