Pennington County, South Dakota
Pennington County is a county in the U.S. state of South Dakota. As of the 2010 United States Census, the population was 100,948,[1] making it the second-most populous county in South Dakota. Its county seat is Rapid City.[2] The county was created in 1875, and was organized in 1877.[3] It is named for John L. Pennington, fifth Governor of Dakota Territory, who held office in 1875 when the county was formed.[4]
Pennington County | |
|---|---|
 Pennington County Court House. | |
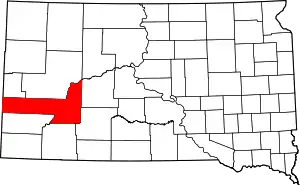 Location within the U.S. state of South Dakota | |
 South Dakota's location within the U.S. | |
| Coordinates: 44°01′N 102°49′W | |
| Country | |
| State | |
| Founded | 1875 (created) 1877 (organized) |
| Named for | John L. Pennington |
| Seat | Rapid City |
| Largest city | Rapid City |
| Area | |
| • Total | 2,784 sq mi (7,210 km2) |
| • Land | 2,777 sq mi (7,190 km2) |
| • Water | 7.7 sq mi (20 km2) 0.3% |
| Population (2010) | |
| • Total | 100,948 |
| • Estimate (2018) | 111,729 |
| • Density | 40/sq mi (20/km2) |
| Time zone | UTC−7 (Mountain) |
| • Summer (DST) | UTC−6 (MDT) |
| Congressional district | At-large |
| Website | www |
Pennington County is included in the Rapid City, SD Metropolitan Statistical Area. It is also the location of Mount Rushmore.
History
In 1874, US Army commander George A. Custer led a group into the Black Hills area. He and some of his officers climbed the crest now called Black Elk Peak, and made a toast to US General William S. Harney. They named the peak for Harney, and this name was used until 2016. This expedition reported that gold could be found in the Black Hills, which spurred a gold rush into the future county area. The mining settlements that sprang up were in violation of a treaty signed with the Sioux Nation in 1868. By 1875, settlement was sufficient to justify creation of a local governing organization, so Pennington County was created on January 11, 1875, and it was fully organized by April 19, 1877. The county's boundaries were adjusted in 1877 and in 1898.
The county seat was initially at Sheridan, a mining camp.[5] (Sheridan is credited with hosting the first Federal Court west of the Missouri River.) In 1878, the county seat was moved to Rapid City.[6] [7]
In 1923, Doane Robinson, superintendent of the SD State Historical Society, began promoting the concept of a giant sculpture carved from a Black Hills mountain. By 1927 this concept took substance, when work on Mount Rushmore began.
Shortly after the US entered World War II, an Army training airbase was established in Pennington County. It has continued until the present, now known as Ellsworth Air Force Base. Supporting this activity has provided a substantial portion of the county's economic base since that time.[6]
Geography
Pennington County is located on the west line of South Dakota. Its west boundary line abuts the east boundary line of the state of Wyoming. Its west end contains the nation's highest peak east of the continental divide, Black Elk Peak. The rugged arid western end contains forest and gullies, descendending to rough rolling hill country in the east. The Cheyenne River flows north-northeastward through the center of the county and then along its northeastern border on its way to discharge in the Missouri River, while Rapid Creek flows east-southeastward through the western part, to discharge into the Cheyenne at the county's midpoint.[8] The county terrain varies in elevation from Black Elk Peak at 7,242' (2207m) to its NE corner, at 1,896' (578m) ASL.[9]
Pennington County has a total area of 2,784 square miles (7,210 km2), of which 2,777 square miles (7,190 km2) is land and 7.7 square miles (20 km2) (0.3%) is water.[10] It is the third-largest county in South Dakota by area.
Major highways
Adjacent counties
- Meade County – north
- Ziebach County - northeast
- Haakon County – northeast
- Jackson County – southeast
- Oglala Lakota County – south
- Custer County – southwest
- Weston County, Wyoming – west
- Lawrence County – northwest
National protected areas
Lakes and reservoirs[8]
- Deerfield Lake
- Pactola Reservoir
- Shearer Lake
- Sheridan Lake
Demographics
| Historical population | |||
|---|---|---|---|
| Census | Pop. | %± | |
| 1880 | 2,244 | — | |
| 1890 | 6,540 | 191.4% | |
| 1900 | 5,610 | −14.2% | |
| 1910 | 12,453 | 122.0% | |
| 1920 | 12,720 | 2.1% | |
| 1930 | 20,079 | 57.9% | |
| 1940 | 23,799 | 18.5% | |
| 1950 | 34,053 | 43.1% | |
| 1960 | 58,195 | 70.9% | |
| 1970 | 59,349 | 2.0% | |
| 1980 | 70,361 | 18.6% | |
| 1990 | 81,343 | 15.6% | |
| 2000 | 88,565 | 8.9% | |
| 2010 | 100,948 | 14.0% | |
| 2019 (est.) | 113,775 | [11] | 12.7% |
| US Decennial Census[12] 1790-1960[13] 1900-1990[14] 1990-2000[15] 2010-2018[1] | |||
2000 census
As of the 2000 United States Census,[16] there were 88,565 people, 34,641 households, and 23,278 families in the county. The population density was 32 people per square mile (12/km2). There were 37,249 housing units at an average density of 13 per square mile (5/km2). The racial makeup of the county was 86.70% White, 0.85% Black or African American, 8.09% Native American, 0.88% Asian, 0.06% Pacific Islander, 0.68%% from other races, and 2.74% from two or more races. 2.64% of the population were Hispanic or Latino of any race.
There were 34,641 households, out of which 33.50% had children under the age of 18 living with them, 51.30% were married couples living together, 11.70% had a female householder with no husband present, and 32.80% were non-families. 26.10% of all households were made up of individuals, and 8.40% had someone living alone who was 65 years of age or older. The average household size was 2.49 and the average family size was 3.00.
The county population contained 26.60% under the age of 18, 10.50% from 18 to 24, 29.20% from 25 to 44, 21.90% from 45 to 64, and 11.80% who were 65 years of age or older. The median age was 35 years. For every 100 females, there were 98.30 males. For every 100 females age 18 and over, there were 95.70 males.
The median income for a household in the county was $37,485, and the median income for a family was $44,796. Males had a median income of $30,608 versus $21,540 for females. The per capita income for the county was $18,938. About 8.60% of families and 11.50% of the population were below the poverty line, including 15.60% of those under age 18 and 6.50% of those age 65 or over.
2010 census
As of the 2010 United States Census, there were 100,948 people, 41,251 households, and 26,323 families in the county.[17] The population density was 36.4 inhabitants per square mile (14.1/km2). There were 44,949 housing units at an average density of 16.2 per square mile (6.3/km2).[18] The racial makeup of the county was 83.6% white, 9.7% American Indian, 1.0% black or African American, 1.0% Asian, 0.1% Pacific islander, 0.8% from other races, and 3.8% from two or more races. Those of Hispanic or Latino origin made up 4.0% of the population.[17] In terms of ancestry, 38.0% were German, 14.3% were Irish, 11.0% were Norwegian, 10.2% were English, and 3.6% were American.[19]
Of the 41,251 households, 31.5% had children under the age of 18 living with them, 47.1% were married couples living together, 11.7% had a female householder with no husband present, 36.2% were non-families, and 29.0% of all households were made up of individuals. The average household size was 2.38 and the average family size was 2.93. The median age was 36.8 years.[17]
The median income for a household in the county was $46,849 and the median income for a family was $57,278. Males had a median income of $38,626 versus $30,251 for females. The per capita income for the county was $25,894. About 9.4% of families and 14.0% of the population were below the poverty line, including 20.7% of those under age 18 and 7.6% of those age 65 or over.[20]
Search and rescue
The Pennington County Search and Rescue (PCSAR) team, a volunteer search and rescue (SAR) team based in Rapid City, was established in 1973, prompted by a 1972 flood in Rapid City.
Communities
Cities
- Box Elder
- Hill City
- New Underwood
- Rapid City (county seat)
Census-designated places
Unincorporated communities[8]
- Ajax
- Colonial Pine Hills
- Creighton
- Ellsworth AFB
- Hisega
- Imlay
- Owanka
- Merritt (partial)
- Mystic
- Pedro
- Rochford
- Rockerville
- Scenic
- Silver City
- Three Forks
- Wicksville
Ghost towns
Townships
- Ash
- Castle Butte
- Cedar Butte
- Conata
- Crooked Creek
- Fairview
- Flat Butte
- Huron
- Imlay
- Lake Creek
- Lake Flat
- Lake Hill
- Owanka
- Peno
- Quinn
- Rainy Creek/Cheyenne
- Scenic
- Shyne
- Sunnyside
- Wasta
Unorganized territories
- Central Pennington
- Dalzell Canyon
- East Central Pennington
- Mount Rushmore
- Northeast Pennington
- Rapid City East
- West Pennington
Politics
Pennington County is very conservative for an urban county. It has been strongly Republican for decades, having voted Republican in all but one presidential election since 1936. Indeed, a Democrat has only garnered 40 percent of the county's vote three times since 1948.
| Year | Republican | Democratic | Third parties |
|---|---|---|---|
| 2020 | 61.0% 35,063 | 35.8% 20,606 | 3.2% 1,849 |
| 2016 | 62.4% 29,804 | 29.5% 14,074 | 8.1% 3,865 |
| 2012 | 63.5% 28,232 | 34.0% 15,125 | 2.5% 1,107 |
| 2008 | 59.6% 27,603 | 38.5% 17,802 | 1.9% 875 |
| 2004 | 66.7% 29,976 | 31.6% 14,213 | 1.7% 779 |
| 2000 | 67.6% 24,696 | 30.4% 11,123 | 2.0% 738 |
| 1996 | 54.3% 19,293 | 36.0% 12,784 | 9.7% 3,439 |
| 1992 | 47.9% 18,052 | 29.5% 11,106 | 22.6% 8,511 |
| 1988 | 61.4% 19,510 | 38.0% 12,068 | 0.6% 179 |
| 1984 | 72.2% 21,947 | 27.1% 8,224 | 0.7% 218 |
| 1980 | 67.3% 18,991 | 25.3% 7,121 | 7.4% 2,092 |
| 1976 | 56.3% 13,352 | 42.4% 10,058 | 1.2% 289 |
| 1972 | 61.2% 13,654 | 38.5% 8,592 | 0.4% 80 |
| 1968 | 53.3% 9,671 | 40.2% 7,303 | 6.5% 1,174 |
| 1964 | 47.5% 8,926 | 52.5% 9,881 | |
| 1960 | 60.3% 11,364 | 39.7% 7,478 | |
| 1956 | 67.3% 10,955 | 32.7% 5,332 | |
| 1952 | 71.2% 11,029 | 28.8% 4,470 | |
| 1948 | 56.0% 6,392 | 43.2% 4,929 | 0.8% 92 |
| 1944 | 59.9% 5,246 | 40.1% 3,517 | |
| 1940 | 57.5% 6,603 | 42.5% 4,878 | |
| 1936 | 42.6% 4,442 | 53.3% 5,557 | 4.1% 429 |
| 1932 | 41.0% 3,638 | 58.3% 5,178 | 0.7% 59 |
| 1928 | 67.0% 4,645 | 32.7% 2,266 | 0.4% 25 |
| 1924 | 63.6% 3,201 | 17.0% 854 | 19.5% 980 |
| 1920 | 64.2% 2,568 | 30.1% 1,205 | 5.6% 225 |
| 1916 | 42.7% 1,108 | 51.6% 1,339 | 5.6% 146 |
| 1912 | 0.0% 0 | 48.2% 1,135 | 51.8% 1,222 |
| 1908 | 57.4% 1,702 | 39.1% 1,160 | 3.5% 104 |
| 1904 | 69.0% 1,126 | 24.0% 392 | 7.0% 114 |
| 1900 | 52.9% 898 | 46.2% 784 | 0.9% 15 |
| 1896 | 41.4% 739 | 58.2% 1,038 | 0.5% 8 |
| 1892 | 50.7% 959 | 7.8% 147 | 41.6% 787 |
References
- "State & County QuickFacts". United States Census Bureau. Archived from the original on July 28, 2011. Retrieved November 28, 2013.
- "Find a County". National Association of Counties. Retrieved June 7, 2011.
- "Dakota Territory, South Dakota, and North Dakota: Individual County Chronologies". Dakota Territory Atlas of Historical County Boundaries. The Newberry Library. 2006. Retrieved March 31, 2015.
- "Pennington County, SD History" Archived October 22, 2013, at the Wayback Machine. Pennington County official website. Retrieved January 8, 2011.
- Sheridan became a ghost town after the gold rush; it was inundated in 1939 by Sheridan Lake.
- History - Pennington County (accessed February 8, 2019)
- History of SD Counties/Pennington (accessed February 8, 2019)
- Pennington County SD Google Maps (accessed 8 February 2019)
- ""Find an Altitude" Google Maps (accessed 8 February 2019)". Archived from the original on May 21, 2019. Retrieved February 8, 2019.
- "2010 Census Gazetteer Files". US Census Bureau. August 22, 2012. Retrieved March 28, 2015.
- "Annual Estimates of the Resident Population for Counties: April 1, 2010 to July 1, 2019". Retrieved April 10, 2020.
- "US Decennial Census". US Census Bureau. Retrieved March 28, 2015.
- "Historical Census Browser". University of Virginia Library. Retrieved March 28, 2015.
- Forstall, Richard L., ed. (March 27, 1995). "Population of Counties by Decennial Census: 1900 to 1990". US Census Bureau. Retrieved March 28, 2015.
- "Census 2000 PHC-T-4. Ranking Tables for Counties: 1990 and 2000" (PDF). US Census Bureau. April 2, 2001. Retrieved March 28, 2015.
- "U.S. Census website". US Census Bureau. Retrieved May 14, 2011.
- "Profile of General Population and Housing Characteristics: 2010 Demographic Profile Data". US Census Bureau. Archived from the original on February 13, 2020. Retrieved March 12, 2016.
- "Population, Housing Units, Area, and Density: 2010 - County". US Census Bureau. Archived from the original on February 13, 2020. Retrieved March 12, 2016.
- "Selected Social Characteristics in the US – 2006-2010 American Community Survey 5-Year Estimates". US Census Bureau. Archived from the original on February 13, 2020. Retrieved March 12, 2016.
- "Selected Economic Characteristics – 2006-2010 American Community Survey 5-Year Estimates". US Census Bureau. Archived from the original on February 13, 2020. Retrieved March 12, 2016.
- Leip, David. "Atlas of US Presidential Elections". uselectionatlas.org. Retrieved April 11, 2018.
External links
- Pennington County, SD government website
- Badlands Visitor Information Badlands Visitor Information and Recommendations
Places adjacent to Pennington County, South Dakota | ||||||||||
|---|---|---|---|---|---|---|---|---|---|---|
| ||||||||||
Municipalities and communities of Pennington County, South Dakota, United States | ||
|---|---|---|
| Cities | | |
| Towns | ||
| CDPs | ||
| Former CDP | ||
| Unincorporated communities | ||
| Ghost towns | ||
| Footnotes | ‡This populated place also has portions in an adjacent county or counties | |
| ||

| Authority control |
|---|