Lawrence County, South Dakota
Lawrence County is a county in the U.S. state of South Dakota. As of the 2010 United States Census, the population was 24,097.[1] Its county seat is Deadwood.[2]
Lawrence County | |
|---|---|
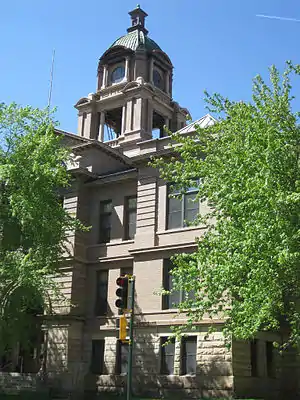 Lawrence County Courthouse in Deadwood | |
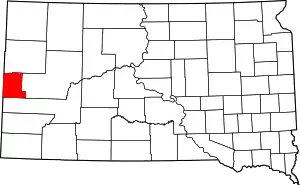 Location within the U.S. state of South Dakota | |
 South Dakota's location within the U.S. | |
| Coordinates: 44°22′N 103°47′W | |
| Country | |
| State | |
| Founded | January 11, 1875 (created) 1877 (organized) |
| Named for | John Lawrence |
| Seat | Deadwood |
| Largest city | Spearfish |
| Area | |
| • Total | 800 sq mi (2,000 km2) |
| • Land | 800 sq mi (2,000 km2) |
| • Water | 0.3 sq mi (0.8 km2) 0.03% |
| Population (2010) | |
| • Total | 24,097 |
| • Estimate (2018) | 25,741 |
| • Density | 30/sq mi (12/km2) |
| Time zone | UTC−7 (Mountain) |
| • Summer (DST) | UTC−6 (MDT) |
| Congressional district | At-large |
| Website | www |
Lawrence County is coextensive with the Spearfish, SD Micropolitan Statistical Area, which is also included in the Rapid City-Spearfish, SD Combined Statistical Area.
History
Lawrence County was created January 11, 1875, and was organized in 1877.[3] The county was named for "Colonel" John Lawrence,[4] who came to the county as first treasurer in 1877. Lawrence had previously served in the Dakota Territorial Legislature, as a Sergeant at Arms for the United States House of Representatives, and a US Marshal for the Dakota territory. After retirement, he continued to act as county road supervisor and as an election judge. The title "Colonel" was honorary, bestowed by the governor of the Dakota Territory.
Geography
Lawrence County lies on the west side of South Dakota. Its west boundary line abuts the east boundary line of the state of Wyoming. The terrain of Lawrence County consists of mountains in the south and west, falling off to the hilly northeast portion. A tributary of the Redwater River flows east-northeasterly along a portion of the county's north boundary line, delineating that portion of the line.[5] The terrain generally slopes to the county's northeast corner; its highest point is on a ridge on the south boundary line near its southwest corner, at 6,581' (2006m) ASL.[6] The county has a total area of 800 square miles (2,100 km2), of which 800 square miles (2,100 km2) is land and 0.3 square miles (0.78 km2) (0.03%) is water.[7]
Major highways
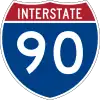 Interstate 90
 U.S. Highway 14
- U.S. Highway 14A
 U.S. Highway 85
 U.S. Highway 385
 South Dakota Highway 34
Adjacent counties
- Butte County - north
- Meade County - east
- Pennington County - south
- Weston County, Wyoming - southwest
- Crook County, Wyoming - west
Protected areas[5]
- Black Hills National Forest (partial)
- Beilage Hepler State Game Production Area
- Coxes-Mirror Lakes State Game Production Area
- Harrison-Badger-Trucano State Game Production Area
- Iron Creek Lake State Game Production Area
- Reausaw Lake State Game Production Area
- Spearfish Canyon State Nature Area
Demographics
| Historical population | |||
|---|---|---|---|
| Census | Pop. | %± | |
| 1880 | 13,218 | — | |
| 1890 | 11,673 | −11.7% | |
| 1900 | 17,897 | 53.3% | |
| 1910 | 19,694 | 10.0% | |
| 1920 | 13,029 | −33.8% | |
| 1930 | 13,920 | 6.8% | |
| 1940 | 19,093 | 37.2% | |
| 1950 | 16,648 | −12.8% | |
| 1960 | 17,075 | 2.6% | |
| 1970 | 17,453 | 2.2% | |
| 1980 | 18,339 | 5.1% | |
| 1990 | 20,655 | 12.6% | |
| 2000 | 21,802 | 5.6% | |
| 2010 | 24,097 | 10.5% | |
| 2019 (est.) | 25,844 | [8] | 7.2% |
| US Decennial Census[9] 1790-1960[10] 1900-1990[11] 1990-2000[12] 2010-2018[1] | |||
2000 census
As of the 2000 United States Census,[13] there were 21,802 people, 8,881 households, and 5,559 families in the county. The population density was 27 people per square mile (11/km2). There were 10,427 housing units at an average density of 13 per square mile (5/km2). The racial makeup of the county was 95.79% White, 0.23% Black or African American, 2.18% Native American, 0.33% Asian, 0.05% Pacific Islander, 0.33% from other races, and 1.08% from two or more races. 1.82% of the population were Hispanic or Latino of any race. 36.0% were of German, 12.0% Norwegian, 9.0% English and 7.5% Irish ancestry.
There were 8,881 households, out of which 28.80% had children under the age of 18 living with them, 51.00% were married couples living together, 8.50% had a female householder with no husband present, and 37.40% were non-families. 29.60% of all households were made up of individuals, and 11.50% had someone living alone who was 65 years of age or older. The average household size was 2.33 and the average family size was 2.89.
The county population contained 23.10% under the age of 18, 13.70% from 18 to 24, 25.40% from 25 to 44, 23.10% from 45 to 64, and 14.60% who were 65 years of age or older. The median age was 37 years. For every 100 females there were 96.80 males. For every 100 females age 18 and over, there were 93.30 males.
The median income for a household in the county was $31,755, and the median income for a family was $40,501. Males had a median income of $30,098 versus $19,679 for females. The per capita income for the county was $17,195. About 9.50% of families and 14.80% of the population were below the poverty line, including 15.70% of those under age 18 and 9.10% of those age 65 or over.
2010 census
As of the 2010 United States Census, there were 24,097 people, 10,536 households, and 6,181 families in the county.[14] The population density was 30.1 inhabitants per square mile (11.6/km2). There were 12,756 housing units at an average density of 15.9 per square mile (6.1/km2).[15] The racial makeup of the county was 94.4% white, 2.0% American Indian, 0.7% Asian, 0.4% black or African American, 0.5% from other races, and 2.0% from two or more races. Those of Hispanic or Latino origin made up 2.5% of the population.[14] In terms of ancestry, 44.5% were German, 13.7% were Irish, 13.4% were English, 11.4% were Norwegian, and 4.4% were American.[16]
Of the 10,536 households, 24.0% had children under the age of 18 living with them, 46.6% were married couples living together, 8.1% had a female householder with no husband present, 41.3% were non-families, and 33.2% of all households were made up of individuals. The average household size was 2.19 and the average family size was 2.77. The median age was 41.0 years.[14]
The median income for a household in the county was $42,356 and the median income for a family was $60,209. Males had a median income of $38,933 versus $28,649 for females. The per capita income for the county was $25,465. About 8.4% of families and 15.3% of the population were below the poverty line, including 15.8% of those under age 18 and 8.1% of those age 65 or over.[17]
Communities
Cities
- Central City
- Deadwood (county seat)
- Lead
- Spearfish
- Whitewood
Census-designated places
Unincorporated communities[5]
- Beaver Crossing
- Benchmark
- Brownsville
- Cheyenne Crossing
- Chinatown
- Crook City
- Dumont
- Elmore
- Englewood
- Galena
- Gayville
- Hanna
- Nemo
- Preston
- Roubaix
- Savoy
Ghost towns
Townships and unorganized territories
- St. Onge Township
- North Lawrence (unorganized territory)
- South Lawrence (unorganized territory)
Politics
Lawrence County voters have been reliably Republican for a full century. It was the only South Dakota county to remain loyal to Herbert Hoover in his landslide 1932 loss.[18] In fact, Lawrence County was the second-westernmost county, behind only Utah’s Kane County, to never vote for Franklin D. Roosevelt. The only Democratic Presidential candidates to carry Lawrence County have been Woodrow Wilson in 1912 and 1916, and William Jennings Bryan in 1896. Lawrence County has also been one of the most consistent strongholds for the Libertarian Party, giving their 2016 nominee, Gary Johnson, one of the largest vote share out of any county outside his home state of New Mexico, with 7.9%. In 2020, Libertarian Party nominee Jo Jorgensen received 3.9% of the popular vote, her best performance in any county during the election cycle.
| Year | Republican | Democratic | Third parties |
|---|---|---|---|
| 2020 | 63.3% 8,753 | 32.8% 4,537 | 3.9% 538 |
| 2016 | 62.6% 7,411 | 28.3% 3,356 | 9.1% 1,075 |
| 2012 | 61.9% 7,025 | 35.0% 3,973 | 3.2% 361 |
| 2008 | 56.3% 6,787 | 40.9% 4,932 | 2.8% 336 |
| 2004 | 64.5% 7,489 | 33.2% 3,857 | 2.4% 273 |
| 2000 | 67.3% 6,327 | 29.7% 2,797 | 3.0% 282 |
| 1996 | 46.9% 4,430 | 37.8% 3,568 | 15.3% 1,444 |
| 1992 | 39.0% 3,770 | 32.7% 3,157 | 28.3% 2,732 |
| 1988 | 59.4% 5,570 | 39.5% 3,705 | 1.1% 104 |
| 1984 | 69.4% 5,949 | 29.9% 2,565 | 0.6% 55 |
| 1980 | 63.1% 5,306 | 26.9% 2,259 | 10.0% 838 |
| 1976 | 56.5% 4,206 | 41.6% 3,102 | 1.9% 141 |
| 1972 | 65.2% 4,795 | 34.5% 2,533 | 0.3% 24 |
| 1968 | 60.2% 4,185 | 34.9% 2,425 | 4.9% 338 |
| 1964 | 51.9% 3,743 | 48.1% 3,468 | |
| 1960 | 66.1% 5,083 | 33.9% 2,612 | |
| 1956 | 71.3% 4,654 | 28.7% 1,871 | |
| 1952 | 76.6% 5,559 | 23.4% 1,701 | |
| 1948 | 62.5% 3,778 | 36.5% 2,209 | 1.0% 58 |
| 1944 | 65.4% 3,528 | 34.6% 1,866 | |
| 1940 | 60.1% 5,288 | 39.9% 3,515 | |
| 1936 | 56.2% 4,974 | 43.0% 3,809 | 0.8% 69 |
| 1932 | 54.0% 3,708 | 45.2% 3,106 | 0.8% 54 |
| 1928 | 69.6% 4,141 | 30.0% 1,785 | 0.4% 21 |
| 1924 | 71.1% 3,255 | 14.2% 649 | 14.8% 676 |
| 1920 | 68.5% 2,986 | 27.6% 1,201 | 4.0% 172 |
| 1916 | 47.5% 2,074 | 49.4% 2,157 | 3.1% 134 |
| 1912 | 54.0% 2,412 | 46.1% 2,059 | |
| 1908 | 50.9% 2,735 | 29.1% 1,564 | 20.1% 1,078 |
| 1904 | 65.5% 4,247 | 20.8% 1,347 | 13.7% 887 |
| 1900 | 56.0% 3,435 | 42.7% 2,619 | 1.4% 84 |
| 1896 | 42.9% 2,210 | 56.4% 2,905 | 0.7% 35 |
| 1892 | 51.2% 2,140 | 13.1% 546 | 35.8% 1,495 |
See also
- List of Superfund sites in South Dakota
- National Register of Historic Places listings in Lawrence County, South Dakota
 Media related to Lawrence County, South Dakota at Wikimedia Commons
References
- "State & County QuickFacts". United States Census Bureau. Archived from the original on June 7, 2011. Retrieved November 25, 2013.
- "Find a County". National Association of Counties. Retrieved June 7, 2011.
- "Dakota Territory, South Dakota, and North Dakota: Individual County Chronologies". Dakota Territory Atlas of Historical County Boundaries. The Newberry Library. 2006. Retrieved March 30, 2015.
- Gannett, Henry (1905). The Origin of Certain Place Names in the United States. U.S. Government Printing Office. p. 183.
- Lawrence County SD Google Maps (accessed 5 February 2019)
- ""Find an Altitude" Google Maps (accessed 5 February 2019)". Archived from the original on May 21, 2019. Retrieved February 5, 2019.
- "2010 Census Gazetteer Files". US Census Bureau. August 22, 2012. Retrieved March 28, 2015.
- "Annual Estimates of the Resident Population for Counties: April 1, 2010 to July 1, 2019". Retrieved April 10, 2020.
- "US Decennial Census". US Census Bureau. Retrieved March 28, 2015.
- "Historical Census Browser". University of Virginia Library. Retrieved March 28, 2015.
- Forstall, Richard L., ed. (March 27, 1995). "Population of Counties by Decennial Census: 1900 to 1990". US Census Bureau. Retrieved March 28, 2015.
- "Census 2000 PHC-T-4. Ranking Tables for Counties: 1990 and 2000" (PDF). US Census Bureau. April 2, 2001. Retrieved March 28, 2015.
- "U.S. Census website". US Census Bureau. Retrieved May 14, 2011.
- "Profile of General Population and Housing Characteristics: 2010 Demographic Profile Data". US Census Bureau. Archived from the original on February 13, 2020. Retrieved March 12, 2016.
- "Population, Housing Units, Area, and Density: 2010 - County". US Census Bureau. Archived from the original on February 13, 2020. Retrieved March 12, 2016.
- "Selected Social Characteristics in the US – 2006-2010 American Community Survey 5-Year Estimates". US Census Bureau. Archived from the original on February 13, 2020. Retrieved March 12, 2016.
- "Selected Economic Characteristics – 2006-2010 American Community Survey 5-Year Estimates". US Census Bureau. Archived from the original on February 13, 2020. Retrieved March 12, 2016.
- Phillips, Kevin P.; The Emerging Republican Majority, p. 442 ISBN 1400852293
- Leip, David. "Atlas of US Presidential Elections". uselectionatlas.org. Retrieved April 13, 2018.
Further reading
- Caddey, S.W. et al. (1991). The Homestake Gold Mine, an Early Proterozoic iron-formation-hosted gold deposit, Lawrence County, South Dakota [US Geological Survey Bulletin 1857-J]. Washington DC: US Department of the Interior, US Geological Survey.
External links
Places adjacent to Lawrence County, South Dakota | ||||||||||
|---|---|---|---|---|---|---|---|---|---|---|
| ||||||||||
Municipalities and communities of Lawrence County, South Dakota, United States | ||
|---|---|---|
| Cities | | |
| Township | ||
| CDPs | ||
| Other unincorporated communities | ||
| Ghost towns | ||
| ||

| Authority control |
|---|