Custer County, South Dakota
Custer County is a county in the U.S. state of South Dakota. As of the 2010 United States Census, the population was 8,216.[1] Its county seat is Custer.[2] The county was created in 1875, and was organized in 1877.[3]
Custer County | |
|---|---|
 | |
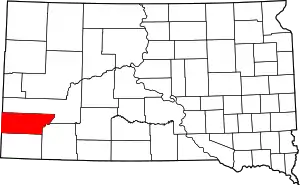 Location within the U.S. state of South Dakota | |
 South Dakota's location within the U.S. | |
| Coordinates: 43°41′N 103°28′W | |
| Country | |
| State | |
| Founded | 1875 (created) 1877 (organized) |
| Named for | George Armstrong Custer |
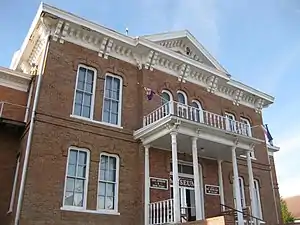
| Seat | Custer |
| Largest city | Custer |
| Area | |
| • Total | 1,559 sq mi (4,040 km2) |
| • Land | 1,557 sq mi (4,030 km2) |
| • Water | 2.1 sq mi (5 km2) 0.1% |
| Population (2010) | |
| • Total | 8,216 |
| • Estimate (2018) | 8,726 |
| • Density | 5.3/sq mi (2.0/km2) |
| Time zone | UTC−7 (Mountain) |
| • Summer (DST) | UTC−6 (MDT) |
| Congressional district | At-large |
| Website | www |
Custer County is included in the Rapid City, SD Metropolitan Statistical Area.
Geography
Custer County lies on the west line of South Dakota. Its west boundary line abuts the east boundary line of the state of Wyoming. The Cheyenne River flows northeastward along the upper portion of the county's east boundary. Battle Creek flows southeastward in the upper eastern part of the county, discharging into Cheyenne River along the county's northeastern boundary line. Spring Creek flows northeastward through the upper eastern part of the county, discharging into the river just north of the county border. The county terrain is mountainous, especially its western portion.[4] The terrain slopes to the east; its lowest point is its NE corner at 2,461' (750m) above sea level (ASL). Its highest point is a mountain crest along the north boundary line, at 6,657' (2029m) ASL.[5]
Custer County has a total area of 1,559 square miles (4,040 km2), of which 1,557 square miles (4,030 km2) is land and 2.1 square miles (5.4 km2) (0.1%) is water.[6]
Major highways
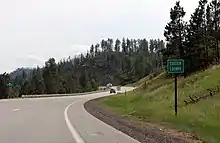
 U.S. Highway 16
 U.S. Highway 385
 U.S. Highway 16A
 South Dakota Highway 36
 South Dakota Highway 40
 South Dakota Highway 79
 South Dakota Highway 87
 South Dakota Highway 89
Adjacent counties
- Pennington County - north
- Oglala Lakota County - southeast
- Fall River County - south
- Niobrara County, Wyoming - southwest
- Weston County, Wyoming - west
Protected areas
Demographics
| Historical population | |||
|---|---|---|---|
| Census | Pop. | %± | |
| 1880 | 995 | — | |
| 1890 | 4,891 | 391.6% | |
| 1900 | 2,728 | −44.2% | |
| 1910 | 4,458 | 63.4% | |
| 1920 | 3,907 | −12.4% | |
| 1930 | 5,353 | 37.0% | |
| 1940 | 6,023 | 12.5% | |
| 1950 | 5,517 | −8.4% | |
| 1960 | 4,906 | −11.1% | |
| 1970 | 4,698 | −4.2% | |
| 1980 | 6,000 | 27.7% | |
| 1990 | 6,179 | 3.0% | |
| 2000 | 7,275 | 17.7% | |
| 2010 | 8,216 | 12.9% | |
| 2019 (est.) | 8,972 | [7] | 9.2% |
| US Decennial Census[8] 1790-1960[9] 1900-1990[10] 1990-2000[11] 2010-2018[1] | |||
2000 census
As of the 2000 United States Census,[12] there were 7,275 people, 2,970 households, and 2,067 families in the county. The population density was 5 people per square mile (2/km2). There were 3,624 housing units at an average density of 2 per square mile (1/km2). The racial makeup of the county was 94.17% White, 0.27% Black or African American, 3.12% Native American, 0.18% Asian, 0.01% Pacific Islander, 0.36% from other races, and 1.88% from two or more races. 1.51% of the population were Hispanic or Latino of any race. 32.2% were of German, 9.8% Irish, 9.2% English, 7.1% Norwegian and 5.7% American ancestry.
There were 2,970 households, out of which 26.90% had children under the age of 18 living with them, 60.20% were married couples living together, 6.60% had a female householder with no husband present, and 30.40% were non-families. 25.90% of all households were made up of individuals, and 10.30% had someone living alone who was 65 years of age or older. The average household size was 2.35 and the average family size was 2.80.
The county population contained 24.10% under the age of 18, 6.30% from 18 to 24, 22.40% from 25 to 44, 31.10% from 45 to 64, and 16.00% who were 65 years of age or older. The median age was 43 years. For every 100 females there were 104.40 males. For every 100 females age 18 and over, there were 99.40 males.
The median income for a household in the county was $36,303, and the median income for a family was $43,628. Males had a median income of $30,475 versus $20,781 for females. The per capita income for the county was $17,945. About 6.20% of families and 9.40% of the population were below the poverty line, including 13.00% of those under age 18 and 7.40% of those age 65 or over.
2010 census
As of the 2010 United States Census, there were 8,216 people, 3,636 households, and 2,427 families in the county.[13] The population density was 5.3 inhabitants per square mile (2.0/km2). There were 4,628 housing units at an average density of 3.0 per square mile (1.2/km2).[14] The racial makeup of the county was 94.2% white, 2.9% American Indian, 0.4% Asian, 0.2% black or African American, 0.4% from other races, and 2.0% from two or more races. Those of Hispanic or Latino origin made up 2.2% of the population.[13] In terms of ancestry, 42.1% were German, 13.1% were Irish, 11.4% were English, 10.8% were Norwegian, and 7.9% were American.[15]
Of the 3,636 households, 21.7% had children under the age of 18 living with them, 58.2% were married couples living together, 5.5% had a female householder with no husband present, 33.3% were non-families, and 28.4% of all households were made up of individuals. The average household size was 2.19 and the average family size was 2.65. The median age was 50.3 years.[13]
The median income for a household in the county was $46,743 and the median income for a family was $58,253. Males had a median income of $39,194 versus $29,375 for females. The per capita income for the county was $24,353. About 4.3% of families and 9.7% of the population were below the poverty line, including 10.9% of those under age 18 and 11.7% of those age 65 or over.[16]
Communities
City
- Custer (county seat)
Towns
- Buffalo Gap (Population: 126)
- Fairburn (Population: 85)
- Hermosa (Population: 398)
- Pringle (Population: 112)
Townships
The county is divided into two areas of territory:
- East of Custer State Park
- West of Custer State Park
Politics
Custer County voters are strongly Republican. In only one national election since 1936 has the county selected the Democratic Party candidate.
| Year | Republican | Democratic | Third parties |
|---|---|---|---|
| 2020 | 70.1% 3,852 | 27.7% 1,522 | 2.2% 120 |
| 2016 | 69.8% 3,293 | 23.7% 1,121 | 6.5% 307 |
| 2012 | 67.7% 3,062 | 29.5% 1,335 | 2.7% 123 |
| 2008 | 64.5% 2,909 | 32.7% 1,475 | 2.7% 123 |
| 2004 | 67.9% 2,922 | 29.6% 1,272 | 2.6% 110 |
| 2000 | 69.8% 2,495 | 26.7% 955 | 3.4% 123 |
| 1996 | 51.8% 1,740 | 33.4% 1,122 | 14.7% 495 |
| 1992 | 42.3% 1,422 | 32.1% 1,078 | 25.7% 863 |
| 1988 | 59.5% 1,806 | 38.9% 1,180 | 1.7% 50 |
| 1984 | 71.3% 2,183 | 28.0% 858 | 0.7% 22 |
| 1980 | 69.6% 2,057 | 24.0% 708 | 6.4% 190 |
| 1976 | 57.1% 1,373 | 41.4% 995 | 1.5% 37 |
| 1972 | 64.5% 1,476 | 34.9% 798 | 0.7% 15 |
| 1968 | 55.4% 1,143 | 35.2% 727 | 9.4% 194 |
| 1964 | 49.3% 1,142 | 50.7% 1,176 | |
| 1960 | 63.6% 1,533 | 36.4% 878 | |
| 1956 | 64.0% 1,514 | 36.0% 853 | |
| 1952 | 72.6% 1,725 | 27.4% 652 | |
| 1948 | 56.7% 1,217 | 42.7% 917 | 0.7% 14 |
| 1944 | 64.4% 1,288 | 35.6% 712 | |
| 1940 | 60.9% 1,796 | 39.1% 1,151 | |
| 1936 | 46.9% 1,365 | 52.2% 1,519 | 1.0% 28 |
| 1932 | 38.1% 977 | 60.3% 1,548 | 1.7% 43 |
| 1928 | 66.9% 1,464 | 32.7% 715 | 0.5% 11 |
| 1924 | 53.4% 833 | 15.1% 236 | 31.5% 492 |
| 1920 | 60.8% 784 | 29.7% 383 | 9.5% 122 |
| 1916 | 42.1% 392 | 52.4% 488 | 5.5% 51 |
| 1912 | 0.0% 0 | 45.9% 419 | 54.1% 494 |
| 1908 | 49.4% 487 | 43.4% 428 | 7.2% 71 |
| 1904 | 65.5% 536 | 27.9% 228 | 6.6% 54 |
| 1900 | 53.4% 483 | 45.9% 415 | 0.8% 7 |
| 1896 | 45.3% 429 | 54.4% 515 | 0.3% 3 |
| 1892 | 49.3% 503 | 16.3% 166 | 34.5% 352 |
See also
| Wikimedia Commons has media related to Custer County, South Dakota. |
References
- "State & County QuickFacts". United States Census Bureau. Archived from the original on July 9, 2011. Retrieved November 26, 2013.
- "Find a County". National Association of Counties. Archived from the original on May 31, 2011. Retrieved June 7, 2011.
- "Dakota Territory, South Dakota, and North Dakota: Individual County Chronologies". Dakota Territory Atlas of Historical County Boundaries. The Newberry Library. 2006. Retrieved March 29, 2015.
- Custer County SD Google Maps (accessed February 1, 2019)
- ""Find an Altitude" Google Maps (accessed February 1, 2019)". Archived from the original on May 21, 2019. Retrieved February 1, 2019.
- "2010 Census Gazetteer Files". US Census Bureau. August 22, 2012. Retrieved March 23, 2015.
- "Annual Estimates of the Resident Population for Counties: April 1, 2010 to July 1, 2019". Retrieved April 10, 2020.
- "US Decennial Census". US Census Bureau. Retrieved March 23, 2015.
- "Historical Census Browser". University of Virginia Library. Retrieved March 23, 2015.
- Forstall, Richard L., ed. (March 27, 1995). "Population of Counties by Decennial Census: 1900 to 1990". US Census Bureau. Retrieved March 23, 2015.
- "Census 2000 PHC-T-4. Ranking Tables for Counties: 1990 and 2000" (PDF). US Census Bureau. April 2, 2001. Retrieved March 23, 2015.
- "U.S. Census website". US Census Bureau. Retrieved 14 May 2011.
- "Profile of General Population and Housing Characteristics: 2010 Demographic Profile Data". US Census Bureau. Archived from the original on 13 February 2020. Retrieved 11 March 2016.
- "Population, Housing Units, Area, and Density: 2010 - County". US Census Bureau. Archived from the original on 13 February 2020. Retrieved 11 March 2016.
- "Selected Social Characteristics in the US – 2006-2010 American Community Survey 5-Year Estimates". U.S. Census Bureau. Archived from the original on February 13, 2020. Retrieved March 11, 2016.
- "Selected Economic Characteristics – 2006-2010 American Community Survey 5-Year Estimates". US Census Bureau. Archived from the original on February 13, 2020. Retrieved March 11, 2016.
- Leip, David. "Atlas of US Presidential Elections". uselectionatlas.org. Retrieved 13 April 2018.
Places adjacent to Custer County, South Dakota | ||||||||||
|---|---|---|---|---|---|---|---|---|---|---|
| ||||||||||
Municipalities and communities of Custer County, South Dakota, United States | ||
|---|---|---|
| City | | |
| Towns | ||
| Unincorporated communities | ||
| Ghost towns | ||
| ||

| Authority control |
|---|