2012 United States presidential election in Wisconsin
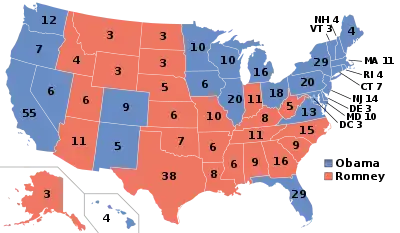
The 2012 United States presidential election in Wisconsin took place on November 6, 2012, as part of the 2012 United States presidential election in which all 50 states plus the District of Columbia participated. Wisconsin voters chose 10 electors to represent them in the Electoral College via a popular vote pitting incumbent Democratic President Barack Obama and his running mate, Vice President Joe Biden, against Republican challenger and former Massachusetts Governor Mitt Romney and his running mate, Congressman Paul Ryan.
| ||||||||||||||||||||||||||
| Turnout | 70.35%[1] | |||||||||||||||||||||||||
|---|---|---|---|---|---|---|---|---|---|---|---|---|---|---|---|---|---|---|---|---|---|---|---|---|---|---|
| ||||||||||||||||||||||||||
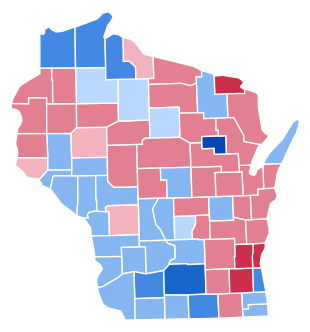 County Results
| ||||||||||||||||||||||||||
| ||||||||||||||||||||||||||
| Elections in Wisconsin |
|---|
 |
Obama won the state of Wisconsin with 52.83% of the vote to Romney's 45.89%, a 6.94% margin of victory.[2] While this represented a reduced margin from Obama's nearly 13.91% sweep in 2008, when he won 59 of 72 counties and 7 of 8 congressional districts, it was still a better performance than that of John Kerry's 0.38% margin in 2004 or Al Gore's 0.22% margin in 2000. Obama's win was also surprisingly comfortable in spite of the fact that Wisconsin was the home state of Republican Vice Presidential nominee Paul Ryan, making him the first Republican Vice Presidential nominee to lose their home state since Jack Kemp lost New York in 1996. Obama's win was attributed to victories in Milwaukee, the state's largest city; Madison, the state capital; northeastern Wisconsin; and the Driftless Region. Romney's strength was concentrated in the loyally Republican Milwaukee suburbs, particularly the WOW counties (Ozaukee, Washington, and Waukesha), where he carried a combined 67.03% of the vote to Obama's 32.00%. He also flipped 24 counties in the Northeast and Central Plain regions, though most of them were rural and therefore insufficient to overcome Obama's aforementioned victories.[3][4]
As of 2020, this is the last time the Democratic presidential nominee won the following counties: Adams, Buffalo, Columbia, Crawford, Dunn, Forest, Grant, Jackson, Juneau, Kenosha, Lafayette, Lincoln, Marquette, Pepin, Price, Racine, Richland, Sawyer, Trempealeau, Vernon, and Winnebago.
Democratic primary
President Barack Obama RAN unopposed in the Democratic Primary, winning 293,914 votes, or 97.89%. Uncommitted ballots received 5,092 votes, or 1.89% of the vote, while 849 votes, 0.28%, were scattered. 111 delegates, all of which were pledged to Obama were sent to the 2012 Democratic National Convention in Charlotte, North Carolina.[5]
Republican primary
| |||||||||||||||||||||||||||||||||||||||||
| |||||||||||||||||||||||||||||||||||||||||
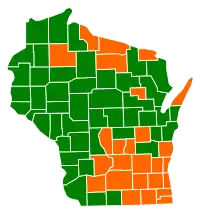 Wisconsin results by county
Mitt Romney
Rick Santorum | |||||||||||||||||||||||||||||||||||||||||
.jpg.webp)
.jpg.webp)
The 2012 Wisconsin Republican 2012 primary took place on April 3, 2012,[6][7] the same day as the primaries in the District of Columbia and Maryland. Mitt Romney edged out a victory, with 44.03% of the vote and 33 delegates, with former Senator Rick Santorum of Pennsylvania coming in second with 36.83% of the vote and 9 delegates. No other candidates won any delegates nor counties, though representative Ron Paul of Texas's 14th district received 11.15% and former Speaker of the House Newt Gingrich received 5.84%. All other candidates received less than 1%. Romney's strength was concentrated in Southeast Wisconsin, carrying Milwaukee and all of its suburbs (including the Kenosha and Racine as well as the ancestrally Republican counties of Ozaukee, Washington, and Waukesha), as well as Madison. Santorum's most significant victories were in Western Wisconsin and in Green Bay and its respective suburbs.[5]
| 2012 Wisconsin Republican primary[5] | |||
|---|---|---|---|
| Candidate | Votes | Percentage | Delegates |
| 346,876 | 44.03% | 33 | |
| Rick Santorum | 290,139 | 36.83% | 9 |
| Ron Paul | 87,858 | 11.15% | 0 |
| Newt Gingrich | 45,978 | 5.84% | 0 |
| Michele Bachmann | 6,045 | 0.77% | 0 |
| Jon Huntsman | 5,083 | 0.65% | 0 |
| Uninstructed | 4,200 | 0.53% | 0 |
| Scattering | 1,668 | 0.21% | 0 |
| Total: | 787,847 | 100% | 42 |
General election
Results
Although Republican Vice Presidential nominee Paul Ryan was from Wisconsin, representing the 1st district in Congress, the Republican Party lost by around a seven-point margin, which was, albeit an improved loss from Obama's landslide 13.91% margin in 2008,[8] a crucial loss.
| 2012 United States presidential election in Wisconsin | ||||||
|---|---|---|---|---|---|---|
| Party | Candidate | Running mate | Votes | Percentage | Electoral votes | |
| Democratic | Barack Obama | Joe Biden | 1,620,985 | 52.83% | 10 | |
| Republican | Mitt Romney | Paul Ryan | 1,407,966 | 45.89% | 0 | |
| Libertarian | Gary Johnson | Jim Gray | 20,439 | 0.67% | 0 | |
| Green | Jill Stein | Cheri Honkala | 7,665 | 0.25% | 0 | |
| Write-Ins | Write-Ins | 5,170 | 0.17% | 0 | ||
| Constitution | Virgil Goode | Jim Clymer | 4,930 | 0.16% | 0 | |
| Socialist Equality | Jerry White | Phyllis Scherrer | 553 | 0.02% | 0 | |
| Socialism and Liberation | Gloria La Riva | Filberto Ramirez Jr. | 526 | 0.02% | 0 | |
| Justice | Rocky Anderson | Luis J. Rodriguez | 112 | 0.00% | 0 | |
| Peace & Freedom | Roseanne Barr | Cindy Sheehan | 88 | 0.00% | 0 | |
| Totals | 3,068,434 | 100.00% | 10 | |||
Results by county
| County[8] | Obama | Votes | Romney | Votes | Others | Votes | Total |
|---|---|---|---|---|---|---|---|
| Adams | 53.87% | 5,542 | 45.14% | 4,644 | 0.98% | 101 | 10,287 |
| Ashland | 64.49% | 5,399 | 33.68% | 2,820 | 1.83% | 153 | 8,372 |
| Barron | 47.99% | 10,890 | 50.43% | 11,443 | 1.58% | 359 | 22,692 |
| Bayfield | 61.64% | 6,033 | 36.84% | 3,606 | 1.52% | 149 | 9,788 |
| Brown | 48.50% | 62,526 | 50.29% | 64,836 | 1.21% | 1,566 | 128,928 |
| Buffalo | 50.72% | 3,570 | 47.79% | 3,364 | 1.49% | 105 | 7,039 |
| Burnett | 45.94% | 3,986 | 52.44% | 4,550 | 1.62% | 141 | 8,677 |
| Calumet | 43.49% | 11,489 | 55.03% | 14,539 | 1.48% | 392 | 26,420 |
| Chippewa | 49.26% | 15,237 | 49.53% | 15,322 | 1.21% | 373 | 30,932 |
| Clark | 44.72% | 6,172 | 53.71% | 7,412 | 1.57% | 217 | 13,801 |
| Columbia | 56.03% | 17,175 | 42.49% | 13,026 | 1.48% | 453 | 30,654 |
| Crawford | 59.22% | 4,629 | 39.24% | 3,067 | 1.55% | 121 | 7,817 |
| Dane | 71.03% | 216,071 | 27.50% | 83,644 | 1.47% | 4,466 | 304,181 |
| Dodge | 42.17% | 18,762 | 56.67% | 25,211 | 1.16% | 515 | 44,488 |
| Door | 52.95% | 9,357 | 45.96% | 8,121 | 1.09% | 193 | 17,671 |
| Douglas | 64.92% | 14,863 | 33.66% | 7,705 | 1.42% | 326 | 22,894 |
| Dunn | 51.46% | 11,316 | 46.49% | 10,224 | 2.06% | 452 | 21,992 |
| Eau Claire | 55.95% | 30,666 | 42.43% | 23,256 | 1.61% | 884 | 54,806 |
| Florence | 36.30% | 953 | 62.67% | 1,645 | 1.03% | 27 | 2,625 |
| Fond du Lac | 41.91% | 22,379 | 56.84% | 30,355 | 1.25% | 668 | 53,402 |
| Forest | 52.17% | 2,425 | 46.73% | 2,172 | 1.10% | 51 | 4,648 |
| Grant | 56.06% | 13,594 | 42.29% | 10,255 | 1.65% | 399 | 24,248 |
| Green | 58.00% | 11,206 | 40.66% | 7,857 | 1.34% | 259 | 19,322 |
| Green Lake | 39.20% | 3,793 | 59.76% | 5,782 | 1.03% | 100 | 9,675 |
| Iowa | 64.66% | 8,105 | 34.20% | 4,287 | 1.13% | 142 | 12,534 |
| Iron | 49.12% | 1,784 | 49.28% | 1,790 | 1.60% | 58 | 3,632 |
| Jackson | 56.89% | 5,298 | 41.88% | 3,900 | 1.23% | 115 | 9,313 |
| Jefferson | 45.52% | 20,158 | 53.11% | 23,517 | 1.37% | 606 | 44,281 |
| Juneau | 52.78% | 6,242 | 45.75% | 5,411 | 1.47% | 174 | 11,827 |
| Kenosha | 55.46% | 44,867 | 43.24% | 34,977 | 1.30% | 1,053 | 80,897 |
| Kewaunee | 46.69% | 5,153 | 52.07% | 5,747 | 1.24% | 137 | 11,037 |
| La Crosse | 57.82% | 36,693 | 40.58% | 25,751 | 1.60% | 1,018 | 63,462 |
| Lafayette | 57.04% | 4,536 | 41.68% | 3,314 | 1.28% | 102 | 7,952 |
| Langlade | 43.47% | 4,573 | 55.29% | 5,816 | 1.24% | 130 | 10,519 |
| Lincoln | 49.70% | 7,563 | 48.99% | 7,455 | 1.30% | 198 | 15,216 |
| Manitowoc | 47.88% | 20,403 | 50.69% | 21,604 | 1.43% | 610 | 42,617 |
| Marathon | 46.32% | 32,363 | 52.41% | 36,617 | 1.26% | 882 | 69,862 |
| Marinette | 47.56% | 9,882 | 51.11% | 10,619 | 1.33% | 276 | 20,777 |
| Marquette | 49.52% | 4,014 | 49.25% | 3,992 | 1.22% | 99 | 8,105 |
| Menominee | 86.49% | 1,191 | 13.00% | 179 | 0.51% | 7 | 1,377 |
| Milwaukee | 67.49% | 332,438 | 31.45% | 154,924 | 1.06% | 5,214 | 492,576 |
| Monroe | 48.83% | 9,515 | 49.65% | 9,675 | 1.51% | 295 | 19,485 |
| Oconto | 44.64% | 8,865 | 54.09% | 10,741 | 1.27% | 253 | 19,859 |
| Oneida | 48.27% | 10,452 | 50.42% | 10,917 | 1.31% | 283 | 21,652 |
| Outagamie | 48.28% | 45,659 | 50.09% | 47,372 | 1.63% | 1,538 | 94,569 |
| Ozaukee | 34.32% | 19,159 | 64.63% | 36,077 | 1.04% | 581 | 55,817 |
| Pepin | 50.72% | 1,876 | 48.50% | 1,794 | 0.78% | 29 | 3,699 |
| Pierce | 48.69% | 10,235 | 49.46% | 10,397 | 1.85% | 388 | 21,020 |
| Polk | 44.62% | 10,073 | 53.58% | 12,094 | 1.80% | 406 | 22,573 |
| Portage | 56.12% | 22,075 | 42.24% | 16,615 | 1.64% | 647 | 39,337 |
| Price | 49.20% | 3,887 | 49.16% | 3,884 | 1.65% | 130 | 7,901 |
| Racine | 51.28% | 53,008 | 47.74% | 49,347 | 0.98% | 1,009 | 103,364 |
| Richland | 57.41% | 4,969 | 41.28% | 3,573 | 1.31% | 113 | 8,655 |
| Rock | 61.00% | 49,219 | 37.82% | 30,517 | 1.18% | 954 | 80,690 |
| Rusk | 47.24% | 3,397 | 51.12% | 3,676 | 1.64% | 118 | 7,191 |
| Sauk | 58.68% | 18,736 | 40.21% | 12,838 | 1.11% | 353 | 31,927 |
| Sawyer | 49.71% | 4,486 | 49.22% | 4,442 | 1.07% | 97 | 9,025 |
| Shawano | 44.38% | 9,000 | 54.35% | 11,022 | 1.27% | 257 | 20,279 |
| Sheboygan | 44.56% | 27,918 | 54.38% | 34,072 | 1.06% | 661 | 62,651 |
| St Croix | 43.07% | 19,910 | 55.17% | 25,503 | 1.76% | 812 | 46,225 |
| Taylor | 39.56% | 3,763 | 58.88% | 5,601 | 1.56% | 148 | 9,512 |
| Trempealeau | 56.41% | 7,605 | 42.33% | 5,707 | 1.25% | 169 | 13,481 |
| Vernon | 56.37% | 8,044 | 41.64% | 5,942 | 1.98% | 283 | 14,269 |
| Vilas | 42.99% | 5,951 | 55.98% | 7,749 | 1.03% | 142 | 13,842 |
| Walworth | 43.12% | 22,552 | 55.46% | 29,006 | 1.42% | 745 | 52,303 |
| Washburn | 47.88% | 4,447 | 50.60% | 4,699 | 1.52% | 141 | 9,287 |
| Washington | 29.42% | 23,166 | 69.55% | 54,765 | 1.03% | 811 | 78,742 |
| Waukesha | 32.31% | 78,779 | 66.76% | 162,798 | 0.93% | 2,279 | 243,856 |
| Waupaca | 44.81% | 11,578 | 54.19% | 14,002 | 1.01% | 260 | 25,840 |
| Waushara | 44.28% | 5,335 | 54.47% | 6,562 | 1.25% | 151 | 12,048 |
| Winnebago | 50.97% | 45,449 | 47.24% | 42,122 | 1.80% | 1,602 | 89,173 |
| Wood | 47.77% | 18,581 | 50.65% | 19,704 | 1.58% | 615 | 38,900 |
| Total | 52.83% | 1,620,985 | 45.89% | 1,407,966 | 1.29% | 39,483 | 3,068,434 |
Counties that swung flipped Democratic to Republican
- Barron (largest city: Rice Lake)[8]
- Brown (largest city: Green Bay)
- Burnett (largest village: Grantsburg)
- Calumet (largest city: Chilton)
- Chippewa (largest city: Chippewa Falls)
- Clark (largest city: Neillsville)
- Iron (largest city: Hurley)
- Jefferson (largest city: Watertown)
- Kewaunee (largest city: Algoma)
- Langlade (largest city: Antigo)
- Manitowoc (largest city: Manitowoc)
- Marathon (largest city: Wausau)
- Marinette (largest city: Marinette)
- Monroe (largest city: Sparta)
- Oconto (largest city: Oconto)
- Oneida (largest city: Rhinelander)
- Outagamie (largest city: Appleton)
- Pierce (largest city: River Falls)
- Rusk (largest city: Ladysmith)
- Shawano (largest city: Shawano)
- Washburn (largest city: Spooner)
- Waupaca (largest city: New London)
- Waushara (largest city: Berlin)
- Wood (largest city: Marshfield)
See also
References
- http://elections.wi.gov/elections-voting/statistics/turnout
- "Wisconsin Gov Accountability Board" (PDF). Retrieved January 16, 2013.
- "More Wisconsin Elections Results". Wisconsin Elections Commission. Retrieved January 11, 2021.
- Savicki, Drew (September 14, 2020). "The Road to 270: Wisconsin". 270toWin. Retrieved January 11, 2021.
- "Canvass Results for 2012 Presidential Preferenrce and Spring Election - 4/3/2012" (PDF). Wisconsin Government Accountability Board. April 3, 2012. Archived from the original (PDF) on March 15, 2016. Retrieved January 11, 2021 – via Wayback Machine.
- "Primary and Caucus Printable Calendar". CNN. Retrieved January 12, 2012.
- "Presidential Primary Dates" (PDF). Federal Election Commission. Retrieved January 23, 2012.
- "Dave Leip's Atlas of U.S. Presidential Elections". Dave Leip's Atlas of U.S. Presidential Elections. Retrieved January 1, 2021.
External links
- The Green Papers: for Wisconsin
- The Green Papers: Major state elections in chronological order