Inyo County, California
Inyo County is a county in the eastern central part of the U.S. state of California, located between the Sierra Nevada mountains and the state of Nevada. In the 2010 census, the population was 18,546.[5] The county seat is Independence.[7] Inyo County is on the east side of the Sierra Nevada and southeast of Yosemite National Park in Central California. It contains the Owens River Valley; it is flanked to the west by the Sierra Nevada and to the east by the White Mountains and the Inyo Mountains. With an area of 10,192 square miles (26,397 km2), Inyo County is the second-largest county by area in California, after San Bernardino County. Almost one-half of that area is within Death Valley National Park. However, with a population density of 1.8 people per square mile, it also has the second-lowest population density in California, after Alpine County.
County of Inyo | |
|---|---|
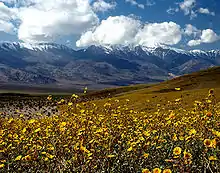 Wildflowers blooming in Death Valley after a wet winter | |
 Seal | |
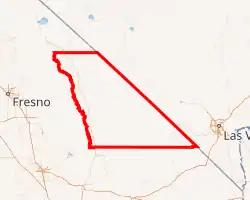
Interactive map of Inyo County | |
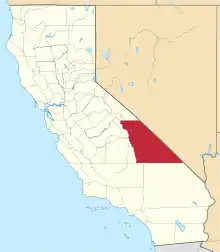 Location in the state of California | |
| Coordinates: 36°35′N 117°25′W | |
| Country | |
| State | |
| Region | Eastern California |
| Established | March 22, 1866[1] |
| Named for | "dwelling place of the great spirit" in Mono language |
| County seat | Independence |
| Largest city | Bishop |
| Government | |
| • Board of Supervisors | Supervisors[2]
|
| • Assemblymember | Devon Mathis (R) |
| • State senator | Andreas Borgeas (R)[3] |
| • U. S. rep. | Jay Obernolte (R) |
| Area | |
| • Total | 10,227 sq mi (26,490 km2) |
| • Land | 10,181 sq mi (26,370 km2) |
| • Water | 46 sq mi (120 km2) |
| Highest elevation | 14,505 ft (4,421 m) |
| Lowest elevation | −279 ft (−85 m) |
| Population | |
| • Total | 18,546 |
| • Estimate (2019)[6] | 18,039 |
| • Density | 1.8/sq mi (0.70/km2) |
| Time zone | UTC−8 (Pacific Time Zone) |
| • Summer (DST) | UTC−7 (Pacific Daylight Time) |
| Area codes | 442/760 |
| FIPS code | 06-027 |
| GNIS feature ID | 1804637 |
| Website | www |
History
Present-day Inyo county has been the historic homeland for thousands of years of the Mono tribe, Coso people, Timbisha, Kawaiisu, and Southern Paiute Native Americans. They spoke the Paiute language, Timbisha language and the Mono language with Mono traditional narratives. The descendants of these ancestors continue to live in their traditional homelands in the Owens River Valley and in Death Valley National Park.
Inyo County was formed in 1866 out of the territory of the unorganized Coso County, which had been created on April 4, 1864, from parts of Mono and Tulare Counties.[8] It acquired more territory from Mono County in 1870 and Kern County and San Bernardino County in 1872.
For many years it has been commonly believed that the county derived its name from the Mono tribe's name for the mountains in its former homeland. Actually the name came to be thought of, mistakenly, as the name of the mountains to the east of the Owens Valley when the first whites there asked the local Paiutes for the name of the mountains to the east. The local Paiutes responded that that was the land of Inyo. They meant by this that those lands belonged to the Shoshone tribe headed by a man whose name was Inyo. Inyo was the name of the headman of the Panamint band of Paiute-Shoshone people at the time of contact when the first whites, the Bennett-Arcane Party of 1849, wandered, lost, into Death Valley on their expedition to the gold fields of western California. The Owens Valley whites misunderstood the local Paiute and thought that Inyo was the name of the mountains when actually it was the name of the chief, or headman, of the tribe that had those mountains as part of their homeland.
"Indian George", a fixture of many of the stories of early Death Valley days, was Inyo's son. Indian George's Shoshone name was "Bah-Vanda-Sa-Va-Nu-Kee", which means "The Boy Who Ran Away", a name he was given when he became terrified of the whites and their wheeled wagons and huge buffalo, none of which the Shoshone had ever seen before when they came wandering down Furnace Creek Wash in December 1849. In 1940, when Bah-vanda was around 100 years old, J.C. Boyles, a Panamint Shoshone who had become educated, came back to the Panamint Valley and interviewed Bah-Vanda at length about the early days of his life, including the events of 1849, and it is in this interview (which can be found in the February 1940 issue of The Desert magazine) that Bah-vanda refers to his father, Inyo.
To supply the growing City of Los Angeles, water was diverted from the Owens River into the Los Angeles Aqueduct in 1913. The Owens River Valley cultures and environments changed substantially. From the 1910s to 1930s the Los Angeles Department of Water and Power purchased much of the valley for water rights and control. In 1941 the Los Angeles Department of Water and Power extended the Los Angeles Aqueduct system further upriver into the Mono Basin.
Natural history
Inyo County is host to a number of natural superlatives. Among them are:
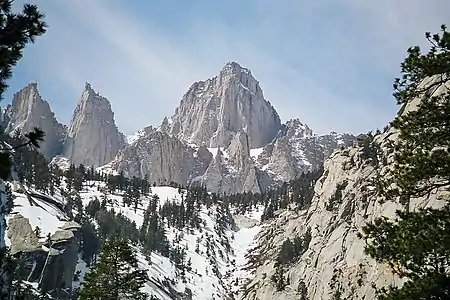
- Mount Whitney, with an elevation of 14,505 feet (4,421 m), the highest point in the contiguous United States, the 12th highest peak in the U.S., and the 24th highest peak in North America.
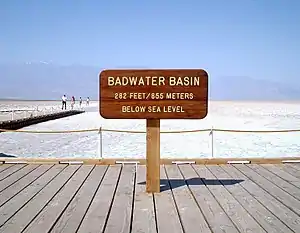
- Badwater Basin, in Death Valley, the lowest point in North America
- Methuselah, an ancient Bristlecone pine tree and one of the oldest living trees on Earth
- Owens Valley, the deepest valley on the American continents
- Two mountain ranges exceeding 14,000 feet (4,300 m) in elevation: The Sierra Nevada and the White Mountains
- Ten of California's twelve peaks which exceed 14,000 feet (a Fourteener) in elevation; the isolated Mount Shasta in northern California, and White Mountain Peak in neighboring Mono County, are the only California 14ers not (at least partly) in Inyo County
- The largest escarpment in the United States, rising from the floor of Death Valley to the top of Telescope Peak in the Panamint Range
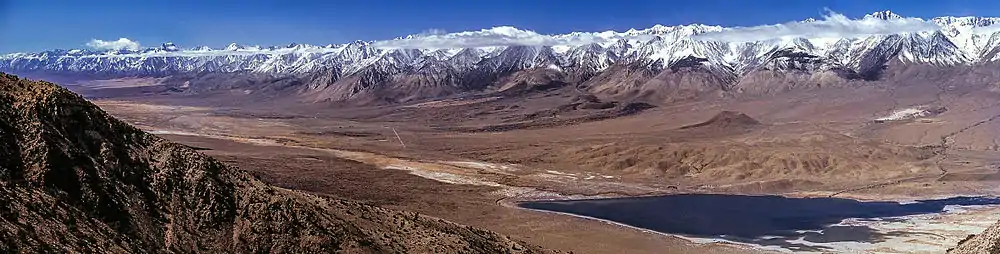
Geography
Mount Whitney, the highest peak in the contiguous United States, is on Inyo County's western border (with Tulare County). The Badwater Basin in Death Valley National Park, the lowest place in North America, is in eastern Inyo County. The difference between the two points is about 14,700 feet (4,500 m). They are not visible from each other, but both can be observed from the Panamint Range on the west side of Death Valley, above the Panamint Valley. Thus, Inyo County has the greatest elevation difference among all of the counties and county-equivalents in the contiguous United States.
According to the U.S. Census Bureau, the county has a total area of 10,227 square miles (26,490 km2), of which 10,181 square miles (26,370 km2) is land and 46 square miles (120 km2) (0.5%) is water.[9] It is the second-largest county by area in California and the ninth-largest in the United States (excluding boroughs and census areas in Alaska).
Lakes
- Camp Lake
- Cottonwood Lakes
- Diaz Lake
- Dingleberry Lake
- Granite Lake
- Inconsolable Lake
- Loch Leven
- Mills Lake
- Pee Wee Lake
- Robinson Lake
- Rock Creek Lake
- Lake Sabrina
- Weir Lake
- Wishbone Lake
National protected areas
There are 22 official wilderness areas in Inyo County that are part of the National Wilderness Preservation System. This is the second-largest number of any county, exceeded only by San Bernardino County's 35 wilderness areas. Most of these are managed solely by the Bureau of Land Management, but four are integral components of Death Valley National Park or Inyo National Forest and are thus managed by either the National Park Service or the Forest Service. Some of these wilderness areas also extend into neighboring counties.
Except as noted, the wilderness areas are managed solely by the Bureau of Land Management and lie entirely within Inyo County:
- Argus Range Wilderness
- Coso Range Wilderness
- Darwin Falls Wilderness
- Death Valley Wilderness (part)
- Funeral Mountains Wilderness
- Golden Trout Wilderness (part)
- Ibex Wilderness
- Inyo Mountains Wilderness (part)
- John Muir Wilderness (part)
- Malpais Mesa Wilderness
- Manly Peak Wilderness
- Nopah Range Wilderness
- Owens Peak Wilderness (part)
- Pahrump Valley Wilderness (part)
- Piper Mountain Wilderness
- Resting Spring Range Wilderness
- Sacatar Trail Wilderness (part)
- Saddle Peak Hills Wilderness (part)
- South Nopah Range Wilderness
- South Sierra Wilderness (part)
- Surprise Canyon Wilderness
- Sylvania Mountains Wilderness
Death Valley National Park
Death Valley National Park is a mostly arid United States National Park east of the Sierra Nevada mountain range in southern Inyo County and northern San Bernardino County in California, with a small extension into southwestern Nye County and extreme southern Esmeralda County in Nevada. In addition, there is an exclave (Devil's Hole) in southern Nye County. The park covers 5,262 square miles (13,630 km2), encompassing Saline Valley, a large part of Panamint Valley, almost all of Death Valley, and parts of several mountain ranges.[10] Death Valley National Monument was proclaimed in 1933, placing the area under federal protection. In 1994, the monument was redesignated a national park, as well as being substantially expanded to include Saline and Eureka Valleys.[10]
It is the hottest and driest of the national parks in the United States. It also features the second-lowest point in the Western Hemisphere and the lowest point in North America at the Badwater Basin, which is 279 feet (85 m) below sea level.[11] It is home to many species of plants and animals that have adapted to this harsh desert environment. Some examples include Creosote Bush, Bighorn Sheep, Coyote, and the Death Valley Pupfish, a survivor of much wetter times. Approximately 95% of the park is designated as wilderness.[12] Death Valley National Park is visited annually by more than 770,000 visitors who come to enjoy its diverse geologic features, desert wildlife, historic sites, scenery, clear night skies, and the solitude of the extreme desert environment.
Other parks
- Alabama Hills Recreation Area
- Last Chance Meadow Research Natural Area
- California Bighorn Sheep Zoological Area
Demographics
2011
| Population, race, and income | |||||
|---|---|---|---|---|---|
| Total population[13] | 18,457 | ||||
| White[13] | 14,339 | 77.7% | |||
| Black or African American[13] | 204 | 1.1% | |||
| American Indian or Alaska Native[13] | 1,846 | 10.0% | |||
| Asian[13] | 271 | 1.5% | |||
| Native Hawaiian or other Pacific Islander[13] | 66 | 0.4% | |||
| Some other race[13] | 1,374 | 7.4% | |||
| Two or more races[13] | 357 | 1.9% | |||
| Hispanic or Latino (of any race)[14] | 3,445 | 18.7% | |||
| Per capita income[15] | $27,532 | ||||
| Median household income[16] | $49,571 | ||||
| Median family income[17] | $68,204 | ||||
Places by population, race, and income
| Places by population and race | ||||||||
|---|---|---|---|---|---|---|---|---|
| Place | Type[18] | Population[13] | White[13] | Other[13] [note 1] |
Asian[13] | Black or African American[13] |
Native American[13] [note 2] |
Hispanic or Latino (of any race)[14] |
| Big Pine | CDP | 1,563 | 77.4% | 7.8% | 1.5% | 1.0% | 12.3% | 11.5% |
| Bishop | City | 3,839 | 78.5% | 17.6% | 2.6% | 0.1% | 1.2% | 31.2% |
| Cartago | CDP | 84 | 100.0% | 0.0% | 0.0% | 0.0% | 0.0% | 0.0% |
| Darwin | CDP | 32 | 100.0% | 0.0% | 0.0% | 0.0% | 0.0% | 0.0% |
| Dixon Lane-Meadow Creek | CDP | 2,800 | 86.1% | 11.3% | 0.0% | 0.0% | 2.5% | 23.0% |
| Furnace Creek | CDP | 115 | 79.1% | 0.0% | 0.0% | 0.0% | 20.9% | 8.7% |
| Homewood Canyon | CDP | 79 | 100.0% | 0.0% | 0.0% | 0.0% | 0.0% | 0.0% |
| Independence | CDP | 520 | 73.8% | 7.1% | 0.6% | 2.1% | 16.3% | 7.9% |
| Keeler | CDP | 88 | 100.0% | 0.0% | 0.0% | 0.0% | 0.0% | 0.0% |
| Lone Pine | CDP | 2,076 | 79.1% | 5.3% | 3.0% | 1.3% | 11.2% | 18.3% |
| Mesa | CDP | 442 | 77.4% | 17.0% | 5.7% | 0.0% | 0.0% | 16.1% |
| Olancha | CDP | 245 | 52.2% | 47.8% | 0.0% | 0.0% | 0.0% | 38.8% |
| Pearsonville | CDP | 6 | 100.0% | 0.0% | 0.0% | 0.0% | 0.0% | 0.0% |
| Round Valley | CDP | 396 | 87.4% | 4.5% | 0.5% | 0.0% | 7.6% | 14.6% |
| Shoshone | CDP | 36 | 94.4% | 0.0% | 0.0% | 0.0% | 5.6% | 8.3% |
| Tecopa | CDP | 98 | 100.0% | 0.0% | 0.0% | 0.0% | 0.0% | 5.1% |
| Trona | CDP | 0 | 0.0% | 0.0% | 0.0% | 0.0% | 0.0% | 0.0% |
| Valley Wells | CDP | 0 | 0.0% | 0.0% | 0.0% | 0.0% | 0.0% | 0.0% |
| West Bishop | CDP | 3,019 | 89.7% | 4.1% | 1.5% | 4.3% | 0.4% | 15.8% |
| Wilkerson | CDP | 484 | 100.0% | 0.0% | 0.0% | 0.0% | 0.0% | 0.0% |
| Places by population and income | |||||
|---|---|---|---|---|---|
| Place | Type[18] | Population[19] | Per capita income[15] | Median household income[16] | Median family income[17] |
| Big Pine | CDP | 1,563 | $28,276 | $63,269 | $75,500 |
| Bishop | City | 3,839 | $27,205 | $34,258 | $61,574 |
| Cartago | CDP | 84 | $37,211 | $44,293 | [20] |
| Darwin | CDP | 32 | $18,525 | $33,929 | [20] |
| Dixon Lane-Meadow Creek | CDP | 2,800 | $26,640 | $56,620 | $68,385 |
| Furnace Creek | CDP | 115 | $30,670 | $31,000 | $92,813 |
| Homewood Canyon | CDP | 79 | $5,525 | $15,347 | [20] |
| Independence | CDP | 520 | $26,418 | $43,750 | $64,044 |
| Keeler | CDP | 88 | $20,125 | $14,821 | $14,565 |
| Lone Pine | CDP | 2,076 | $20,995 | $35,938 | $48,214 |
| Mesa | CDP | 442 | $31,341 | $62,014 | $64,063 |
| Olancha | CDP | 245 | $20,648 | $37,250 | $102,802 |
| Pearsonville | CDP | 6 | [20] | [20] | [20] |
| Round Valley | CDP | 396 | $34,338 | $75,341 | $83,125 |
| Shoshone | CDP | 36 | $22,358 | $41,250 | $41,250 |
| Tecopa | CDP | 98 | $17,664 | $22,188 | $21,875 |
| Trona | CDP | 0 | [20] | [20] | [20] |
| Valley Wells | CDP | 0 | [20] | [20] | [20] |
| West Bishop | CDP | 3,019 | $33,802 | $79,219 | $95,208 |
| Wilkerson | CDP | 484 | $34,174 | $49,167 | $71,875 |
2010
| Historical population | |||
|---|---|---|---|
| Census | Pop. | %± | |
| 1870 | 1,956 | — | |
| 1880 | 2,928 | 49.7% | |
| 1890 | 3,544 | 21.0% | |
| 1900 | 4,377 | 23.5% | |
| 1910 | 6,974 | 59.3% | |
| 1920 | 7,031 | 0.8% | |
| 1930 | 6,555 | −6.8% | |
| 1940 | 7,625 | 16.3% | |
| 1950 | 11,658 | 52.9% | |
| 1960 | 11,684 | 0.2% | |
| 1970 | 15,571 | 33.3% | |
| 1980 | 17,895 | 14.9% | |
| 1990 | 18,281 | 2.2% | |
| 2000 | 17,945 | −1.8% | |
| 2010 | 18,546 | 3.3% | |
| 2019 (est.) | 18,039 | [6] | −2.7% |
| U.S. Decennial Census[21] 1790–1960[22] 1900–1990[23] 1990–2000[24] 2010–2015[5] | |||
The 2010 United States Census reported that Inyo County had a population of 18,546. The racial makeup of Inyo County was 13,741 (74.1%) White, 109 (0.6%) African American, 2,121 (11.4%) Native American, 243 (1.3%) Asian, 16 (0.1%) Pacific Islander, 1,676 (9.0%) from other races, and 640 (3.5%) from two or more races. Hispanic or Latino of any race were 3,597 persons (19.4%).[25]
| Population reported at 2010 United States Census | |||||||||
|---|---|---|---|---|---|---|---|---|---|
Population | American | American | Islander | races | more races | or Latino (of any race) | |||
| Inyo County | 18,546 | 13,741 | 109 | 2,121 | 243 | 16 | 1,676 | 640 | 3,597 |
city | Population | American | American | Islander | races | more races | or Latino (of any race) | ||
| Bishop | 3,879 | 2,867 | 22 | 91 | 61 | 1 | 723 | 114 | 1,200 |
place | Population | American | American | Islander | races | more races | or Latino (of any race) | ||
| Big Pine | 1,756 | 1,192 | 3 | 438 | 13 | 1 | 52 | 57 | 182 |
| Cartago | 92 | 63 | 0 | 7 | 0 | 0 | 11 | 11 | 16 |
| Darwin | 43 | 38 | 0 | 2 | 1 | 1 | 0 | 1 | 2 |
| Dixon Lane-Meadow Creek | 2,645 | 2,287 | 6 | 32 | 47 | 3 | 215 | 55 | 493 |
| Furnace Creek | 24 | 6 | 0 | 16 | 0 | 0 | 0 | 2 | 0 |
| Homewood Canyon | 44 | 37 | 0 | 0 | 0 | 0 | 5 | 2 | 6 |
| Independence | 669 | 493 | 6 | 98 | 8 | 1 | 28 | 35 | 93 |
| Keeler | 66 | 63 | 0 | 0 | 2 | 0 | 0 | 1 | 6 |
| Lone Pine | 2,035 | 1,334 | 6 | 205 | 17 | 1 | 376 | 96 | 694 |
| Mesa | 251 | 220 | 0 | 10 | 3 | 0 | 14 | 4 | 26 |
| Olancha | 192 | 133 | 0 | 4 | 8 | 0 | 38 | 9 | 47 |
| Pearsonville | 17 | 16 | 0 | 0 | 0 | 0 | 1 | 0 | 1 |
| Round Valley | 435 | 333 | 38 | 21 | 3 | 0 | 27 | 13 | 69 |
| Shoshone | 31 | 28 | 1 | 1 | 0 | 0 | 0 | 1 | 0 |
| Tecopa | 150 | 119 | 1 | 8 | 2 | 0 | 1 | 19 | 8 |
| Trona | 18 | 18 | 0 | 0 | 0 | 0 | 0 | 0 | 0 |
| Valley Wells | 0 | 0 | 0 | 0 | 0 | 0 | 0 | 0 | 0 |
| West Bishop | 2,607 | 2,373 | 10 | 28 | 45 | 1 | 72 | 78 | 261 |
| Wilkerson | 563 | 524 | 0 | 13 | 5 | 1 | 5 | 15 | 53 |
unincorporated areas | Population | American | American | Islander | races | more races | or Latino (of any race) | ||
| All others not CDPs (combined) | 3,029 | 1,597 | 16 | 1,147 | 28 | 6 | 108 | 127 | 440 |
2000
At the 2000 census,[26] there were 17,945 people, 7,703 households and 4,937 families residing in the county. The population density was 2 per square mile (1/km2). There were 9,042 housing units at an average density of 1 per square mile (0/km2). The racial makeup of the county was 80.1% White, 0.2% Black or African American, 10.0% Native American, 0.9% Asian, 0.1% Pacific Islander, 4.6% from other races, and 4.2% from two or more races. 12.6% of the population were Hispanic or Latino of any race. 16.4% were of German, 12.2% English, 10.6% Irish and 5.0% American ancestry according to Census 2000. 89.2% spoke English and 9.3% Spanish as their first language.
There were 7,703 households, of which 27.9% had children under the age of 18 living with them, 49.8% were married couples living together, 9.9% had a female householder with no husband present, and 35.9% were non-families. 31.4% of all households were made up of individuals, and 13.6% had someone living alone who was 65 years of age or older. The average household size was 2.31 and the average family size was 2.88.
24.4% of the population were under the age of 18, 5.8% from 18 to 24, 23.4% from 25 to 44, 27.3% from 45 to 64, and 19.1% who were 65 years of age or older. The median age was 43 years. For every 100 females there were 95.4 males. For every 100 females age 18 and over, there were 92.9 males.
The median household income was $35,006 and the median family income was $44,970. Males had a median income of $37,270 versus $25,549 for females. The per capita income for the county was $19,639. About 9.3% of families and 12.6% of the population were below the poverty line, including 16.0% of those under age 18 and 8.3% of those age 65 or over.
Politics
Voter registration
| Population and registered voters | ||
|---|---|---|
| Total population[13] | 18,457 | |
| Registered voters[27][note 3] | 9,922 | 53.8% |
| Democratic[27] | 3,066 | 30.9% |
| Republican[27] | 4,271 | 43.0% |
| Democratic–Republican spread[27] | -1,205 | -12.1% |
| American Independent[27] | 414 | 4.2% |
| Green[27] | 88 | 0.9% |
| Libertarian[27] | 79 | 0.8% |
| Peace and Freedom[27] | 29 | 0.3% |
| Americans Elect[27] | 0 | 0.0% |
| Other[27] | 46 | 0.5% |
| No party preference[27] | 1,929 | 19.4% |
Cities by population and voter registration
| Cities by population and voter registration | |||||||
|---|---|---|---|---|---|---|---|
| City | Population[13] | Registered voters[27] [note 3] |
Democratic[27] | Republican[27] | D–R spread[27] | Other[27] | No party preference[27] |
| Bishop | 3,839 | 42.9% | 31.4% | 40.3% | -8.9% | 10.4% | 21.7% |
Overview
Inyo has been a strongly Republican county in Presidential and congressional elections. From 1944 to 2016, the only Democrat to win the county (and the last to win a majority of its vote) was Lyndon Johnson in 1964. However, the county shifted decisively leftward in 2020, narrowly supporting Joe Biden over Donald Trump.
| Year | GOP | DEM | Others |
|---|---|---|---|
| 2020 | 48.73% 4,620 | 48.88% 4,634 | 2.39% 216 |
| 2016 | 51.94% 4,248 | 38.57% 3,155 | 9.48% 776 |
| 2012 | 54.01% 4,340 | 42.58% 3,422 | 3.41% 274 |
| 2008 | 52.88% 4,523 | 43.76% 3,743 | 3.37% 288 |
| 2004 | 59.09% 5,091 | 38.88% 3,350 | 2.03% 175 |
| 2000 | 60.31% 4,713 | 33.93% 2,652 | 5.76% 450 |
| 1996 | 51.84% 3,924 | 34.36% 2,601 | 13.79% 1,044 |
| 1992 | 43.58% 3,689 | 31.84% 2,695 | 24.58% 2,080 |
| 1988 | 64.34% 5,042 | 33.85% 2,653 | 1.81% 142 |
| 1984 | 70.32% 5,863 | 28.30% 2,360 | 1.38% 115 |
| 1980 | 64.79% 5,201 | 25.91% 2,080 | 9.30% 746 |
| 1976 | 58.23% 3,905 | 39.29% 2,635 | 2.48% 166 |
| 1972 | 68.07% 4,873 | 28.02% 2,006 | 3.91% 280 |
| 1968 | 54.45% 3,641 | 34.60% 2,314 | 10.95% 732 |
| 1964 | 46.51% 2,751 | 53.44% 3,161 | 0.05% 3 |
| 1960 | 54.65% 2,962 | 45.07% 2,443 | 0.28% 15 |
| 1956 | 66.19% 3,524 | 33.47% 1,782 | 0.34% 18 |
| 1952 | 68.87% 3,819 | 30.62% 1,698 | 0.50% 28 |
| 1948 | 55.79% 2,135 | 40.21% 1,539 | 4.00% 153 |
| 1944 | 50.64% 1,699 | 49.09% 1,647 | 0.27% 9 |
| 1940 | 44.53% 1,483 | 54.65% 1,820 | 0.81% 27 |
| 1936 | 36.47% 912 | 62.38% 1,560 | 1.16% 29 |
| 1932 | 30.91% 698 | 64.61% 1,459 | 4.47% 101 |
| 1928 | 57.37% 1,206 | 40.96% 861 | 1.67% 35 |
| 1924 | 47.52% 950 | 12.81% 256 | 39.67% 793 |
| 1920 | 57.20% 1,195 | 32.65% 682 | 10.15% 212 |
| 1916 | 41.96% 846 | 47.92% 966 | 10.12% 204 |
| 1912 | 0.49% 8 | 49.54% 806 | 49.97% 813 |
| 1908 | 40.94% 583 | 43.40% 618 | 15.66% 223 |
| 1904 | 55.73% 452 | 28.48% 231 | 15.78% 128 |
| 1900 | 42.35% 396 | 54.01% 505 | 3.64% 34 |
| 1896 | 34.01% 286 | 63.26% 532 | 2.73% 23 |
| 1892 | 51.13% 409 | 33.25% 266 | 15.63% 125 |
In the California State Legislature, Inyo County is in the 8th Senate District, represented by Republican Andreas Borgeas,[3] and the 26th Assembly District, represented by Republican Devon Mathis.[29]
The county is in California's 8th congressional district, represented by Republican Jay Obernolte.[30]
On November 4, 2008, Inyo County voted 60.4% for Proposition 8 which amended the California Constitution to ban same-sex marriages.
Crime
The following table includes the number of incidents reported and the rate per 1,000 persons for each type of offense.
| Population and crime rates | ||
|---|---|---|
| Population[13] | 18,457 | |
| Violent crime[31] | 80 | 4.33 |
| Homicide[31] | 2 | 0.11 |
| Forcible rape[31] | 11 | 0.60 |
| Robbery[31] | 7 | 0.38 |
| Aggravated assault[31] | 60 | 3.25 |
| Property crime[31] | 154 | 8.34 |
| Burglary[31] | 75 | 4.06 |
| Larceny-theft[31][note 4] | 177 | 9.59 |
| Motor vehicle theft[31] | 18 | 0.98 |
| Arson[31] | 1 | 0.05 |
Cities by population and crime rates
| Cities by population and crime rates | ||||||||
|---|---|---|---|---|---|---|---|---|
| City | Population[32] | Violent crimes[32] | Violent crime rate per 1,000 persons |
Property crimes[32] | Property crime rate per 1,000 persons | |||
| Bishop | 3,900 | 16 | 4.10 | 137 | 35.13 | |||
County Sheriffs
- W. A. Greenly (22 Mar 1866- 7 Nov 1867)
- William A. Moore (7 Nov 1867- 7 Nov 1875)
- Thomas Passmore (7 Nov 1875- 10 Feb 1878)- Killed On Duty
- William A. Moore (10 Feb 1878- 4 Jul 1879) - Killed On Duty
- Samuel S. Gregg (4 Jul 1879- 7 Nov 1888)
- Fred Charles Scott (7 Nov 1888- 7 Nov 1896)
- Charles Albert Collins ( 7 Nov 1896- 7 Nov 1916)
- Boone Newett (7 Nov 1916- 7 Nov 1918)
- Frank Logan (7 Nov 1918- 7 Nov 1924)
- Charles Albert Collins (7 Nov 1924-7 Nov 1926)
- Tom Hutchinson (7 Nov 1926- 7 Nov 1934)
- Emmett L. Shay (7 Nov 1934- 7 Nov 1942)
- Charles P. Cline (7 Nov 1942- 7 Nov 1954)
- Merrill Howard (7 Nov 1954- 7 Nov 1960)
- Merrill Franklin Culbertson (7 Nov 1960- 7 Nov 1962)
- Merrill L. Curtis (7 Nov 1962- 7 Nov 1970)
- Floyd Barton (7 Nov 1970- 7 Nov 1982)
- Floyd Tidwell (7 Nov 1982- 7 Nov 1984)
- Don Dorsey (7 Nov 1984- 7 Nov 1996)
- Dan Lucas ( 7 Nov 1996- 7 Nov 2006)
- William R. "Bill " Lutze (7 Nov 2006- )
Education
School districts in Inyo County are:
- Big Pine Unified School District
- Bishop Unified School District
- Bishop Union High School District
- Bishop Union Elementary School District
- Death Valley Unified School District
- Lone Pine Unified School District
- Owens Valley Unified School District
- Round Valley School District
Deep Springs College is a two-year alternative education college in Deep Springs Valley.
Notable locations
- Mushroom Rock
- Mount Whitney
- Death Valley National Park
- Badwater Basin
- Lake Manly
- Furnace Creek, California (Hottest air temperature ever recorded here in 1913 at 134.6 °F (57.0 °C). In July 1972, a ground temperature of 201 °F (94 °C) was measured in Furnace Creek. This may be the highest natural ground surface temperature ever recorded.)
Transportation
In the 1920s, automobile clubs and nearby towns started to lobby for trans-Sierra highways over Piute Pass[33] and other locations. However, by end of the 1920s, the Forest Service and the Sierra Club decided that roadless wilderness in the Sierra was valuable, and fought the proposal. The Piute Pass proposal faded out by the early 1930s, with the Forest Service proposing a route over Minaret Summit in 1933.[33] The Minaret Summit route was lobbied against by California's Governor Ronald Reagan in 1972. The expansion of the John Muir and Ansel Adams Wildernesses in the 1980s sealed off the Minaret Summit route.[33]
A trans-Sierra route between Porterville and Lone Pine was proposed by local businessmen in 1923.[34] Eventually, a circuitous route across the Sierra was built across the only trans-Sierra route south of Yosemite: Sherman Pass by 1976.[35] That route is Forest Route 22S05 to the west, and Kennedy Meadow Road (County Route J41) and 9-Mile Canyon Road to the east.
Major highways
.svg.png.webp) U.S. Route 6
U.S. Route 6.svg.png.webp) U.S. Route 395
U.S. Route 395 State Route 127
 State Route 136
 State Route 168
 State Route 178
 State Route 190
Public transportation
Eastern Sierra Transit Authority operates intercity bus service along US 395, as well as local services in Bishop. Service extends south to Lancaster (Los Angeles County) and north to Reno, Nevada. [36]
Airports
Bishop Airport, Independence Airport, Lone Pine Airport and Shoshone Airport are general aviation airports located near their respective cities. Stovepipe Wells Airport and Furnace Creek Airport are located in Death Valley National Park.
Communities
Cities
Census-designated places
Other unincorporated communities
Population ranking
The population ranking of the following table is based on the 2010 census of Inyo County.[37]
† county seat
| Rank | City/Town/etc. | Municipal type | Population (2010 Census) |
|---|---|---|---|
| 1 | Bishop | City | 3,879 |
| 2 | Dixon Lane-Meadow Creek | CDP | 2,645 |
| 3 | West Bishop | CDP | 2,607 |
| 4 | Lone Pine | CDP | 2,035 |
| 5 | Big Pine | CDP | 1,756 |
| 6 | Bishop Reservation[38] | AIAN | 1,588 |
| 7 | † Independence | CDP | 669 |
| 8 | Wilkerson | CDP | 563 |
| 9 | Big Pine Reservation[39] | AIAN | 499 |
| 10 | Round Valley | CDP | 435 |
| 11 | Mesa | CDP | 251 |
| 12 | Lone Pine Reservation[40] | AIAN | 212 |
| 13 | Olancha | CDP | 192 |
| 14 | Tecopa | CDP | 150 |
| 15 | Fort Independence Reservation[41] | AIAN | 93 |
| 16 | Cartago | CDP | 92 |
| 17 | Keeler | CDP | 66 |
| 18 | Homewood Canyon | CDP | 44 |
| 19 | Darwin | CDP | 43 |
| 20 | Shoshone | CDP | 31 |
| t-21 | Furnace Creek | CDP | 24 |
| t-21 | Timbi-Sha Shoshone Reservation[42] | AIAN | 24 |
| 22 | Trona | CDP | 18 |
| 23 | Pearsonville | CDP | 17 |
| 24 | Valley Wells | CDP | 0 (permanent) |
Notes
- Other = Some other race + Two or more races
- Native American = Native Hawaiian or other Pacific Islander + American Indian or Alaska Native
- Percentage of registered voters with respect to total population. Percentages of party members with respect to registered voters follow.
- Only larceny-theft cases involving property over $400 in value are reported as property crimes.
References
- "Inyo County". Geographic Names Information System. United States Geological Survey. Retrieved April 8, 2015.
- "Inyo County Representatives". County of Inyo. Archived from the original on February 19, 2015. Retrieved April 8, 2015.
- "Communities of Interest — County". California Citizens Redistricting Commission. Archived from the original on October 23, 2015. Retrieved April 8, 2015.
- "Mount Whitney". Peakbagger.com. Archived from the original on April 10, 2015. Retrieved April 9, 2015.
- "State & County QuickFacts". United States Census Bureau. Archived from the original on July 11, 2011. Retrieved April 4, 2016.
- "Population and Housing Unit Estimates". Archived from the original on May 4, 2018. Retrieved December 3, 2019.
- "Find a County". National Association of Counties. Archived from the original on May 31, 2011. Retrieved June 7, 2011.
- California; Hittell, Theodore Henry (1865). California, Theodore Henry Hittell, The general laws of the State of California, from 1850 to 1864, H.H. Bancroft, San Francisco, 1865. p.190. Retrieved November 5, 2011.
- "2010 Census Gazetteer Files". United States Census Bureau. August 22, 2012. Archived from the original on September 25, 2015. Retrieved September 26, 2015.
- National Park Index (2001–2003), p. 26
- "USGS National Elevation Dataset (NED) 1 meter Downloadable Data Collection from The National Map 3D Elevation Program (3DEP) - National Geospatial Data Asset (NGDA) National Elevation Data Set (NED)". United States Geological Survey. September 21, 2015. Archived from the original on March 25, 2019. Retrieved September 22, 2015.
- NPS website, "Backcountry Roads"
- U.S. Census Bureau. American Community Survey, 2011 American Community Survey 5-Year Estimates, Table B02001. U.S. Census website . Retrieved 2013-10-26.
- U.S. Census Bureau. American Community Survey, 2011 American Community Survey 5-Year Estimates, Table B03003. U.S. Census website . Retrieved 2013-10-26.
- U.S. Census Bureau. American Community Survey, 2011 American Community Survey 5-Year Estimates, Table B19301. U.S. Census website . Retrieved 2013-10-21.
- U.S. Census Bureau. American Community Survey, 2011 American Community Survey 5-Year Estimates, Table B19013. U.S. Census website . Retrieved 2013-10-21.
- U.S. Census Bureau. American Community Survey, 2011 American Community Survey 5-Year Estimates, Table B19113. U.S. Census website . Retrieved 2013-10-21.
- U.S. Census Bureau. American Community Survey, 2011 American Community Survey 5-Year Estimates. U.S. Census website . Retrieved 2013-10-21.
- U.S. Census Bureau. American Community Survey, 2011 American Community Survey 5-Year Estimates, Table B01003. U.S. Census website . Retrieved 2013-10-21.
- Data unavailable
- "U.S. Decennial Census". United States Census Bureau. Retrieved September 26, 2015.
- "Historical Census Browser". University of Virginia Library. Archived from the original on May 30, 2019. Retrieved September 26, 2015.
- Forstall, Richard L., ed. (March 27, 1995). "Population of Counties by Decennial Census: 1900 to 1990". United States Census Bureau. Archived from the original on September 24, 2015. Retrieved September 26, 2015.
- "Census 2000 PHC-T-4. Ranking Tables for Counties: 1990 and 2000" (PDF). United States Census Bureau. April 2, 2001. Archived (PDF) from the original on December 18, 2014. Retrieved September 26, 2015.
- "2010 Census P.L. 94-171 Summary File Data". United States Census Bureau.
- "U.S. Census website". United States Census Bureau. Retrieved May 14, 2011.
- California Secretary of State. February 10, 2013 – Report of Registration Archived July 27, 2013, at the Wayback Machine. Retrieved 2013-10-31.
- Leip, David. "Dave Leip's Atlas of U.S. Presidential Elections". uselectionatlas.org. Archived from the original on July 9, 2018. Retrieved August 31, 2018.
- "Members Assembly". State of California. Archived from the original on April 24, 2013. Retrieved April 11, 2013.
- "California's 8th Congressional District - Representatives & District Map". Civic Impulse, LLC. Retrieved March 9, 2013.
- Office of the Attorney General, Department of Justice, State of California. Table 11: Crimes – 2009 Archived December 2, 2013, at the Wayback Machine. Retrieved 2013-11-14.
- United States Department of Justice, Federal Bureau of Investigation. Crime in the United States, 2012, Table 8 (California) Archived June 28, 2016, at the Wayback Machine. Retrieved 2013-11-14.
- Marsh, Steve (2015). "The High Sierra Piute Highway" (PDF). US Forest Service.
- "Trail Over Mountains Supported". Los Angeles Times. June 15, 1923. p. II10.
- "See It All in the Sierra". The Fresno Bee. October 24, 1976.
- https://www.estransit.com/routes-schedule/395-routes/
- Promotions, Center for New Media and. "US Census Bureau 2010 Census". census.gov. Retrieved January 18, 2017.
- Staff, Website Services & Coordination. "US Census Bureau 2010 Census Interactive Population Map". census.gov. Retrieved January 18, 2017.
- Staff, Website Services & Coordination. "US Census Bureau 2010 Census Interactive Population Map". census.gov. Retrieved January 18, 2017.
- Staff, Website Services & Coordination. "US Census Bureau 2010 Census Interactive Population Map". census.gov. Archived from the original on February 7, 2017. Retrieved January 18, 2017.
External links
| Wikimedia Commons has media related to Inyo County, California. |
 Inyo County travel guide from Wikivoyage
- Official website

- Inyo County Office of Education
- Inyo County Tourism website
- Eastern California Museum
Places adjacent to Inyo County, California | ||||||||||
|---|---|---|---|---|---|---|---|---|---|---|
| ||||||||||
Municipalities and communities of Inyo County, California, United States | ||
|---|---|---|
| City | Inyo County map | |
| CDPs | ||
| Unincorporated communities |
| |
| Indian reservations | ||
| Ghost towns | ||
| Other | ||
| ||
| Authority control |
|---|